Analysis of GDP Using Linear Regression
Added on 2020-01-23
11 Pages1676 Words133 Views
LINEAR REGRESSIONREPORT1
Table of Contents1. Purpose.........................................................................................................................................32. Background...................................................................................................................................33. Method..........................................................................................................................................34. Results..........................................................................................................................................35. Discussion.....................................................................................................................................86. Recommendations.........................................................................................................................9REFERENCES...................................................................................................................................102
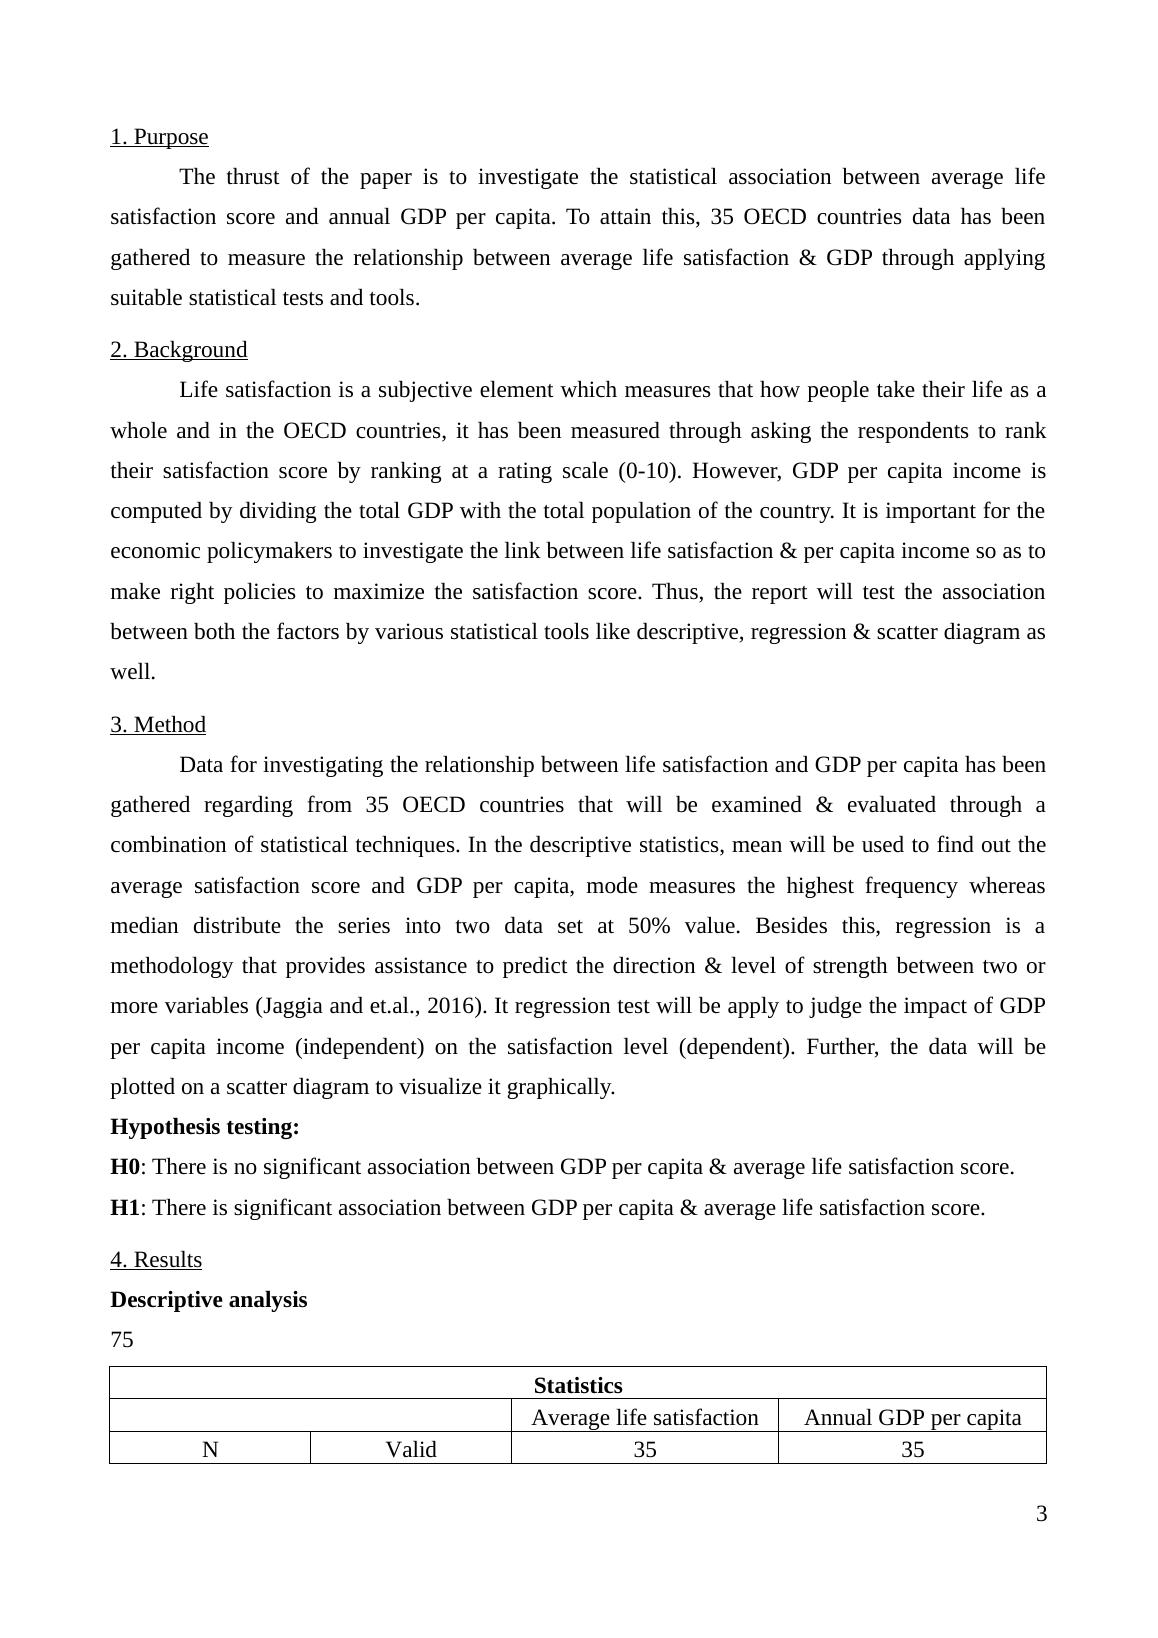
1. PurposeThe thrust of the paper is to investigate the statistical association between average lifesatisfaction score and annual GDP per capita. To attain this, 35 OECD countries data has beengathered to measure the relationship between average life satisfaction & GDP through applyingsuitable statistical tests and tools. 2. BackgroundLife satisfaction is a subjective element which measures that how people take their life as awhole and in the OECD countries, it has been measured through asking the respondents to ranktheir satisfaction score by ranking at a rating scale (0-10). However, GDP per capita income iscomputed by dividing the total GDP with the total population of the country. It is important for theeconomic policymakers to investigate the link between life satisfaction & per capita income so as tomake right policies to maximize the satisfaction score. Thus, the report will test the associationbetween both the factors by various statistical tools like descriptive, regression & scatter diagram aswell. 3. MethodData for investigating the relationship between life satisfaction and GDP per capita has beengathered regarding from 35 OECD countries that will be examined & evaluated through acombination of statistical techniques. In the descriptive statistics, mean will be used to find out theaverage satisfaction score and GDP per capita, mode measures the highest frequency whereasmedian distribute the series into two data set at 50% value. Besides this, regression is amethodology that provides assistance to predict the direction & level of strength between two ormore variables (Jaggia and et.al., 2016). It regression test will be apply to judge the impact of GDPper capita income (independent) on the satisfaction level (dependent). Further, the data will beplotted on a scatter diagram to visualize it graphically. Hypothesis testing:H0: There is no significant association between GDP per capita & average life satisfaction score. H1: There is significant association between GDP per capita & average life satisfaction score.4. ResultsDescriptive analysis 75StatisticsAverage life satisfactionAnnual GDP per capitaNValid35353
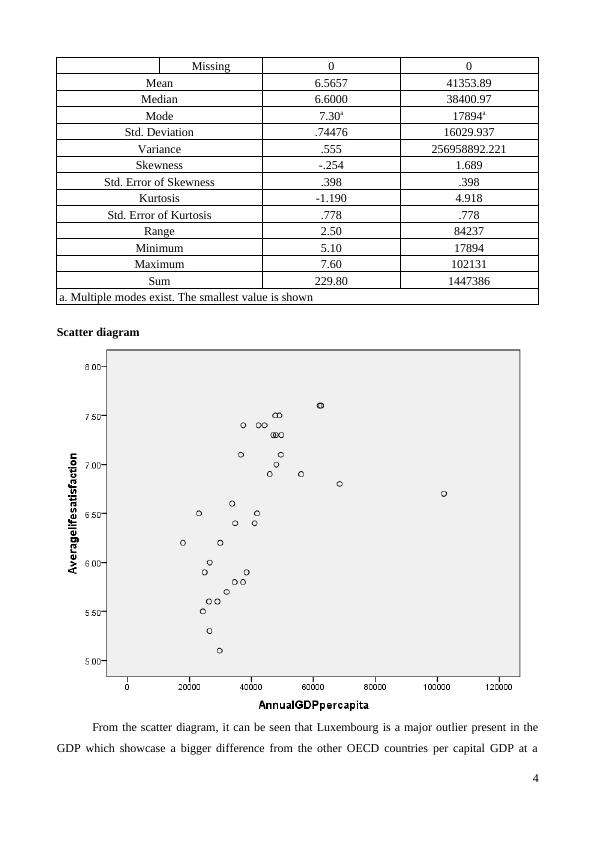
Missing00Mean6.565741353.89Median6.600038400.97Mode7.30a17894aStd. Deviation.7447616029.937Variance.555256958892.221Skewness-.2541.689Std. Error of Skewness.398.398Kurtosis-1.1904.918Std. Error of Kurtosis.778.778Range2.5084237Minimum5.1017894Maximum7.60102131Sum229.801447386a. Multiple modes exist. The smallest value is shownScatter diagram From the scatter diagram, it can be seen that Luxembourg is a major outlier present in theGDP which showcase a bigger difference from the other OECD countries per capital GDP at a4
End of preview
Want to access all the pages? Upload your documents or become a member.
Related Documents
Report on Economic and Quantitative Analysislg...
|10
|1747
|34
impact of GDP on Life Satisfaction of People | Economic and Quantitative Analysislg...
|10
|1709
|15
Influence of GDP per capita on the average life satisfaction scorelg...
|10
|1823
|448
Economic And Quantitative Analysis Reportlg...
|10
|1481
|18
A Study Onaverage Life Satisfaction and GDP per Capita in OECD 2022lg...
|34
|1800
|60
Economics and Quantitative Analysislg...
|12
|1615
|187