Retail Data Analysis: Problem Solving & Digital Operations Report
VerifiedAdded on 2023/04/23
|11
|2100
|287
Report
AI Summary
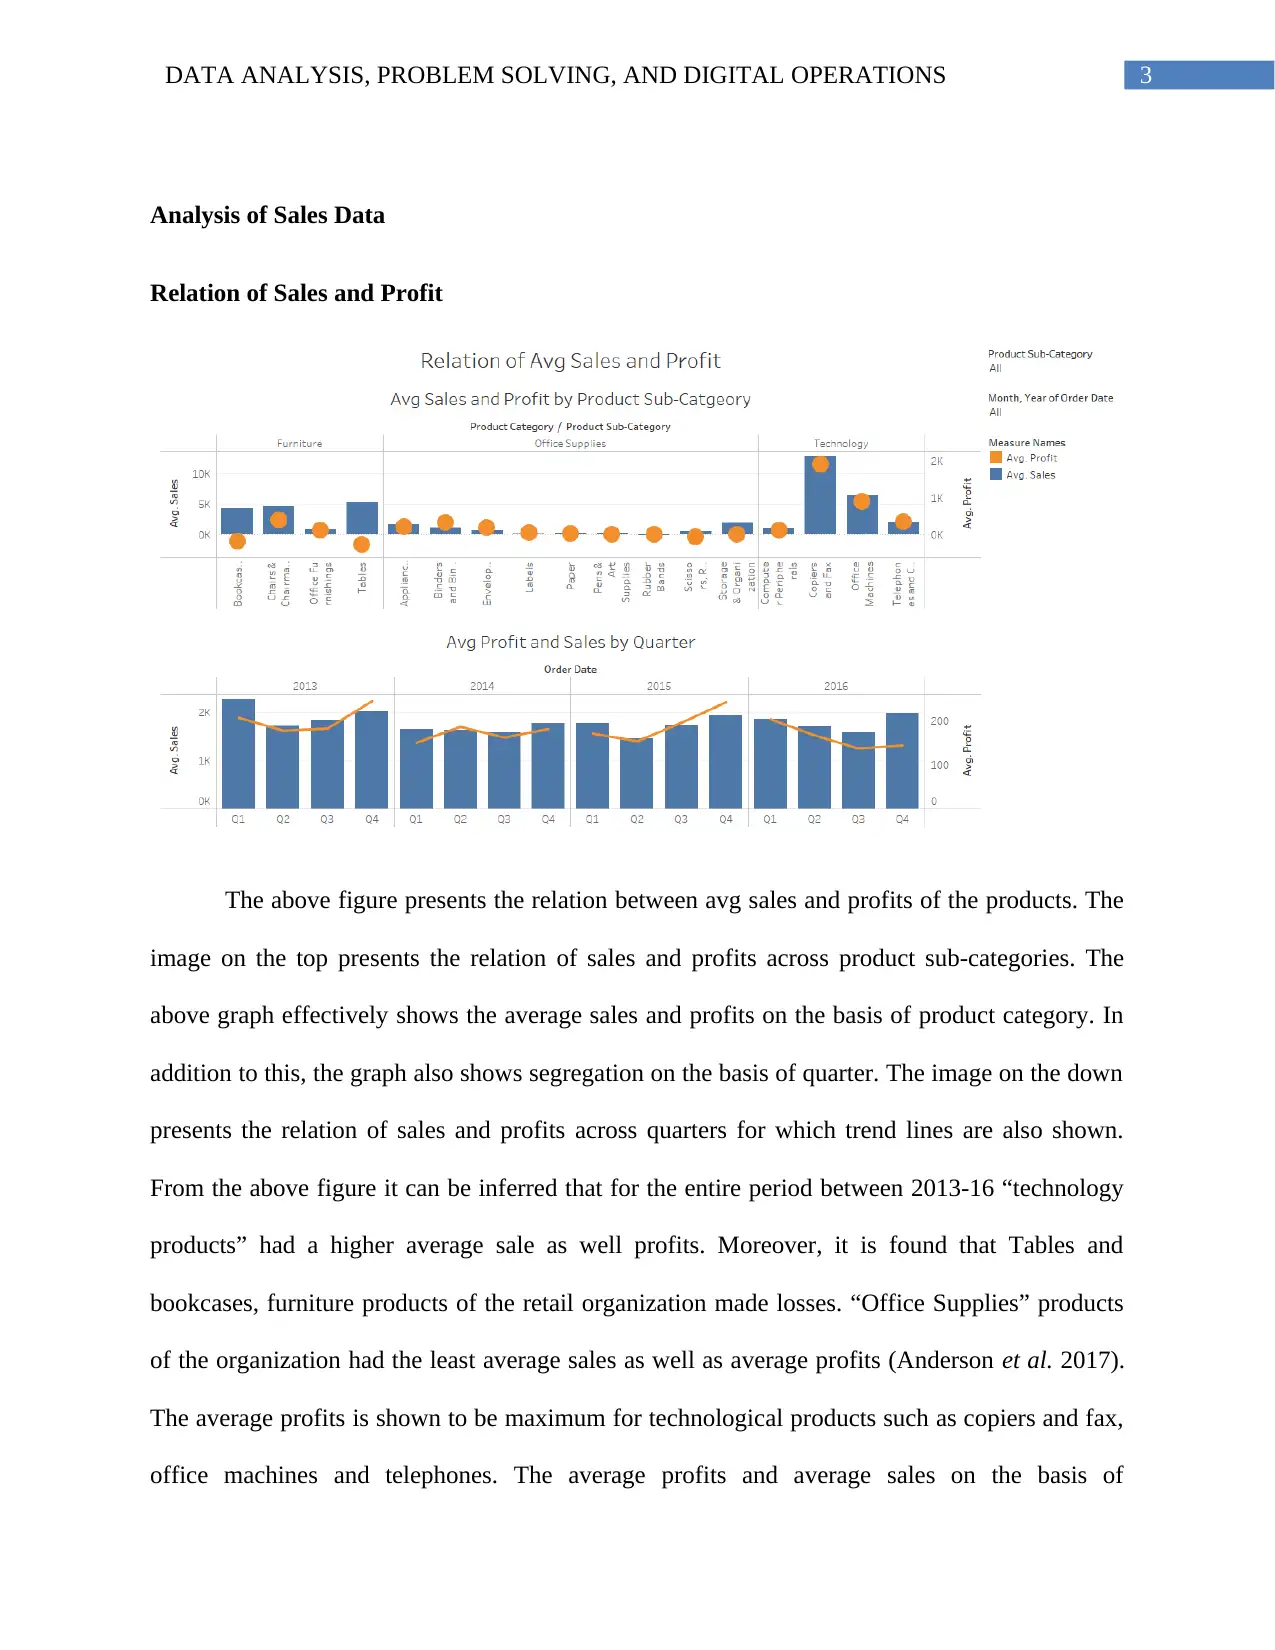
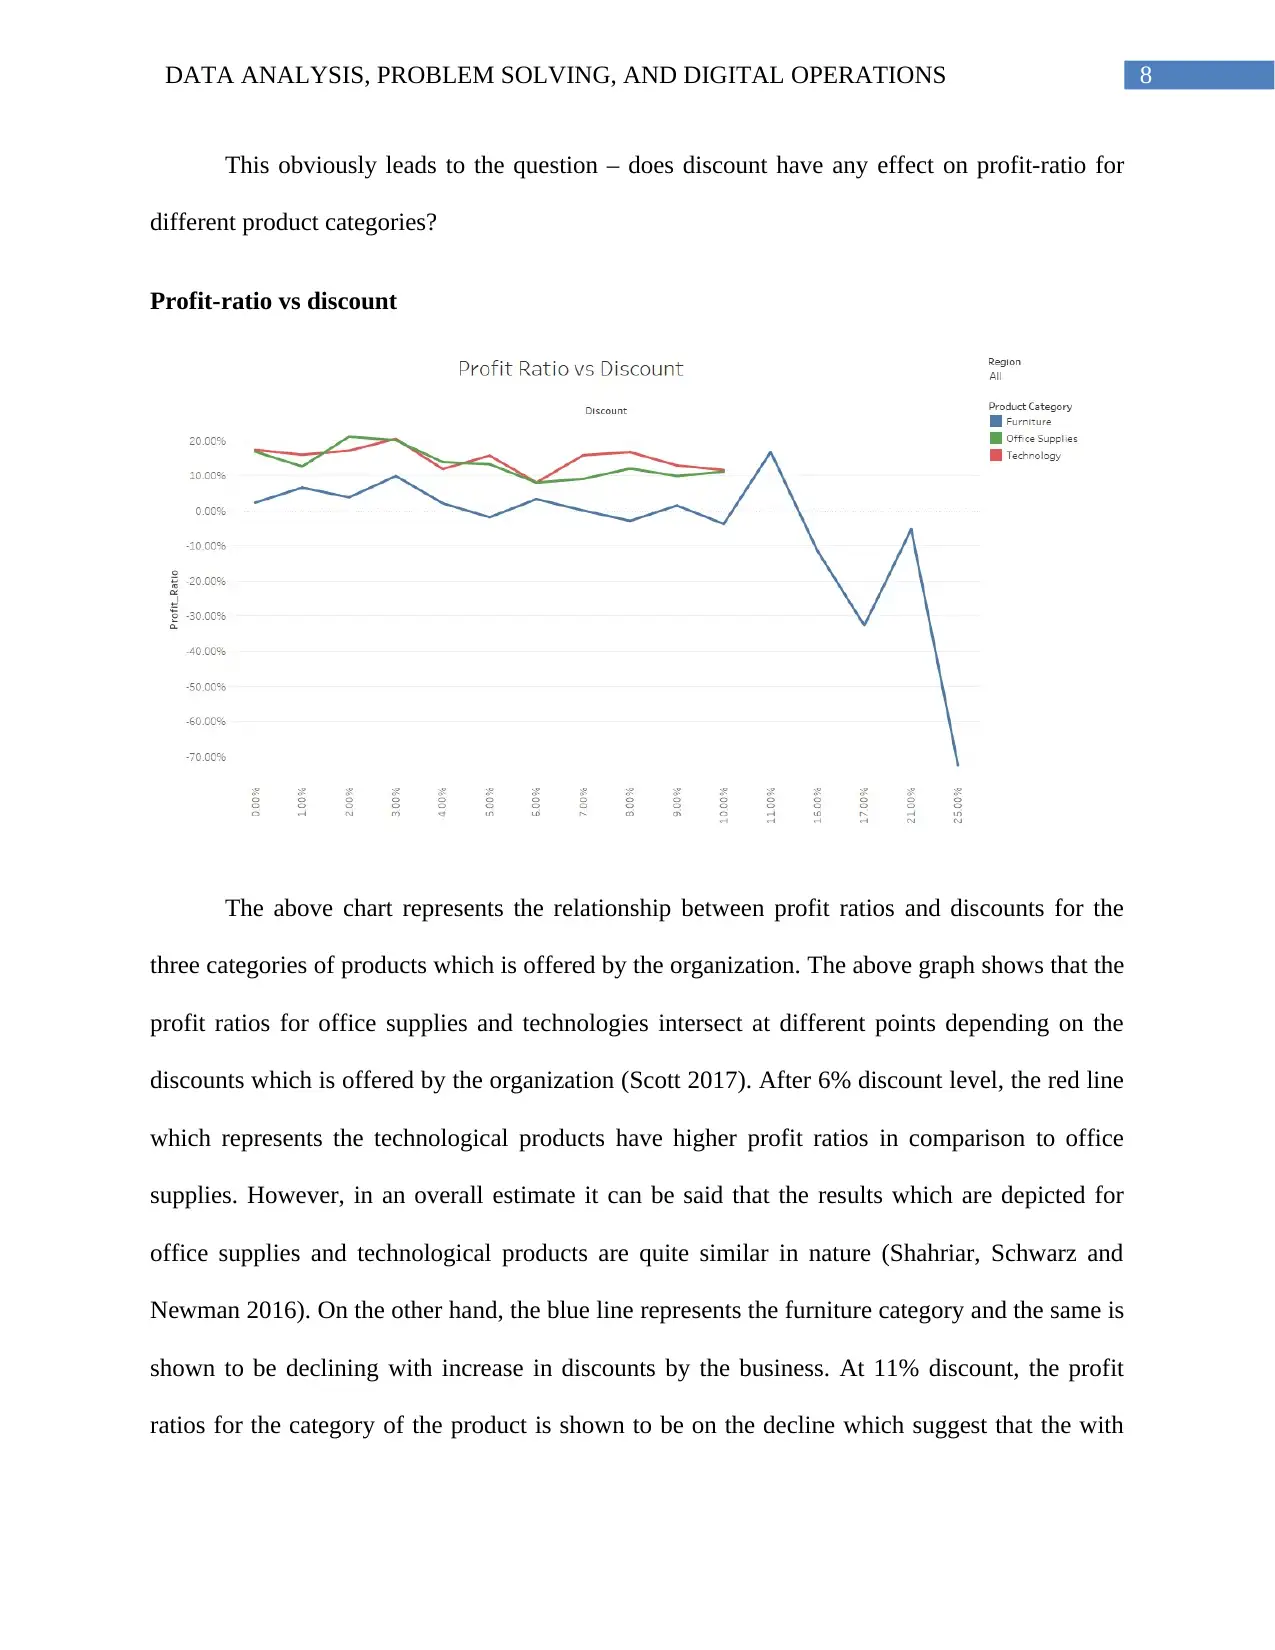
This report presents a comprehensive analysis of a retail organization's sales data, focusing on office supplies, furniture, and technology products. The analysis uses variables like order date, shipping mode, order priority, sales price, discount, and profit, along with newly created variables like 'Total Discount,' to gain insights using Tableau. The report examines the relationship between sales and profits across product sub-categories and quarters, revealing that technology products have the highest average sales and profits, while furniture items like tables and bookcases incur losses. It further investigates the impact of discounts on profit ratios, concluding that non-discounted technology products often yield higher profits than discounted ones. The analysis highlights the profitability of technology products, followed by office supplies, with furniture identified as a loss-making category. This report is available on Desklib, a platform that provides a variety of study resources for students.
1 out of 11
Related Documents


Your All-in-One AI-Powered Toolkit for Academic Success.
+13062052269
info@desklib.com
Available 24*7 on WhatsApp / Email
![[object Object]](/_next/static/media/star-bottom.7253800d.svg)
Copyright © 2020–2026 A2Z Services. All Rights Reserved. Developed and managed by ZUCOL.