Data Analysis & Visualisation Report: T-Test Application on Covid-19
VerifiedAdded on 2023/06/15
|12
|2397
|355
Report
AI Summary
This report details the application of data analysis and visualisation techniques, focusing on the T-test to determine significant differences between two groups—White and BAME patients—regarding Covid-19 infection rates. It explains the principles of T-tests, hypothesis formulation (null and alternative), and the interpretation of results at varying significance levels (p = 0.10, 0.01, and 0.02). The analysis includes paired sample statistics, correlations, and tests to evaluate the infection rate differences, leading to the rejection of the null hypothesis at each significance level. The report also addresses outlier detection within the dataset, specifically identifying an outlier among White patients, and discusses other potentially relevant data features such as gender and age. Finally, it acknowledges limitations related to uncontrolled variables and secondary data sources, concluding with a summary of the findings and their implications for understanding the impact of Covid-19 across different populations.
Analysis and Visualisation
Paraphrase This Document
Need a fresh take? Get an instant paraphrase of this document with our AI Paraphraser
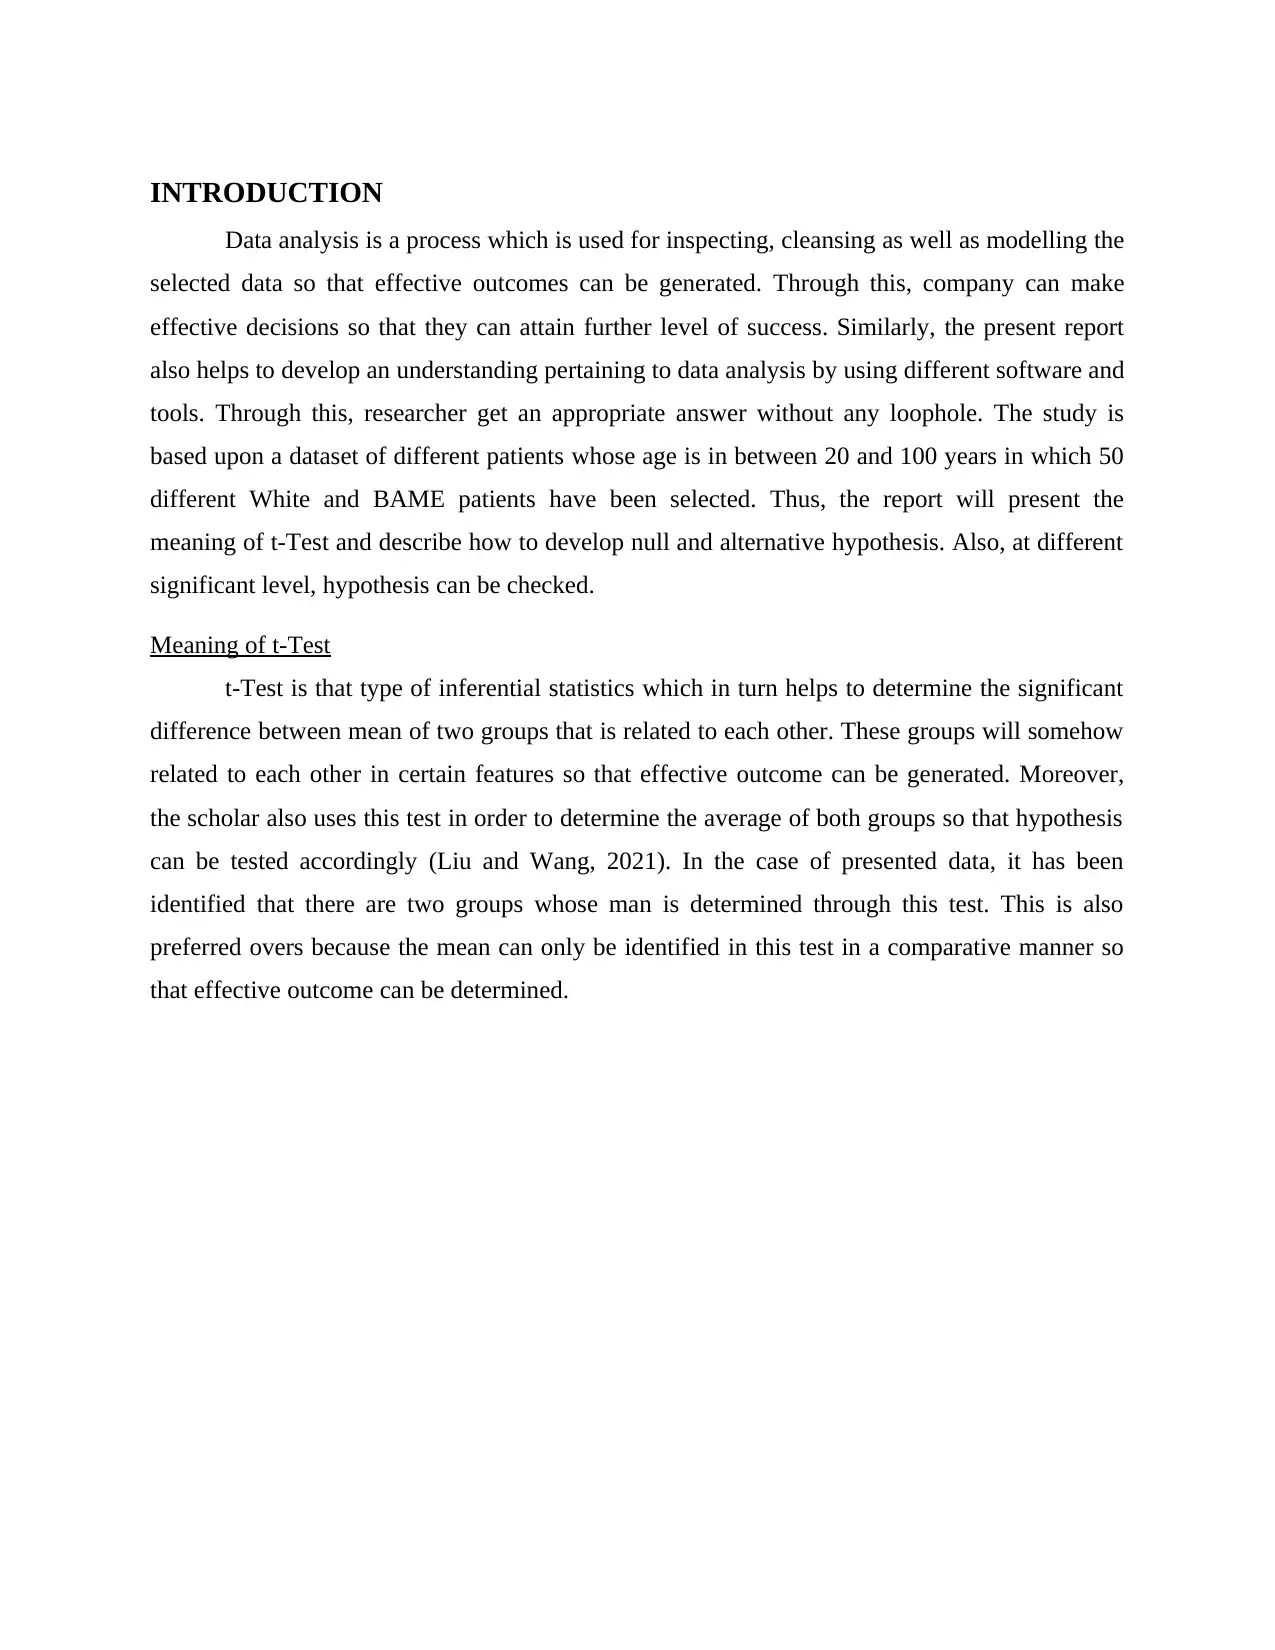
INTRODUCTION
Data analysis is a process which is used for inspecting, cleansing as well as modelling the
selected data so that effective outcomes can be generated. Through this, company can make
effective decisions so that they can attain further level of success. Similarly, the present report
also helps to develop an understanding pertaining to data analysis by using different software and
tools. Through this, researcher get an appropriate answer without any loophole. The study is
based upon a dataset of different patients whose age is in between 20 and 100 years in which 50
different White and BAME patients have been selected. Thus, the report will present the
meaning of t-Test and describe how to develop null and alternative hypothesis. Also, at different
significant level, hypothesis can be checked.
Meaning of t-Test
t-Test is that type of inferential statistics which in turn helps to determine the significant
difference between mean of two groups that is related to each other. These groups will somehow
related to each other in certain features so that effective outcome can be generated. Moreover,
the scholar also uses this test in order to determine the average of both groups so that hypothesis
can be tested accordingly (Liu and Wang, 2021). In the case of presented data, it has been
identified that there are two groups whose man is determined through this test. This is also
preferred overs because the mean can only be identified in this test in a comparative manner so
that effective outcome can be determined.

What is hypothesis and how to develop null and alternative hypothesis
A hypothesis is an assumption or an idea which is proposed for the sake of argument so
that it can determine which result is true or false. Also, it can be stated that it is a statement of
prediction which is tested by the researcher by using an appropriate tool (Scanlan and et.al.,
2021). In the research study, it can be stated that hypothesis is a statement which entails the
purpose or research question and this can be attained by applying effective tool. This is mainly
constructed before conducting any statistical test.
Null hypothesis is presented as H0 and determine no relationship between the variable
whereas alternative hypothesis is H1 which reflected a significant relationship between both
variable. Also, as per the defined question, these hypothesis will be proved at different
significant level and if the value is lower than the standard criteria then alternative hypothesis is
accepted and vice versa (Galaj and Xi, 2021). Thus, these statements prove that there is a
relationship between the variables and examine the pattern which is followed by the data set and
accordingly interpreted the values as well.
Presenting a set of testable hypothesis for an experiment
Null hypothesis (H0): There is no significant change identified between the infection rate of
Covid-19 with white people and BAME.
Alternative hypothesis (H1): There is a significant change identified between the infection rate of
Covid-19 with white people and BAME
Paired Samples Statistics
Mean N Std. Deviation Std. Error Mean
Pair 1
White patient 36.5800 50 11.97973 1.69419
BAME 60.0400 50 23.39192 3.30812
Paired Samples Correlations
⊘ This is a preview!⊘
Do you want full access?
Subscribe today to unlock all pages.
Trusted by 1+ million students worldwide
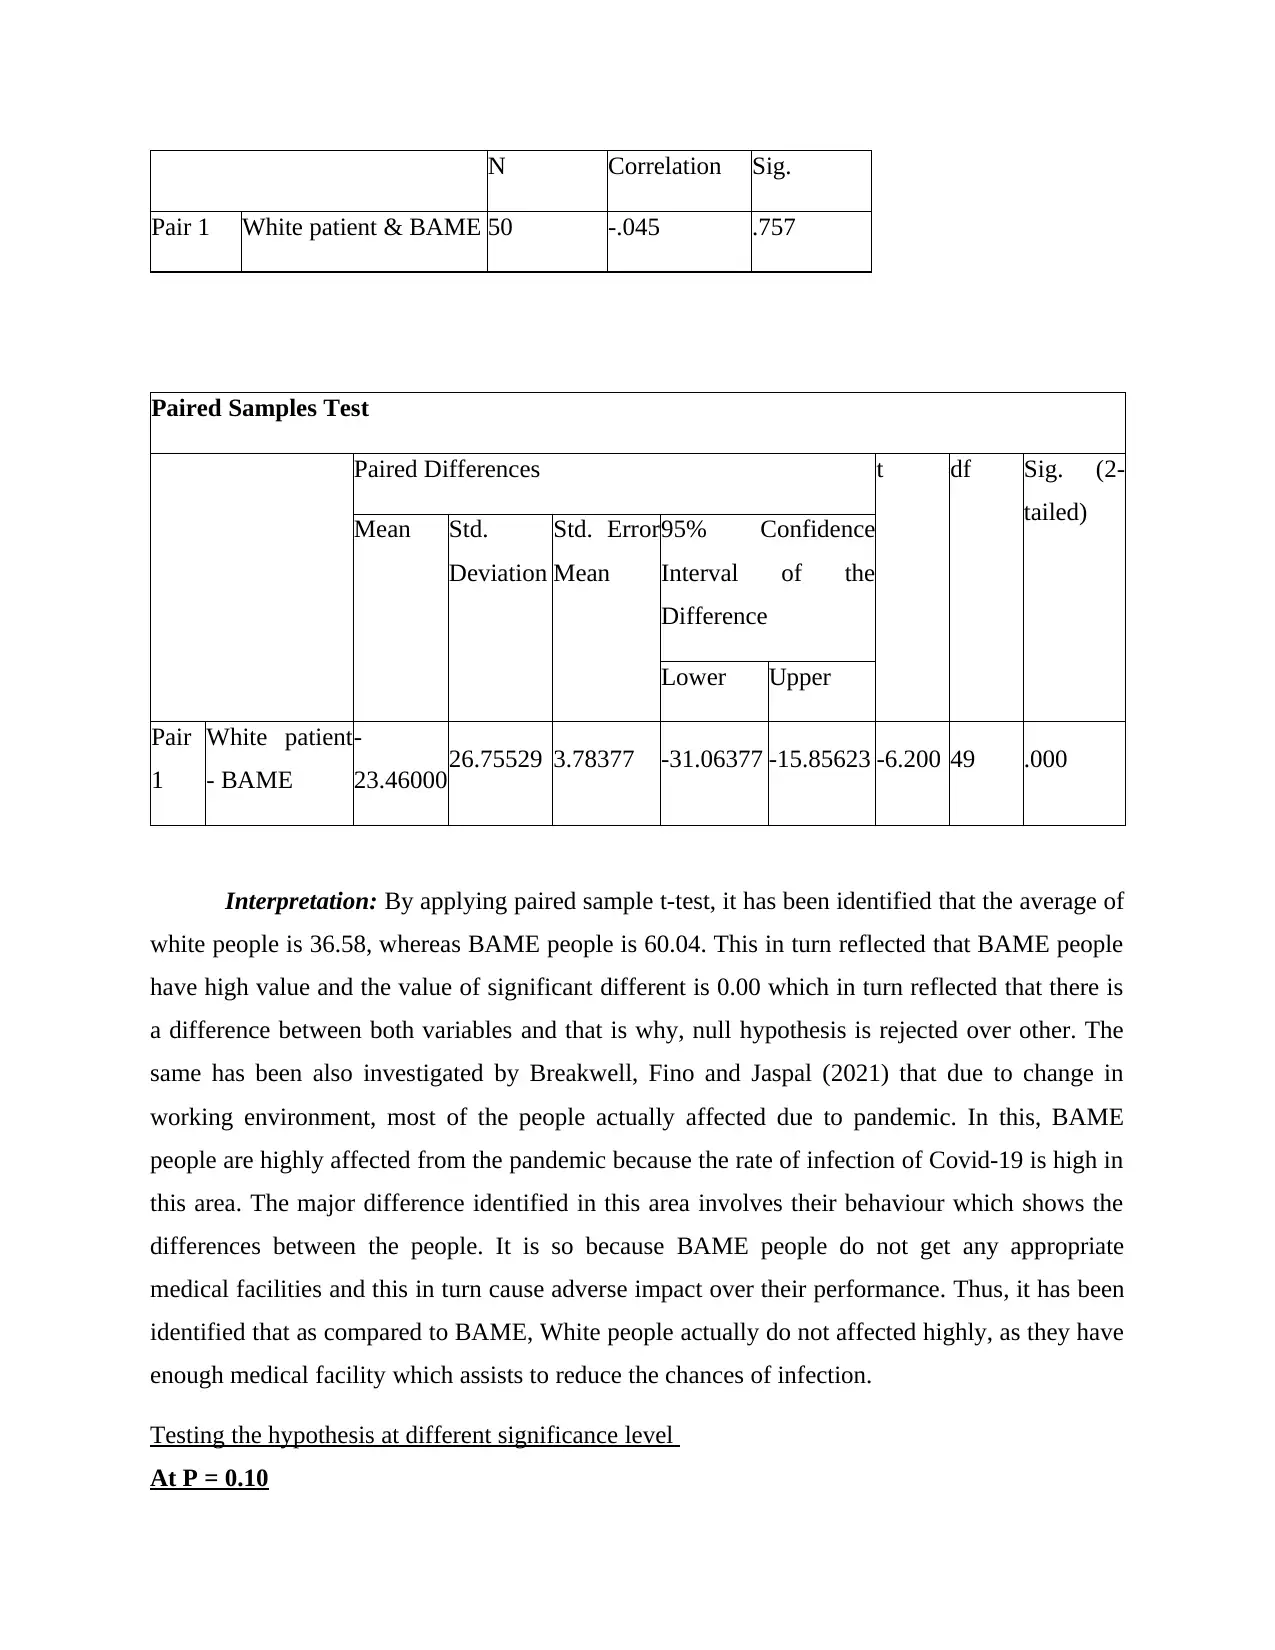
N Correlation Sig.
Pair 1 White patient & BAME 50 -.045 .757
Paired Samples Test
Paired Differences t df Sig. (2-
tailed)
Mean Std.
Deviation
Std. Error
Mean
95% Confidence
Interval of the
Difference
Lower Upper
Pair
1
White patient
- BAME
-
23.4600026.75529 3.78377 -31.06377 -15.85623 -6.200 49 .000
Interpretation: By applying paired sample t-test, it has been identified that the average of
white people is 36.58, whereas BAME people is 60.04. This in turn reflected that BAME people
have high value and the value of significant different is 0.00 which in turn reflected that there is
a difference between both variables and that is why, null hypothesis is rejected over other. The
same has been also investigated by Breakwell, Fino and Jaspal (2021) that due to change in
working environment, most of the people actually affected due to pandemic. In this, BAME
people are highly affected from the pandemic because the rate of infection of Covid-19 is high in
this area. The major difference identified in this area involves their behaviour which shows the
differences between the people. It is so because BAME people do not get any appropriate
medical facilities and this in turn cause adverse impact over their performance. Thus, it has been
identified that as compared to BAME, White people actually do not affected highly, as they have
enough medical facility which assists to reduce the chances of infection.
Testing the hypothesis at different significance level
At P = 0.10
Paraphrase This Document
Need a fresh take? Get an instant paraphrase of this document with our AI Paraphraser
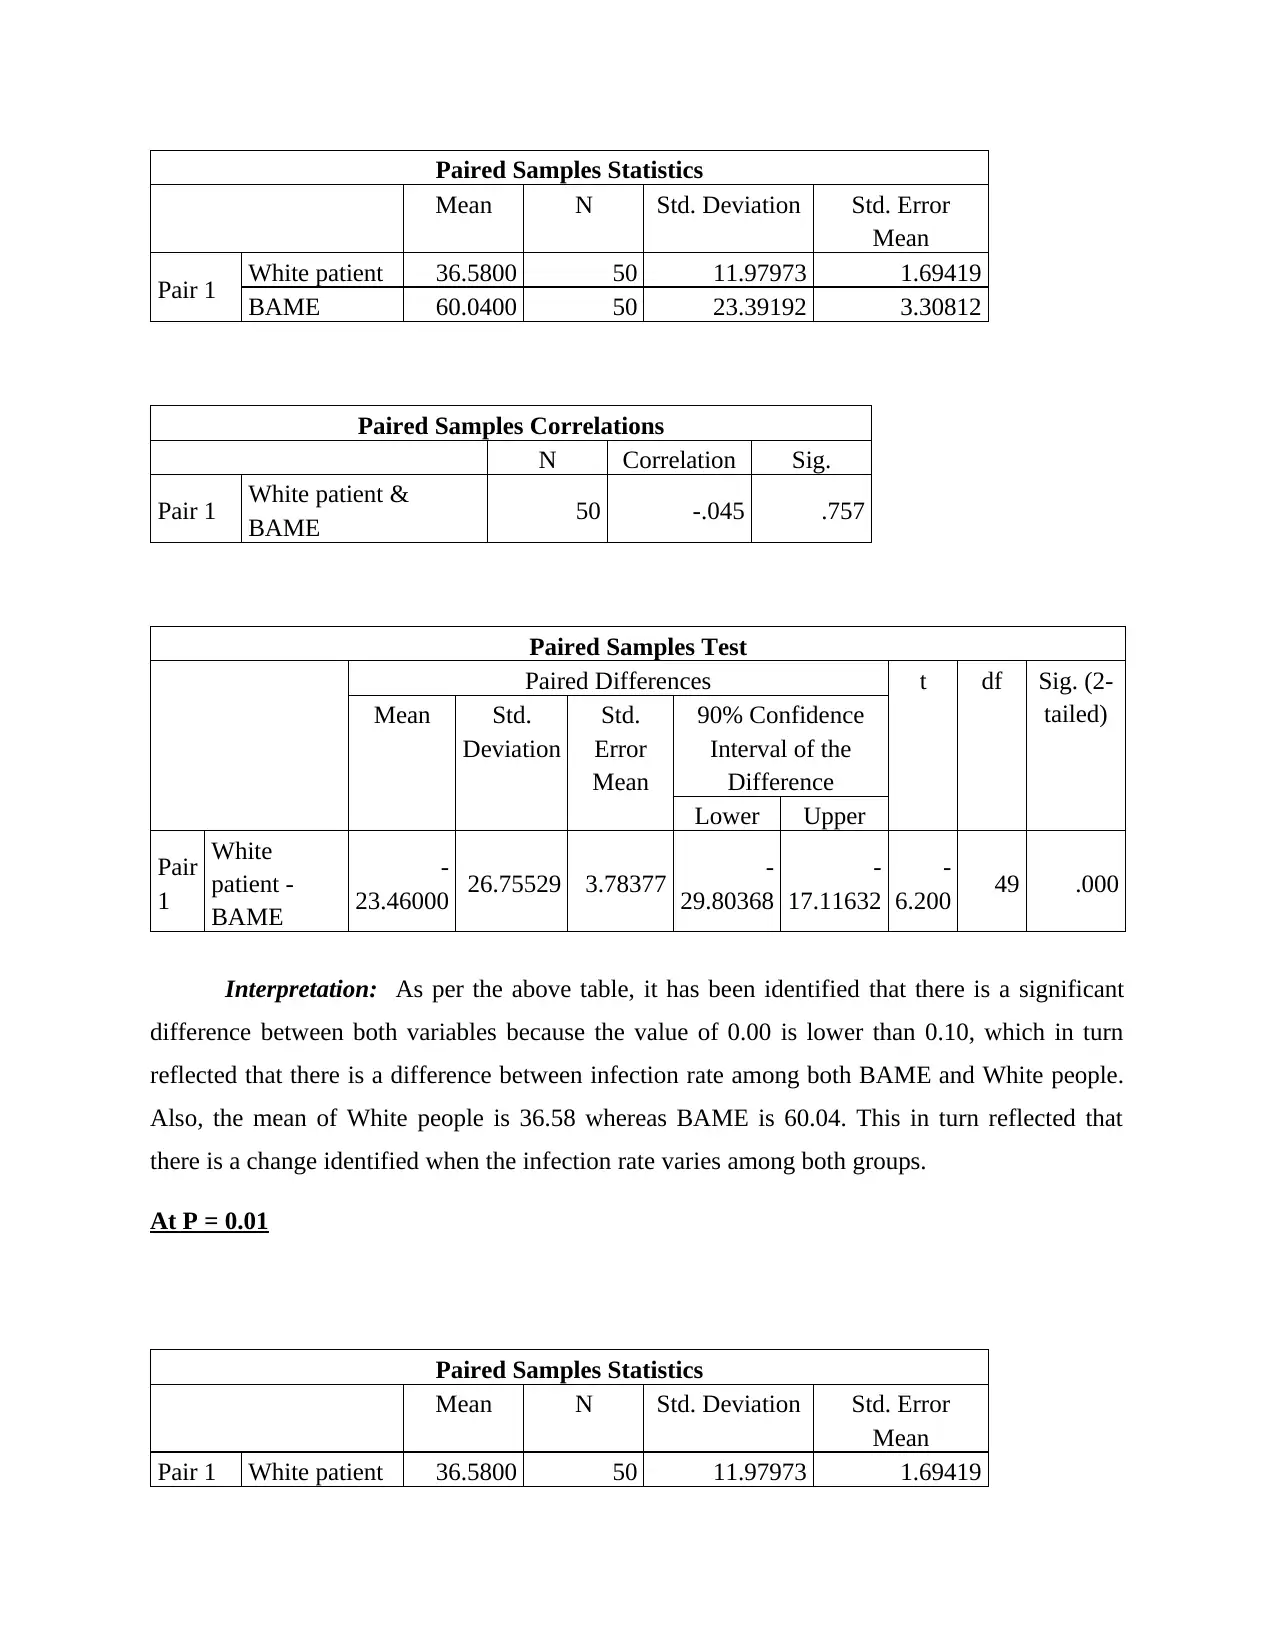
Paired Samples Statistics
Mean N Std. Deviation Std. Error
Mean
Pair 1 White patient 36.5800 50 11.97973 1.69419
BAME 60.0400 50 23.39192 3.30812
Paired Samples Correlations
N Correlation Sig.
Pair 1 White patient &
BAME 50 -.045 .757
Paired Samples Test
Paired Differences t df Sig. (2-
tailed)Mean Std.
Deviation
Std.
Error
Mean
90% Confidence
Interval of the
Difference
Lower Upper
Pair
1
White
patient -
BAME
-
23.46000 26.75529 3.78377 -
29.80368
-
17.11632
-
6.200 49 .000
Interpretation: As per the above table, it has been identified that there is a significant
difference between both variables because the value of 0.00 is lower than 0.10, which in turn
reflected that there is a difference between infection rate among both BAME and White people.
Also, the mean of White people is 36.58 whereas BAME is 60.04. This in turn reflected that
there is a change identified when the infection rate varies among both groups.
At P = 0.01
Paired Samples Statistics
Mean N Std. Deviation Std. Error
Mean
Pair 1 White patient 36.5800 50 11.97973 1.69419
Mean N Std. Deviation Std. Error
Mean
Pair 1 White patient 36.5800 50 11.97973 1.69419
BAME 60.0400 50 23.39192 3.30812
Paired Samples Correlations
N Correlation Sig.
Pair 1 White patient &
BAME 50 -.045 .757
Paired Samples Test
Paired Differences t df Sig. (2-
tailed)Mean Std.
Deviation
Std.
Error
Mean
90% Confidence
Interval of the
Difference
Lower Upper
Pair
1
White
patient -
BAME
-
23.46000 26.75529 3.78377 -
29.80368
-
17.11632
-
6.200 49 .000
Interpretation: As per the above table, it has been identified that there is a significant
difference between both variables because the value of 0.00 is lower than 0.10, which in turn
reflected that there is a difference between infection rate among both BAME and White people.
Also, the mean of White people is 36.58 whereas BAME is 60.04. This in turn reflected that
there is a change identified when the infection rate varies among both groups.
At P = 0.01
Paired Samples Statistics
Mean N Std. Deviation Std. Error
Mean
Pair 1 White patient 36.5800 50 11.97973 1.69419
BAME 60.0400 50 23.39192 3.30812
Paired Samples Correlations
N Correlation Sig.
Pair 1 White patient &
BAME 50 -.045 .757
Paired Samples Test
Paired Differences t df Sig. (2-
tailed)Mean Std.
Deviation
Std.
Error
Mean
99% Confidence
Interval of the
Difference
Lower Upper
Pair
1
White
patient -
BAME
-
23.46000 26.75529 3.78377 -
33.60032
-
13.31968
-
6.200 49 .000
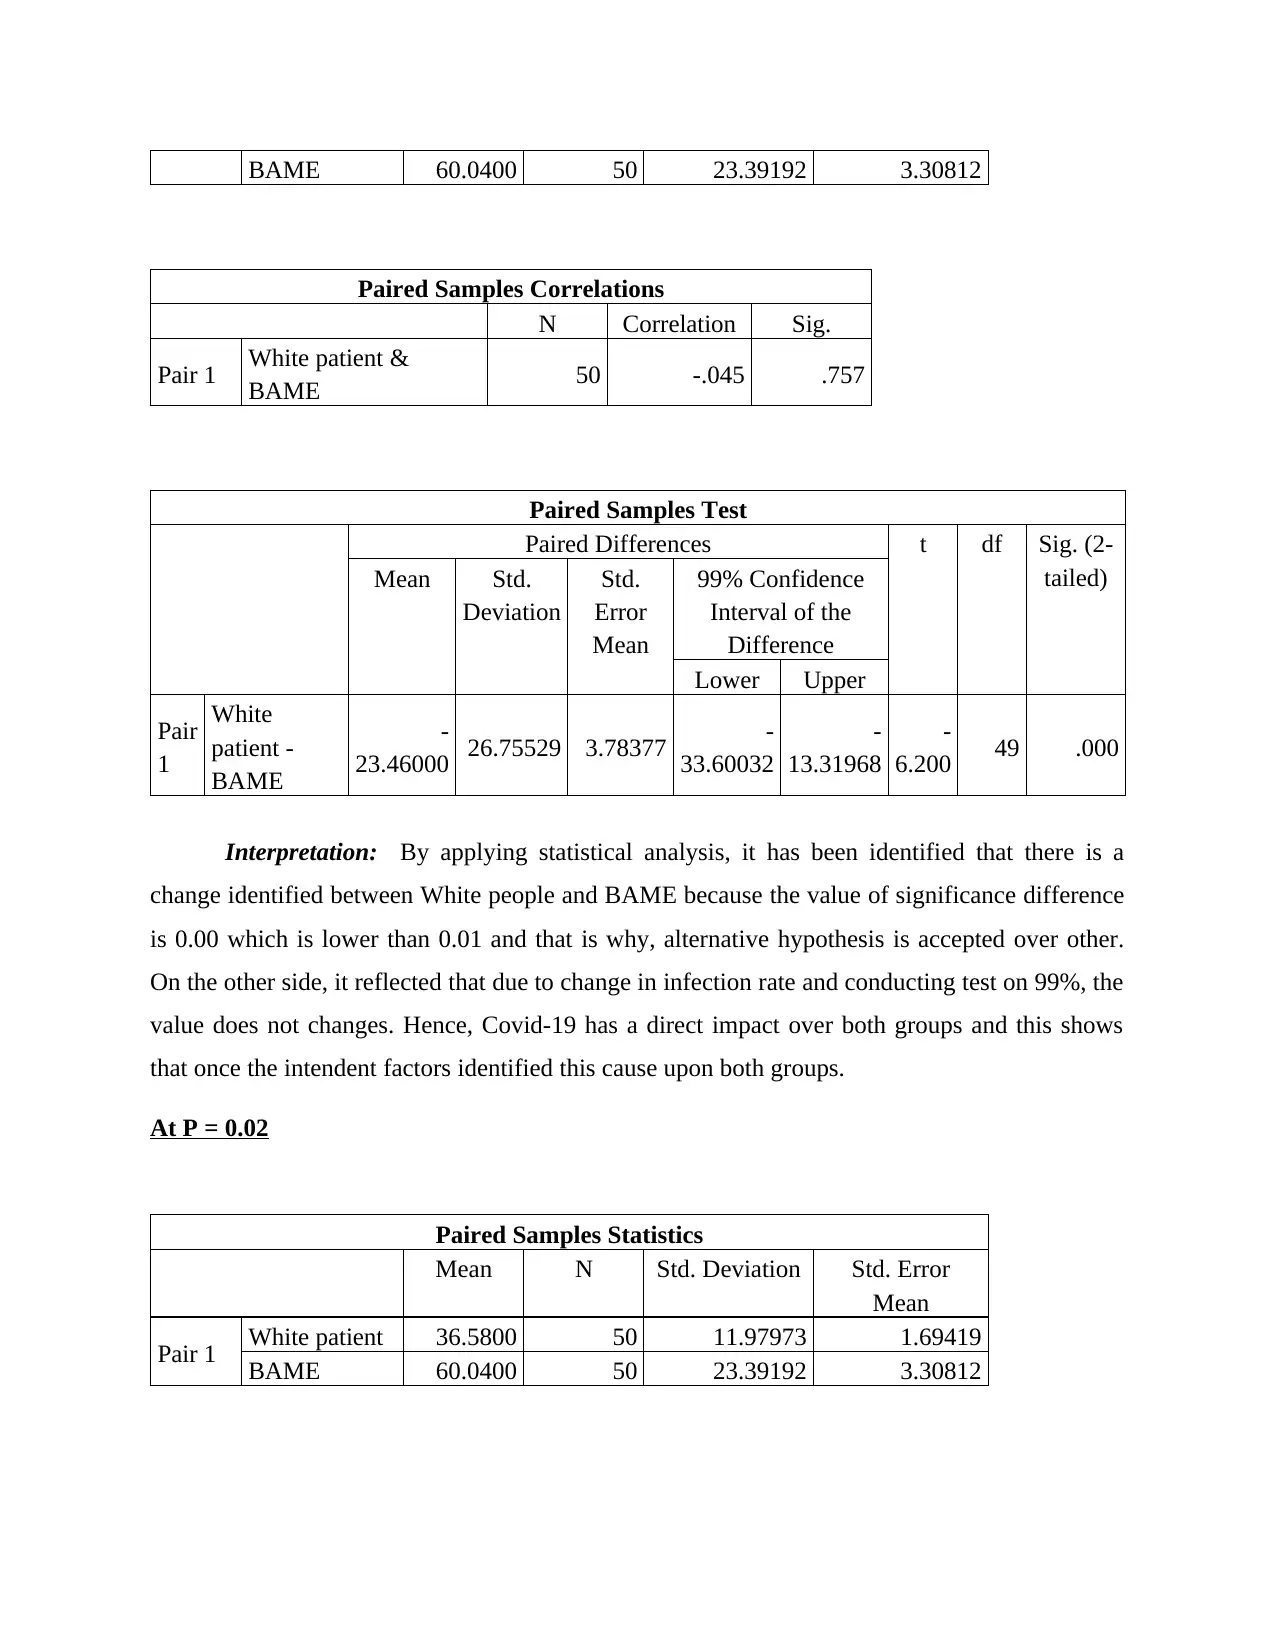
Interpretation: By applying statistical analysis, it has been identified that there is a
change identified between White people and BAME because the value of significance difference
is 0.00 which is lower than 0.01 and that is why, alternative hypothesis is accepted over other.
On the other side, it reflected that due to change in infection rate and conducting test on 99%, the
value does not changes. Hence, Covid-19 has a direct impact over both groups and this shows
that once the intendent factors identified this cause upon both groups.
At P = 0.02
Paired Samples Statistics
Mean N Std. Deviation Std. Error
Mean
Pair 1 White patient 36.5800 50 11.97973 1.69419
BAME 60.0400 50 23.39192 3.30812
Paired Samples Correlations
N Correlation Sig.
Pair 1 White patient &
BAME 50 -.045 .757
Paired Samples Test
Paired Differences t df Sig. (2-
tailed)Mean Std.
Deviation
Std.
Error
Mean
99% Confidence
Interval of the
Difference
Lower Upper
Pair
1
White
patient -
BAME
-
23.46000 26.75529 3.78377 -
33.60032
-
13.31968
-
6.200 49 .000
Interpretation: By applying statistical analysis, it has been identified that there is a
change identified between White people and BAME because the value of significance difference
is 0.00 which is lower than 0.01 and that is why, alternative hypothesis is accepted over other.
On the other side, it reflected that due to change in infection rate and conducting test on 99%, the
value does not changes. Hence, Covid-19 has a direct impact over both groups and this shows
that once the intendent factors identified this cause upon both groups.
At P = 0.02
Paired Samples Statistics
Mean N Std. Deviation Std. Error
Mean
Pair 1 White patient 36.5800 50 11.97973 1.69419
BAME 60.0400 50 23.39192 3.30812
⊘ This is a preview!⊘
Do you want full access?
Subscribe today to unlock all pages.
Trusted by 1+ million students worldwide
Paired Samples Correlations
N Correlation Sig.
Pair 1 White patient &
BAME 50 -.045 .757
Paired Samples Test
Paired Differences t df Sig. (2-
tailed)Mean Std.
Deviation
Std.
Error
Mean
98% Confidence
Interval of the
Difference
Lower Upper
Pair
1
White
patient -
BAME
-
23.46000 26.75529 3.78377 -
32.55955
-
14.36045
-
6.200 49 .000
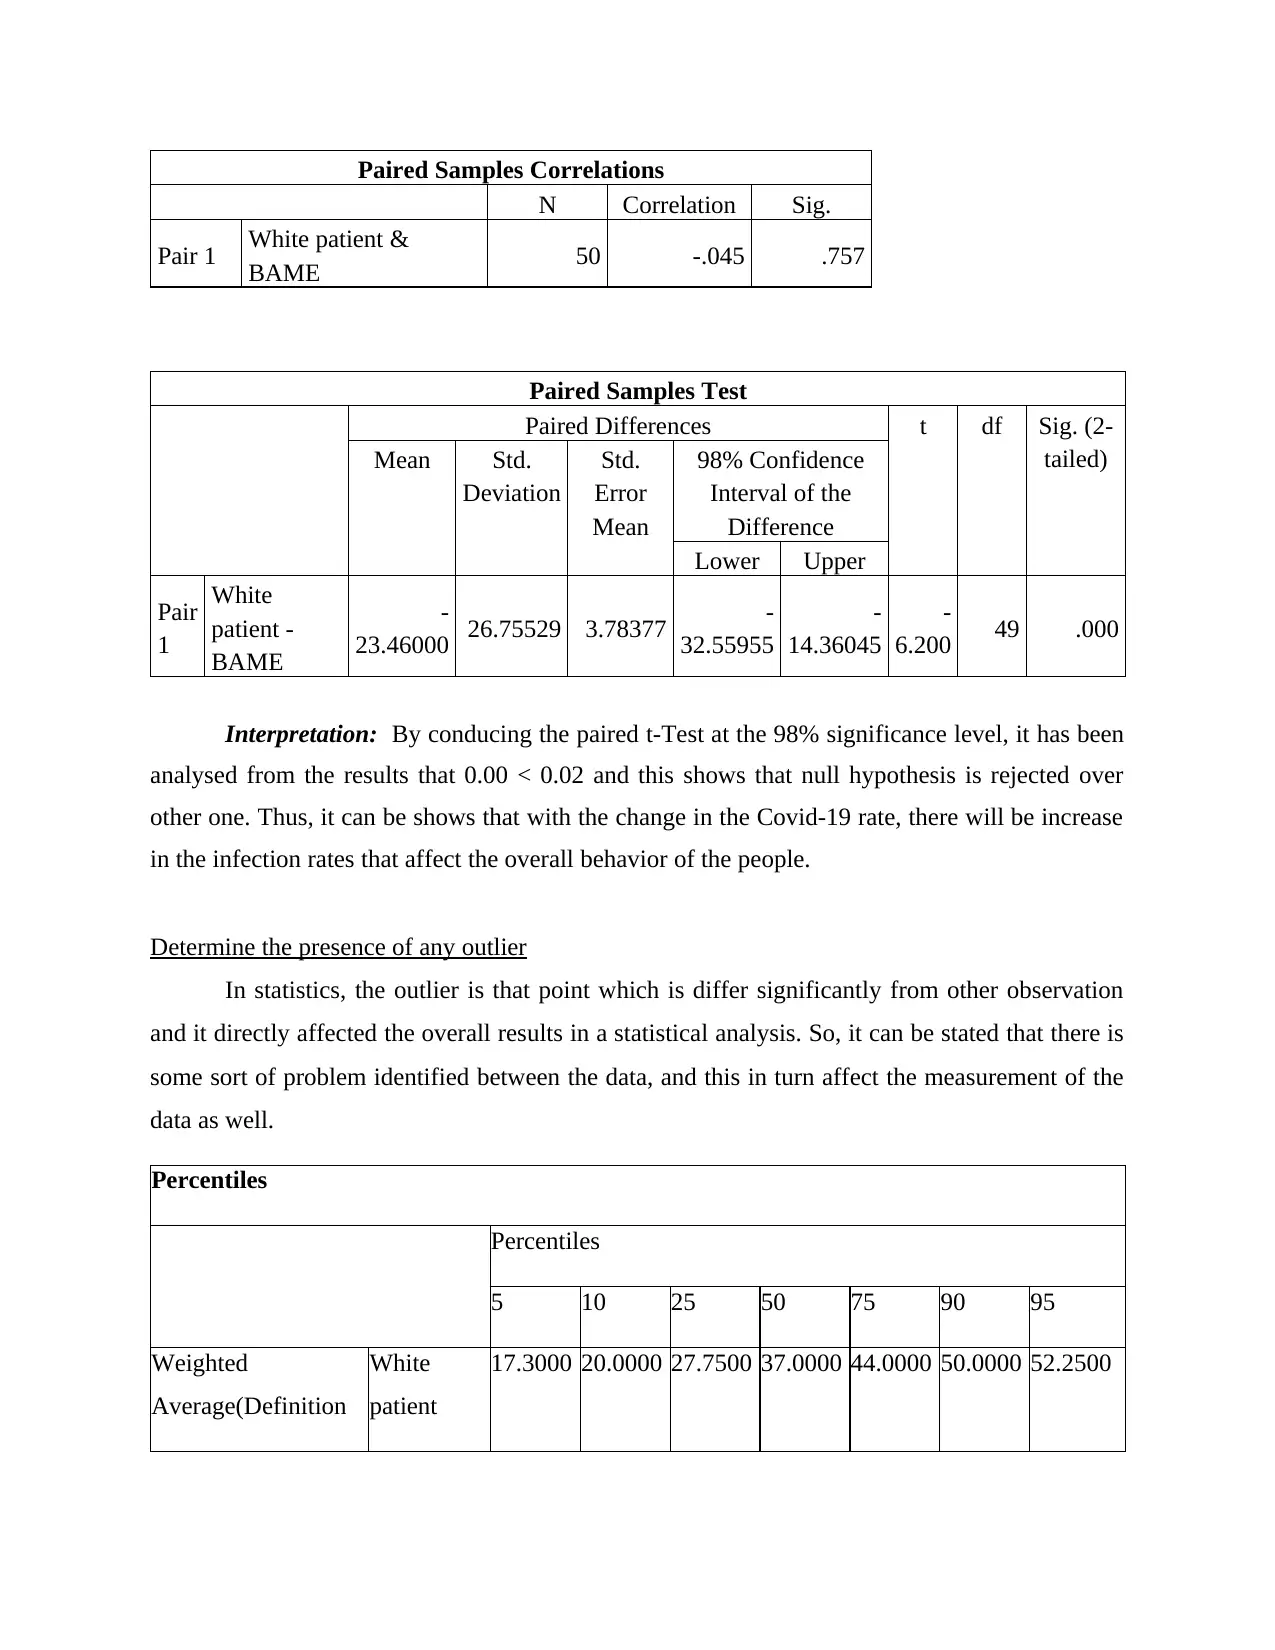
Interpretation: By conducing the paired t-Test at the 98% significance level, it has been
analysed from the results that 0.00 < 0.02 and this shows that null hypothesis is rejected over
other one. Thus, it can be shows that with the change in the Covid-19 rate, there will be increase
in the infection rates that affect the overall behavior of the people.
Determine the presence of any outlier
In statistics, the outlier is that point which is differ significantly from other observation
and it directly affected the overall results in a statistical analysis. So, it can be stated that there is
some sort of problem identified between the data, and this in turn affect the measurement of the
data as well.
Percentiles
Percentiles
5 10 25 50 75 90 95
Weighted
Average(Definition
White
patient
17.3000 20.0000 27.7500 37.0000 44.0000 50.0000 52.2500
N Correlation Sig.
Pair 1 White patient &
BAME 50 -.045 .757
Paired Samples Test
Paired Differences t df Sig. (2-
tailed)Mean Std.
Deviation
Std.
Error
Mean
98% Confidence
Interval of the
Difference
Lower Upper
Pair
1
White
patient -
BAME
-
23.46000 26.75529 3.78377 -
32.55955
-
14.36045
-
6.200 49 .000
Interpretation: By conducing the paired t-Test at the 98% significance level, it has been
analysed from the results that 0.00 < 0.02 and this shows that null hypothesis is rejected over
other one. Thus, it can be shows that with the change in the Covid-19 rate, there will be increase
in the infection rates that affect the overall behavior of the people.
Determine the presence of any outlier
In statistics, the outlier is that point which is differ significantly from other observation
and it directly affected the overall results in a statistical analysis. So, it can be stated that there is
some sort of problem identified between the data, and this in turn affect the measurement of the
data as well.
Percentiles
Percentiles
5 10 25 50 75 90 95
Weighted
Average(Definition
White
patient
17.3000 20.0000 27.7500 37.0000 44.0000 50.0000 52.2500
Paraphrase This Document
Need a fresh take? Get an instant paraphrase of this document with our AI Paraphraser
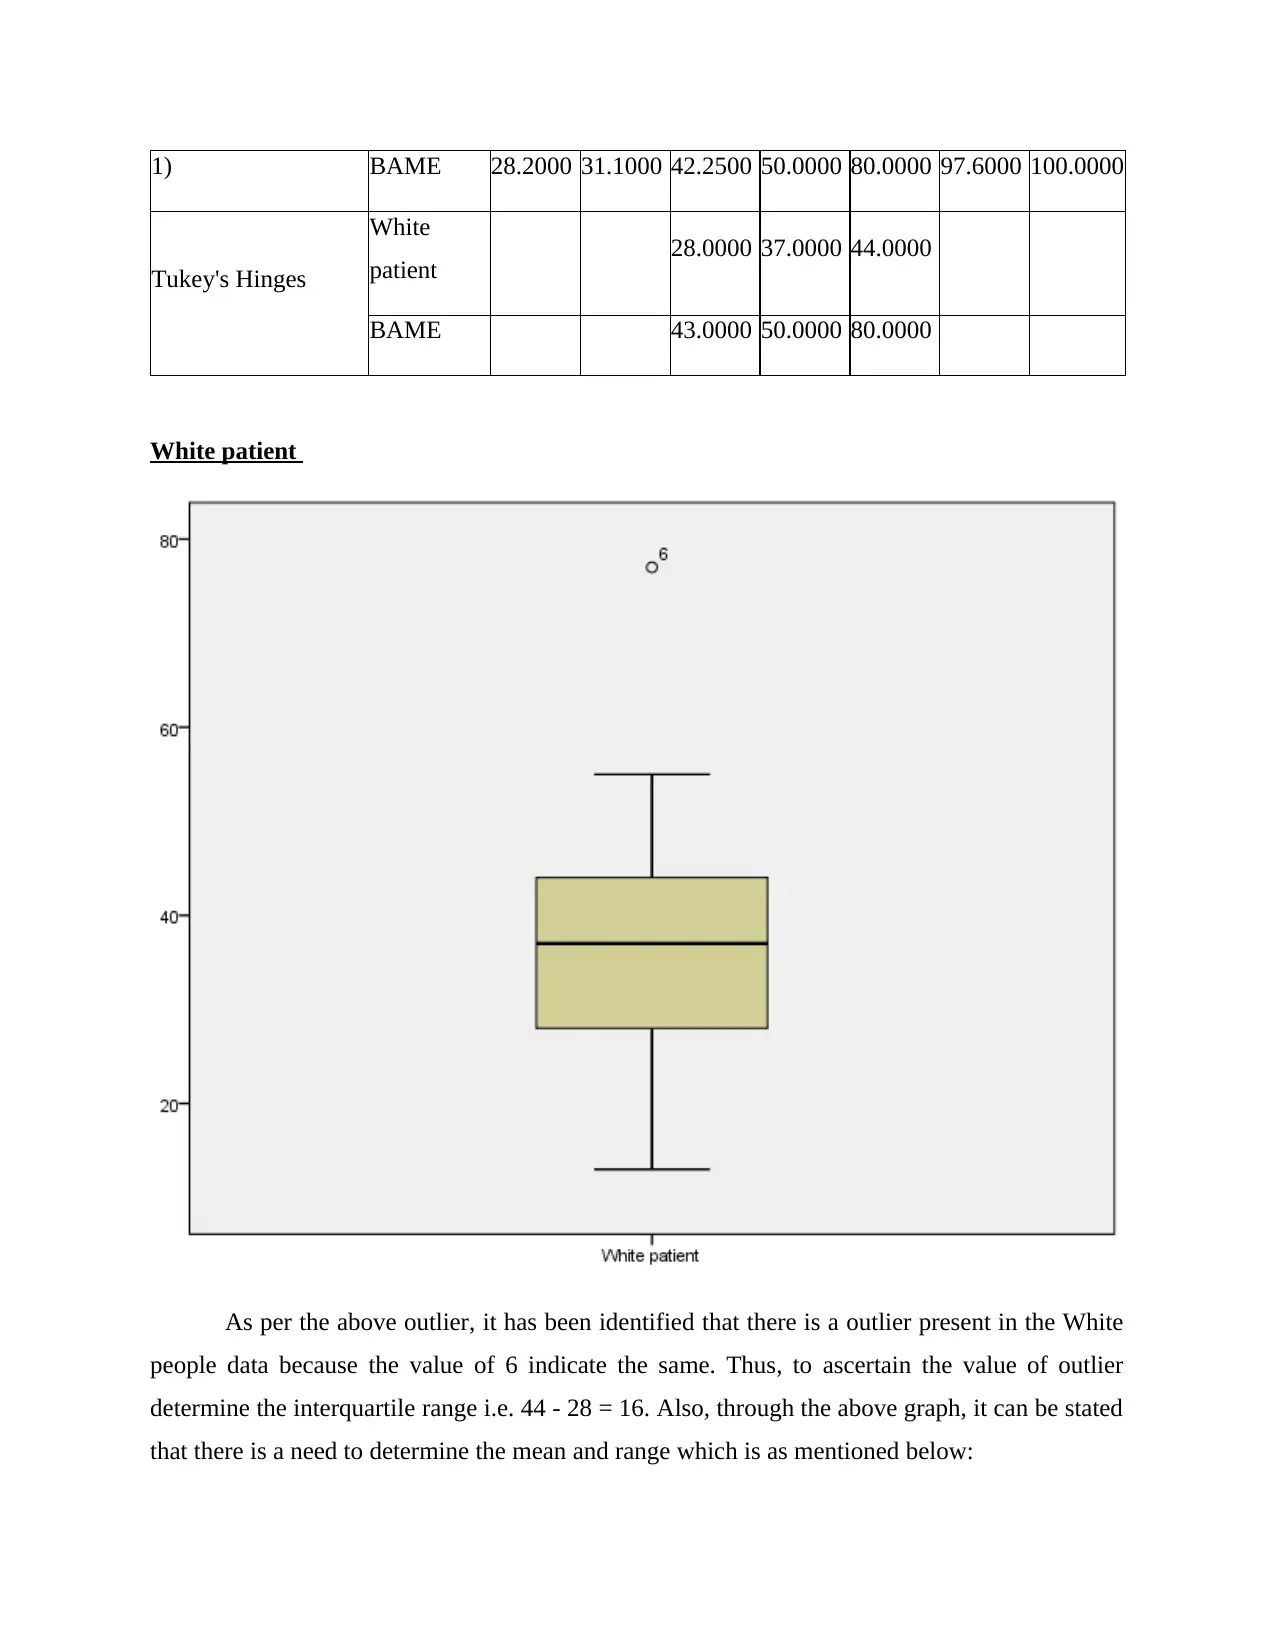
1) BAME 28.2000 31.1000 42.2500 50.0000 80.0000 97.6000 100.0000
Tukey's Hinges
White
patient 28.0000 37.0000 44.0000
BAME 43.0000 50.0000 80.0000
White patient
As per the above outlier, it has been identified that there is a outlier present in the White
people data because the value of 6 indicate the same. Thus, to ascertain the value of outlier
determine the interquartile range i.e. 44 - 28 = 16. Also, through the above graph, it can be stated
that there is a need to determine the mean and range which is as mentioned below:
44 + 3*16 = 92
28 – 3*16 = -20
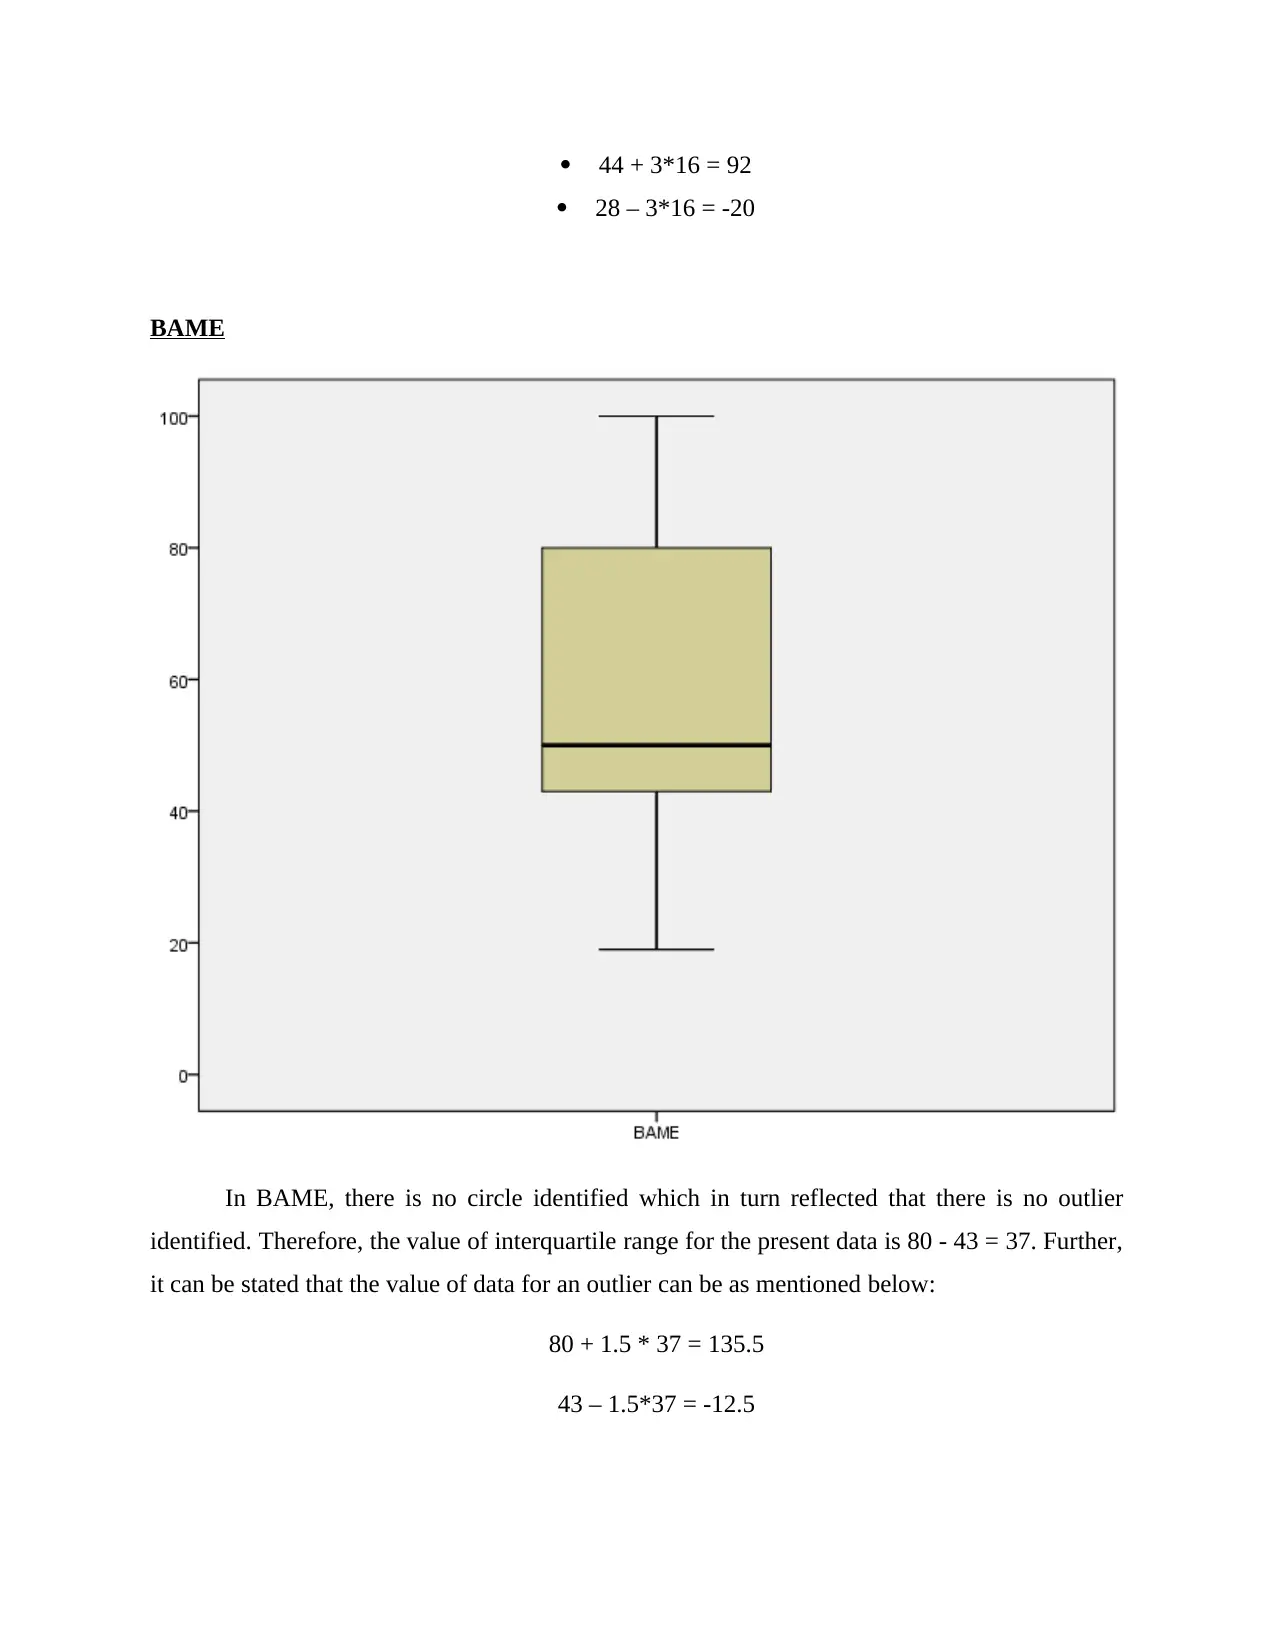
BAME
In BAME, there is no circle identified which in turn reflected that there is no outlier
identified. Therefore, the value of interquartile range for the present data is 80 - 43 = 37. Further,
it can be stated that the value of data for an outlier can be as mentioned below:
80 + 1.5 * 37 = 135.5
43 – 1.5*37 = -12.5
28 – 3*16 = -20
BAME
In BAME, there is no circle identified which in turn reflected that there is no outlier
identified. Therefore, the value of interquartile range for the present data is 80 - 43 = 37. Further,
it can be stated that the value of data for an outlier can be as mentioned below:
80 + 1.5 * 37 = 135.5
43 – 1.5*37 = -12.5
⊘ This is a preview!⊘
Do you want full access?
Subscribe today to unlock all pages.
Trusted by 1+ million students worldwide
Therefore, the above calculation clearly reflected that value for BAME cannot be
negative and that is why, 135.5 is considered as an outlier and this in turn causes positive impact
over. Also, in the case of White people, the negative value should be rejected for consider it as
an outlier. Hence, outlier can be affected due to change in the mean value of a data and this also
have a direct impact over the median and mode. That is why, outlier always affected the data
which needs to be managed because the results are not provided accordingly.
Other feature of data that can be appear
The other features which is also appear in the data set while investigation such that
different key features needs to be included such that gender which helps to identify which
category is highly affected due to pandemic. Thus, by including such type of data will be more
beneficial for the study because it clearly ascertain the value up to which the infection rate of
pandemic affect different categories of people (Kendall-Raynor, 2021). Also, study can also
determine the in-depth relationship between the variables so that further actions can be taken.
Further, a common range is specified within a data set, but individual age needs to be
mentioned within each individual along with gender. This in turn help to examine better result
and identify which hypothesis is accepted or not. Overall, it can be stated that with the help of
this data set, the results can be effectually derived and prove hypothesis as well.
Other factors that might affect the results
For the present data set, it has been analysed that controlled variables might affect the
results but it does not have been considered while set-up experiment. There are only variable
used which include White and BAME people and they both are independent variable. Thus, if
controlled variable are chosen then it affect the results in adverse manner. These results are
actually dependent upon other factor so should not be considered. Apart from this, there are
some other groups as well who actually affect the results but not has been considered for the
present study.
In order to improve such factors, it is suggested to consider all the essential factors so that
effective outcome can be generated. As the present dataset is chosen from the secondary data
sources and that is why, different factor needs to be adopted so that best outcome can be
generated.
Paraphrase This Document
Need a fresh take? Get an instant paraphrase of this document with our AI Paraphraser
CONCLUSION
From the above report, it has been concluded that t-test is used to determine the mean of
two groups and that is why, the present study also have two groups which can be determine by
applying this statistical analysis. Further, it has been concluded that all different significant
level, there is a difference between both groups because the value of mean is lower than standard
criteria and that is why, null hypothesis is rejected over other. Moreover, there is an outlier
presented in white people only and this might affect the mean and median of a study. Also,
report concluded that there are some other factors needs to be concluded that helps to determine
the overall performance and might varied the results as well.
REFERENCES
Books and Journals
Breakwell, G. M., Fino, E. and Jaspal, R., 2021. COVID-19 preventive behaviours in White
British and Black, Asian and Minorty Ethnic (BAME) people in the UK. Journal of
Health Psychology, p.13591053211017208.
Galaj, E. and Xi, Z. X., 2021. Progress in opioid reward research: From a canonical two-neuron
hypothesis to two neural circuits. Pharmacology Biochemistry and Behavior, 200,
p.173072.
Kendall-Raynor, P., 2021. Lockdown saw fewer BAME people attending EDs: Overall
attendance fell, but figures lower in minority ethnic groups. Emergency Nurse, pp.6-6.
Liu, Q. and Wang, L., 2021. t-Test and ANOVA for data with ceiling and/or floor
effects. Behavior Research Methods. 53(1). pp.264-277.
Scanlan, A. T. and et.al., 2021. Power-related determinants of Modified Agility T-test
Performance in male adolescent basketball players. The Journal of Strength &
Conditioning Research. 35(8). pp.2248-2254.
⊘ This is a preview!⊘
Do you want full access?
Subscribe today to unlock all pages.
Trusted by 1+ million students worldwide
1 out of 12
Related Documents


Your All-in-One AI-Powered Toolkit for Academic Success.
+13062052269
info@desklib.com
Available 24*7 on WhatsApp / Email
![[object Object]](/_next/static/media/star-bottom.7253800d.svg)
Unlock your academic potential
Copyright © 2020–2026 A2Z Services. All Rights Reserved. Developed and managed by ZUCOL.