Deakin University MAE256: Analytical Method Assignment Analysis
VerifiedAdded on 2023/06/07
|10
|1432
|91
Homework Assignment
AI Summary
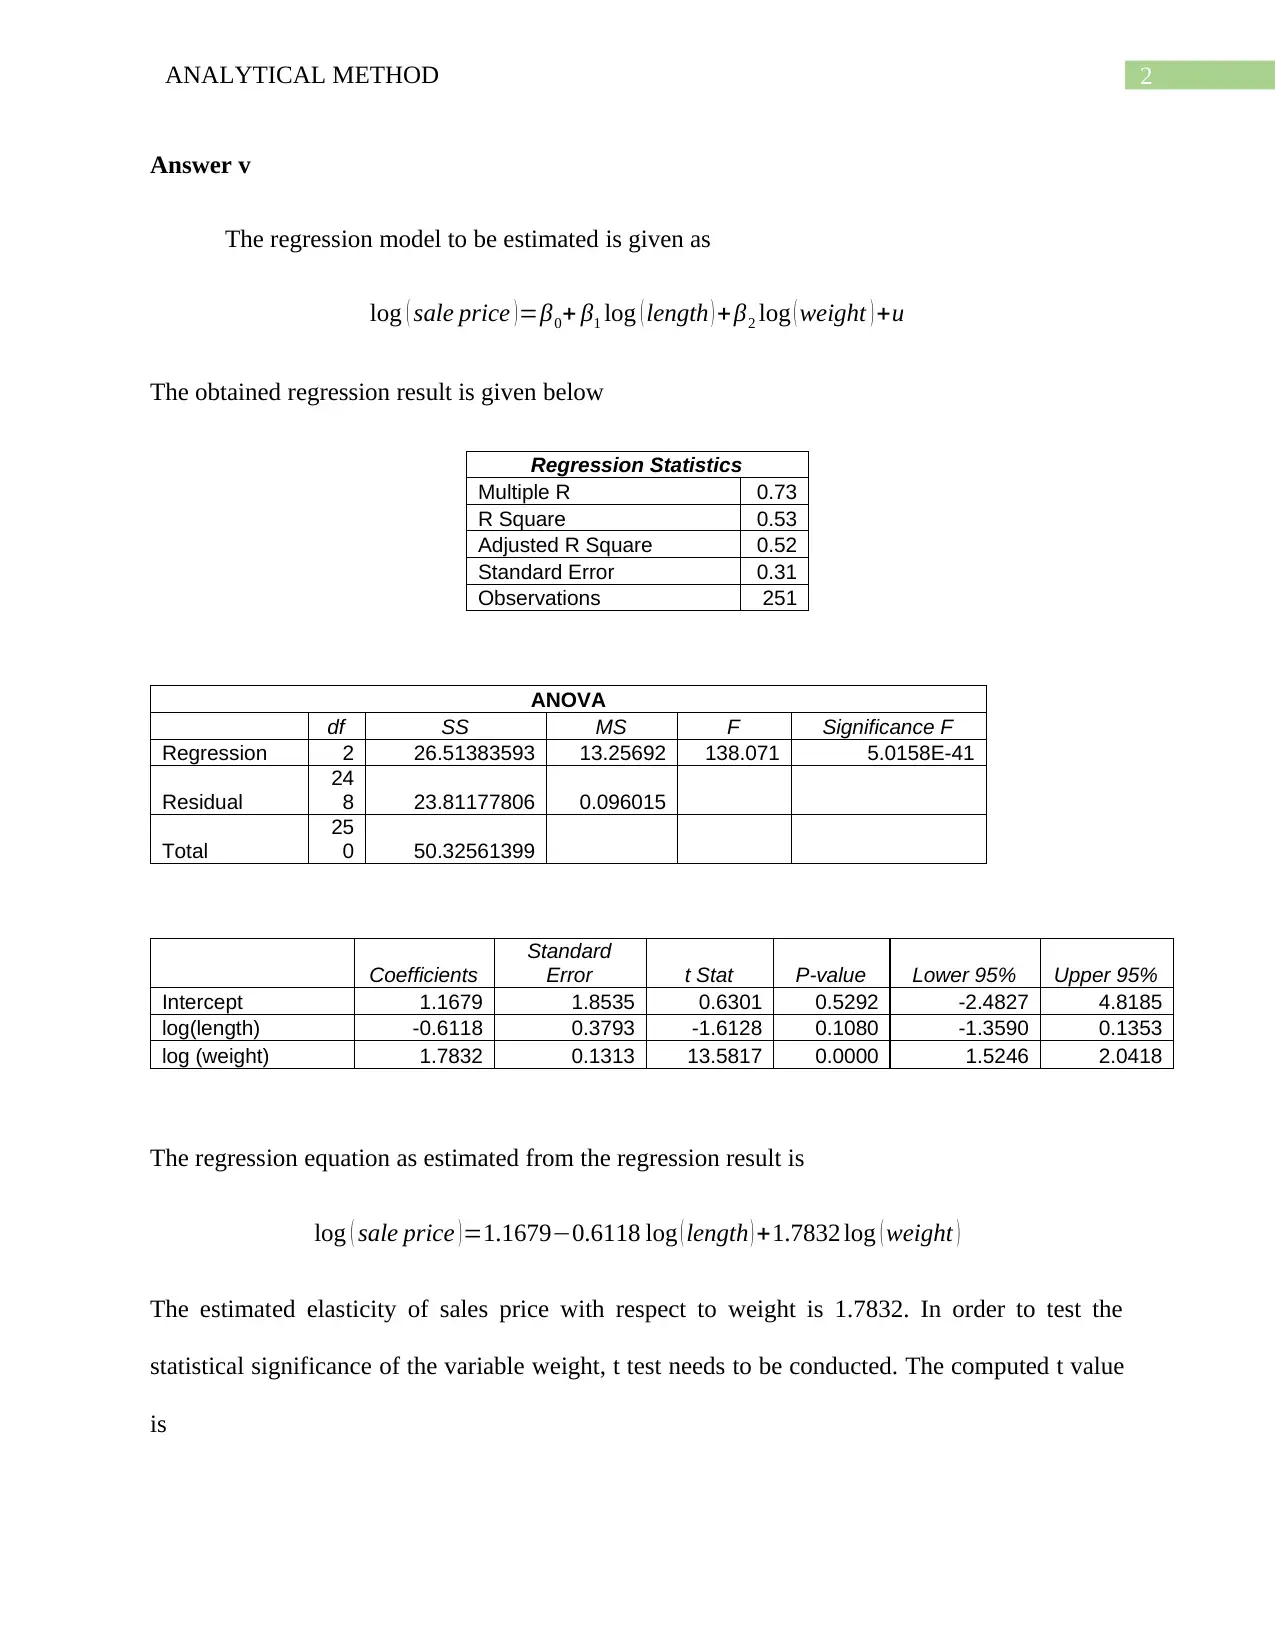
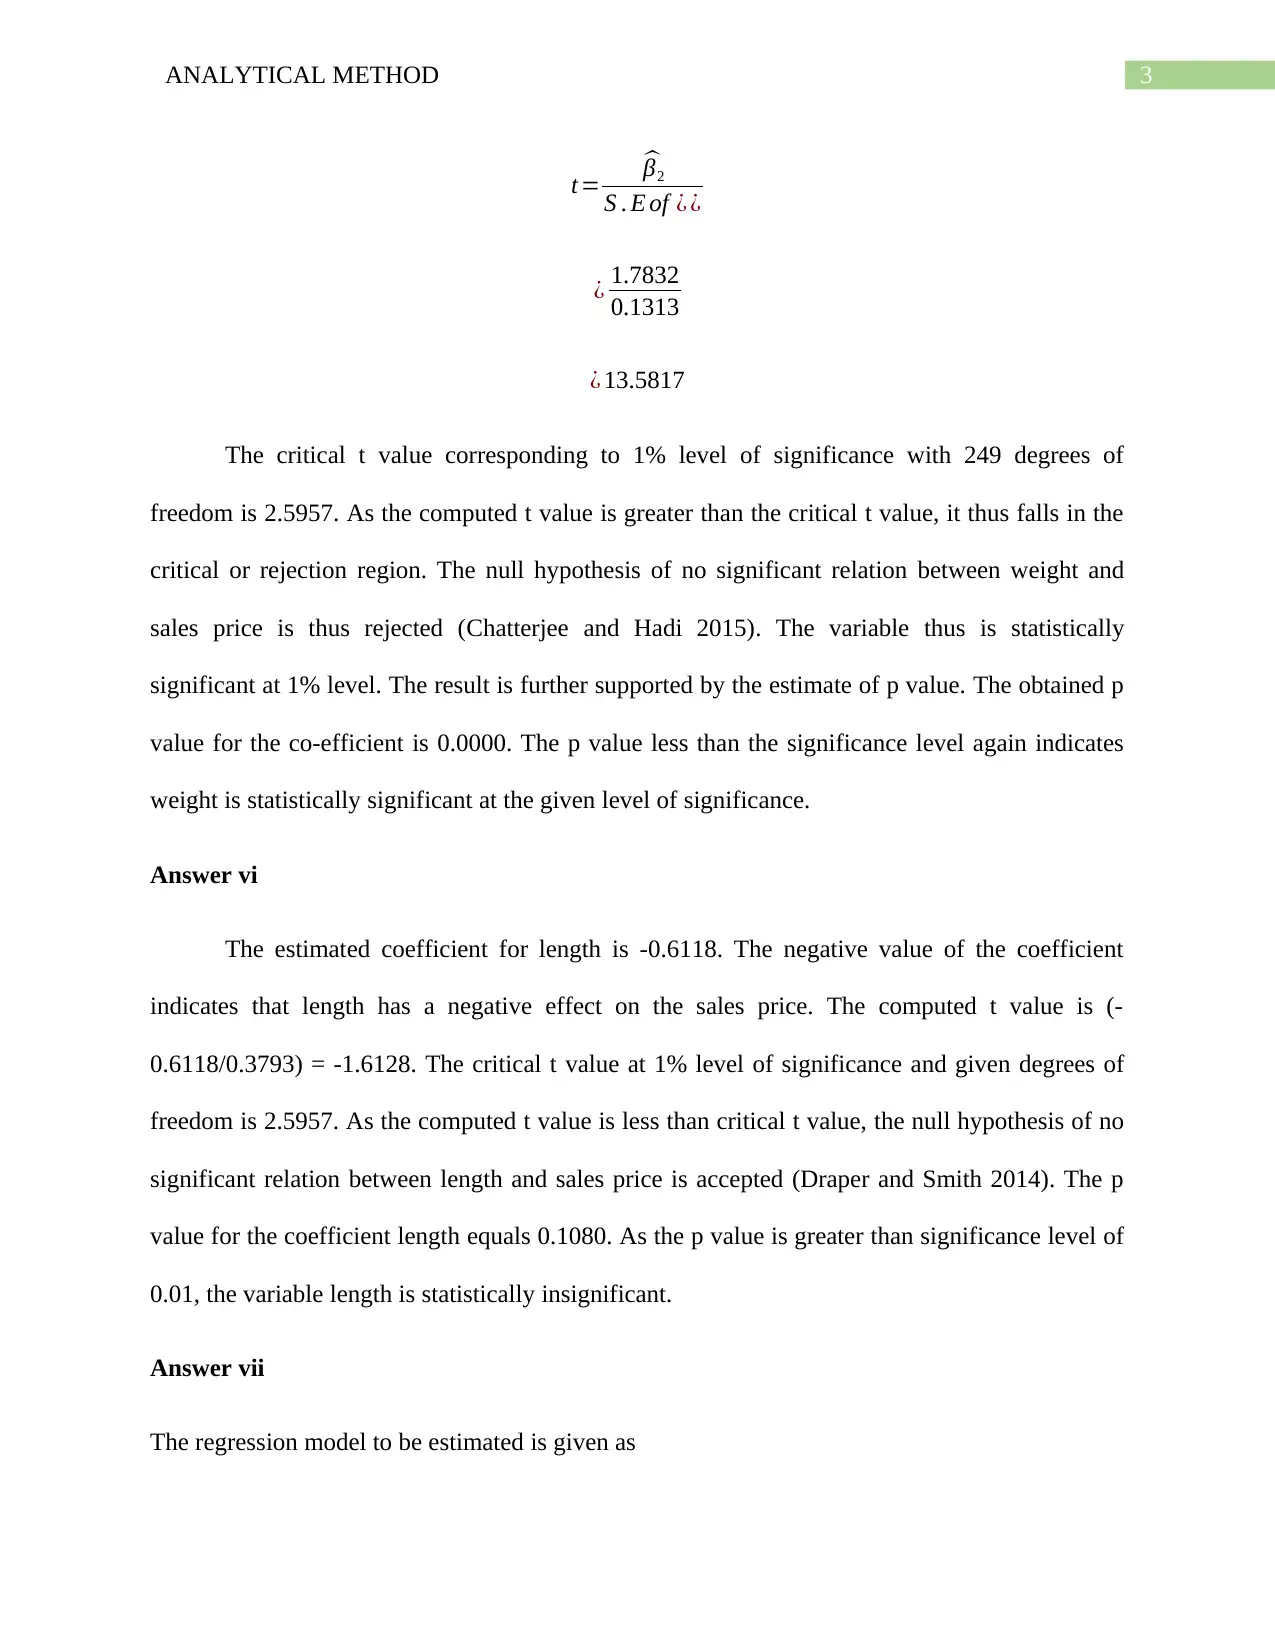
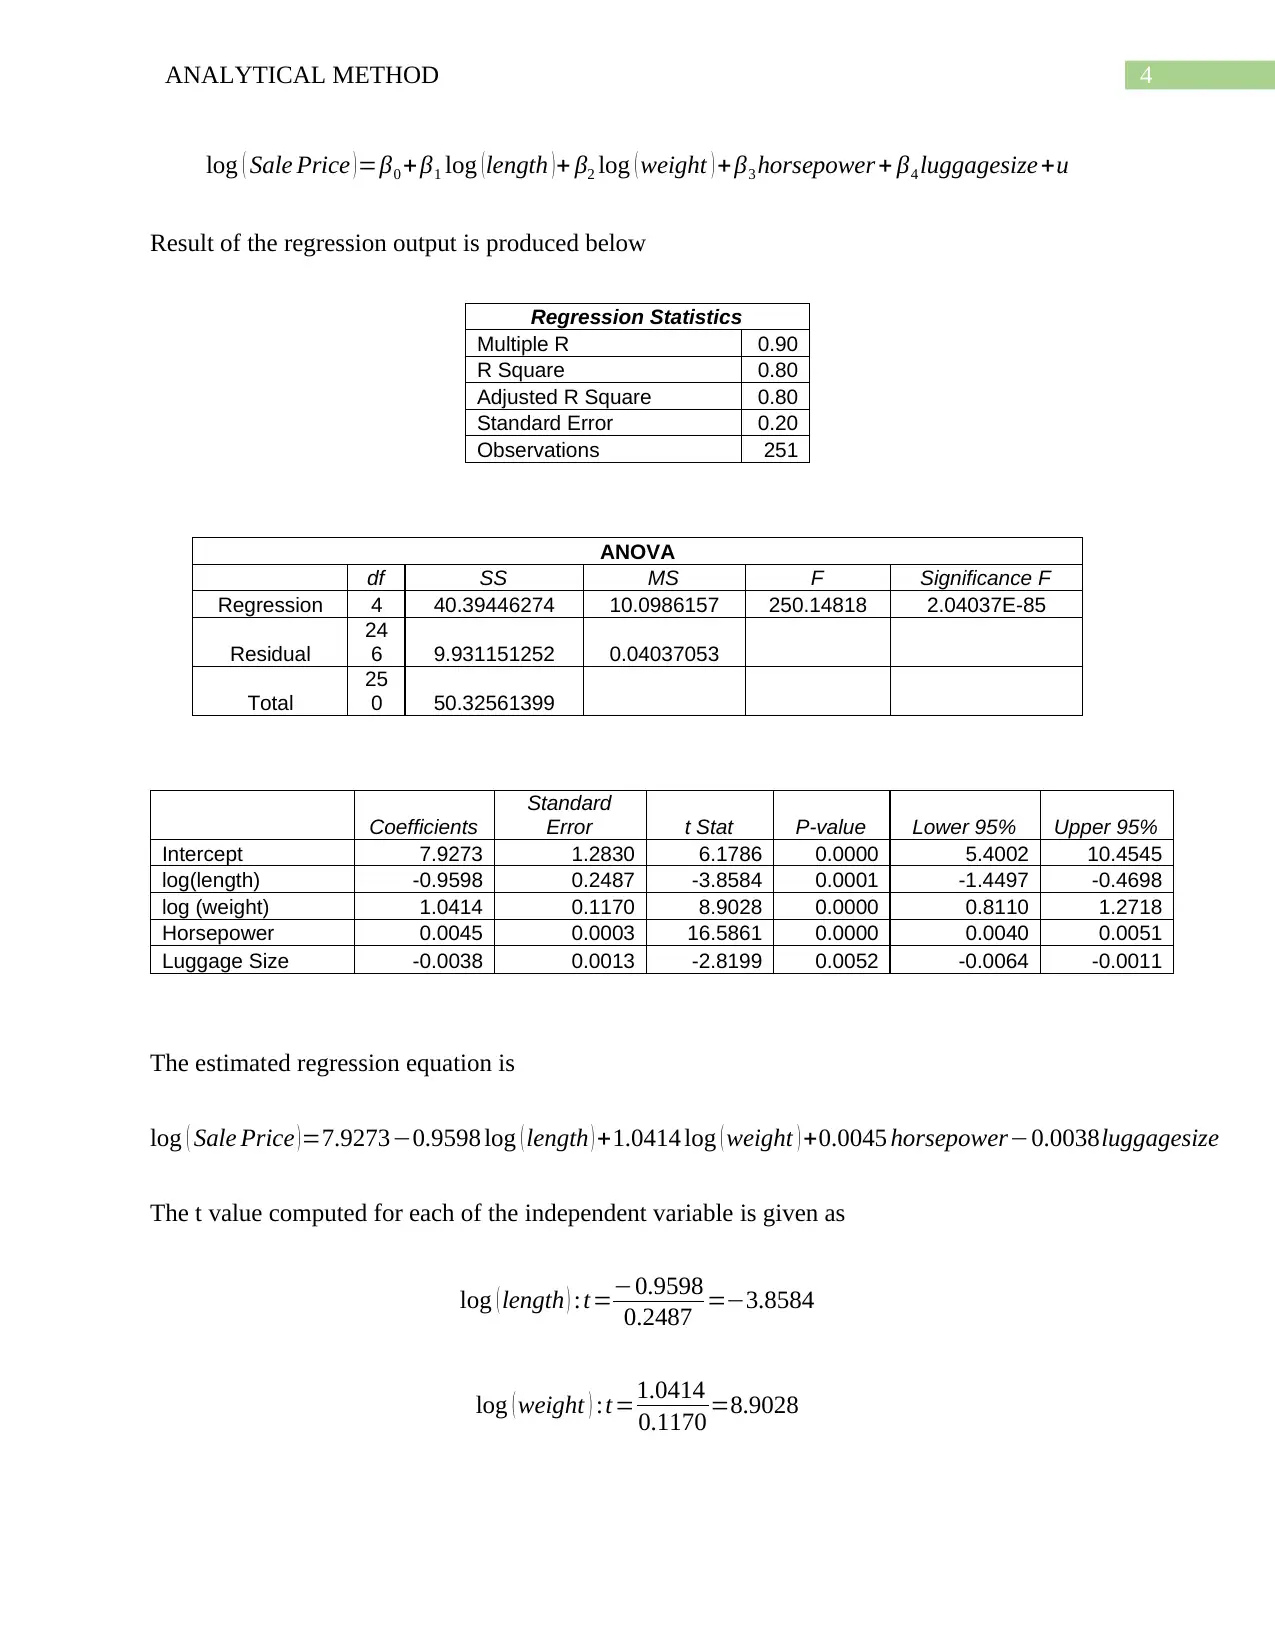
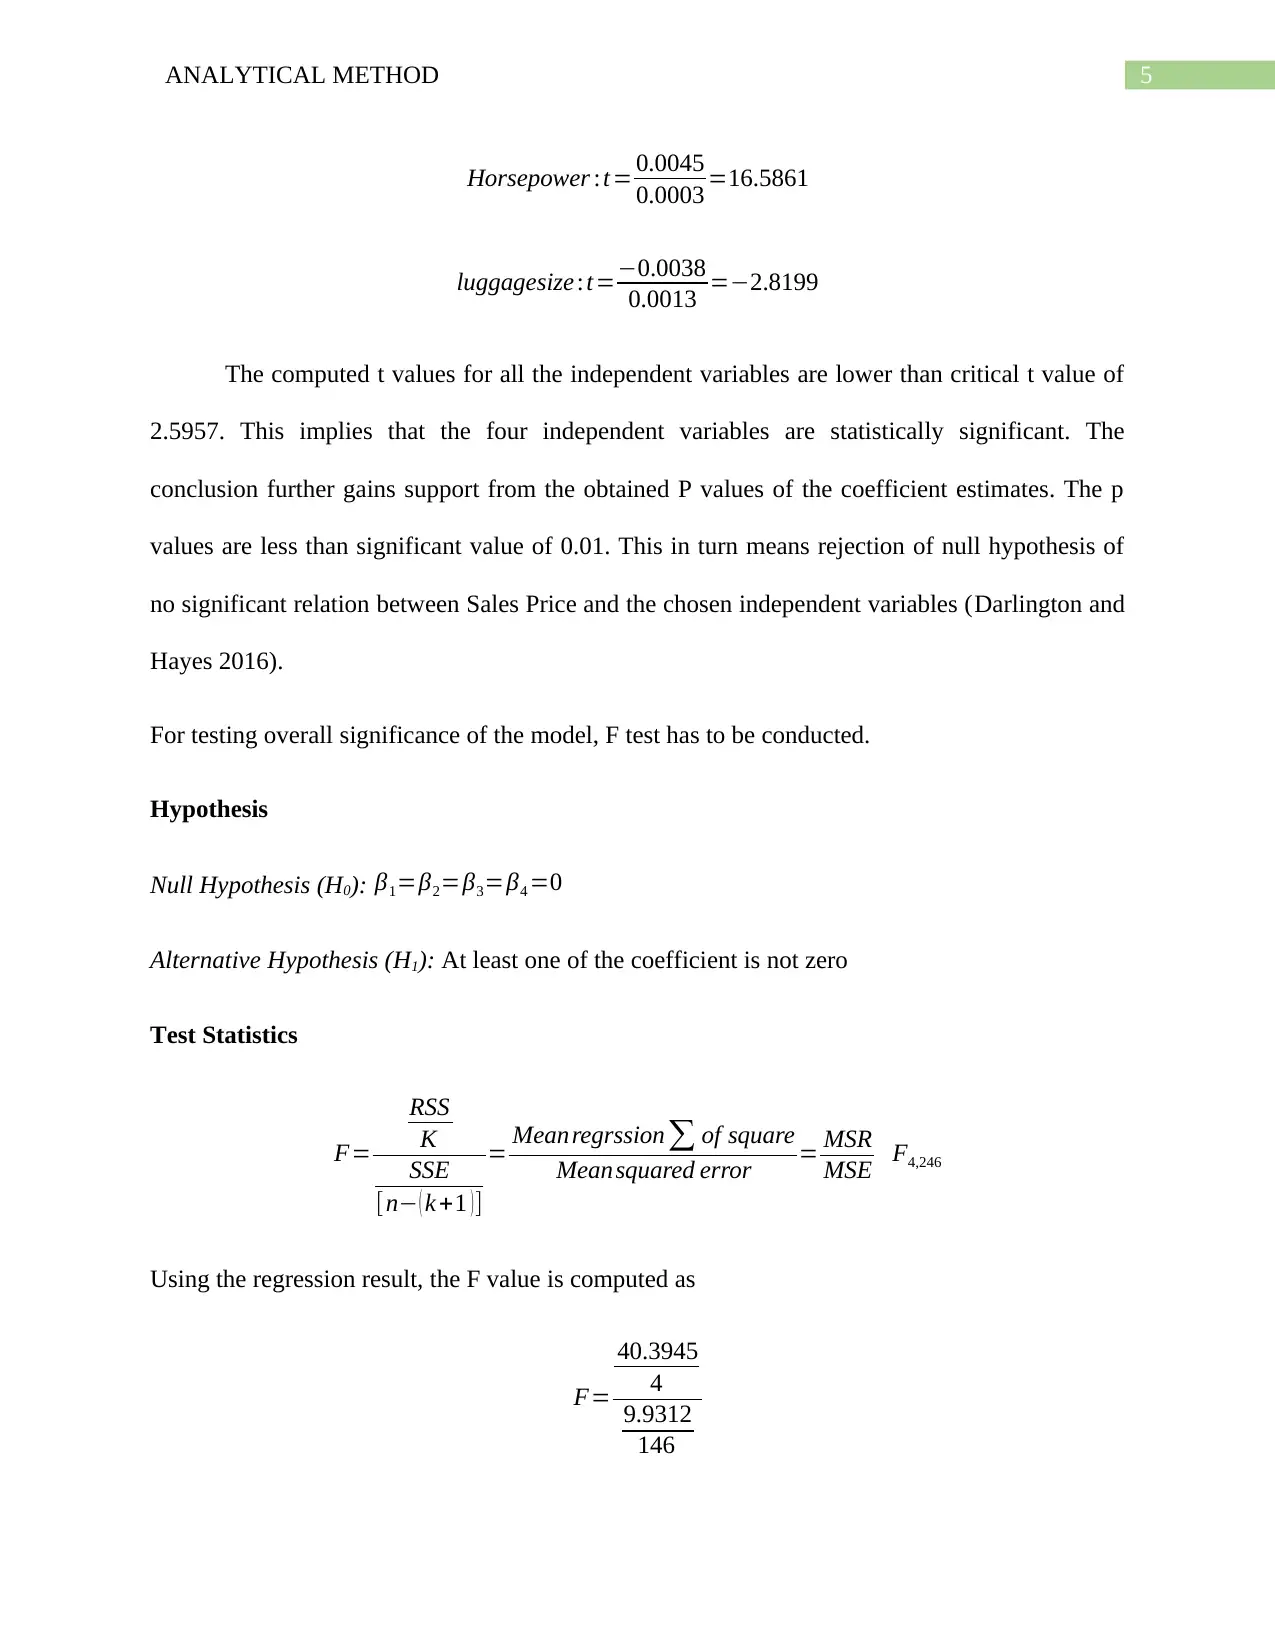
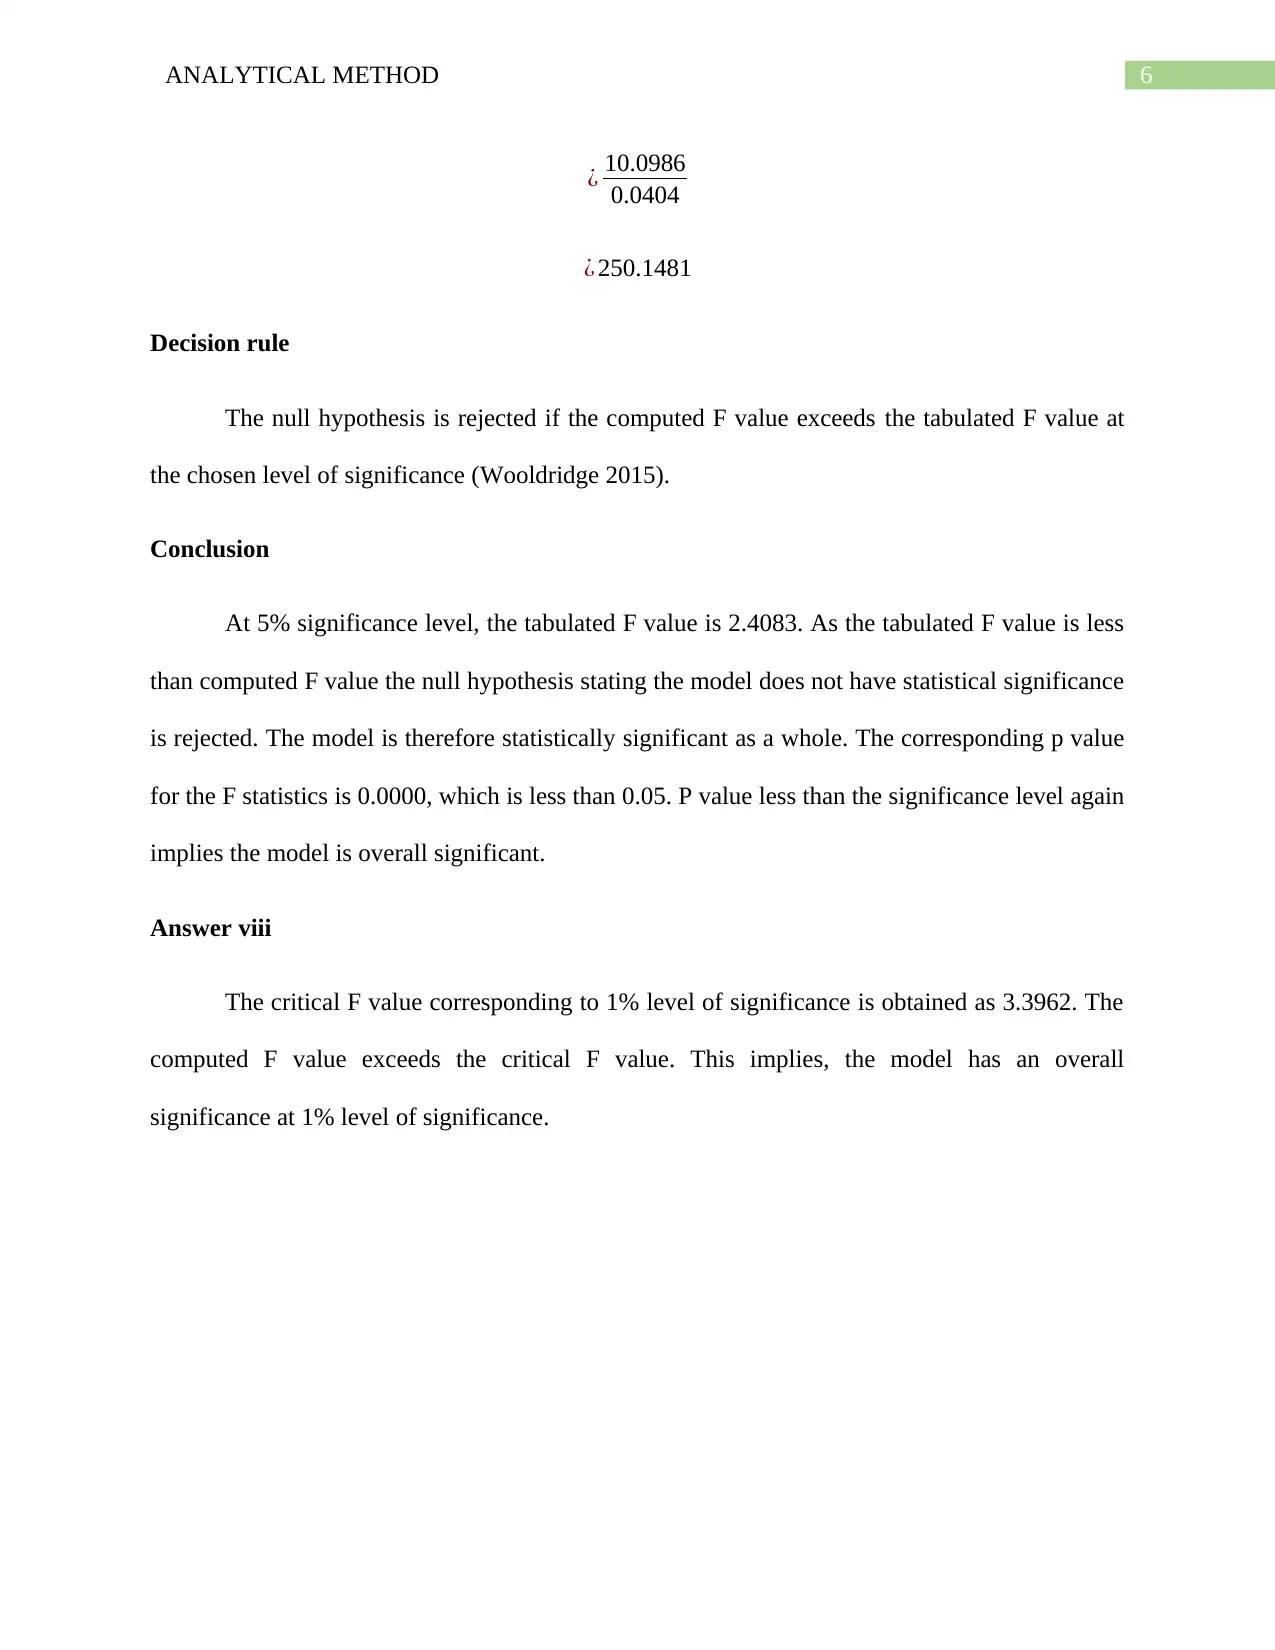
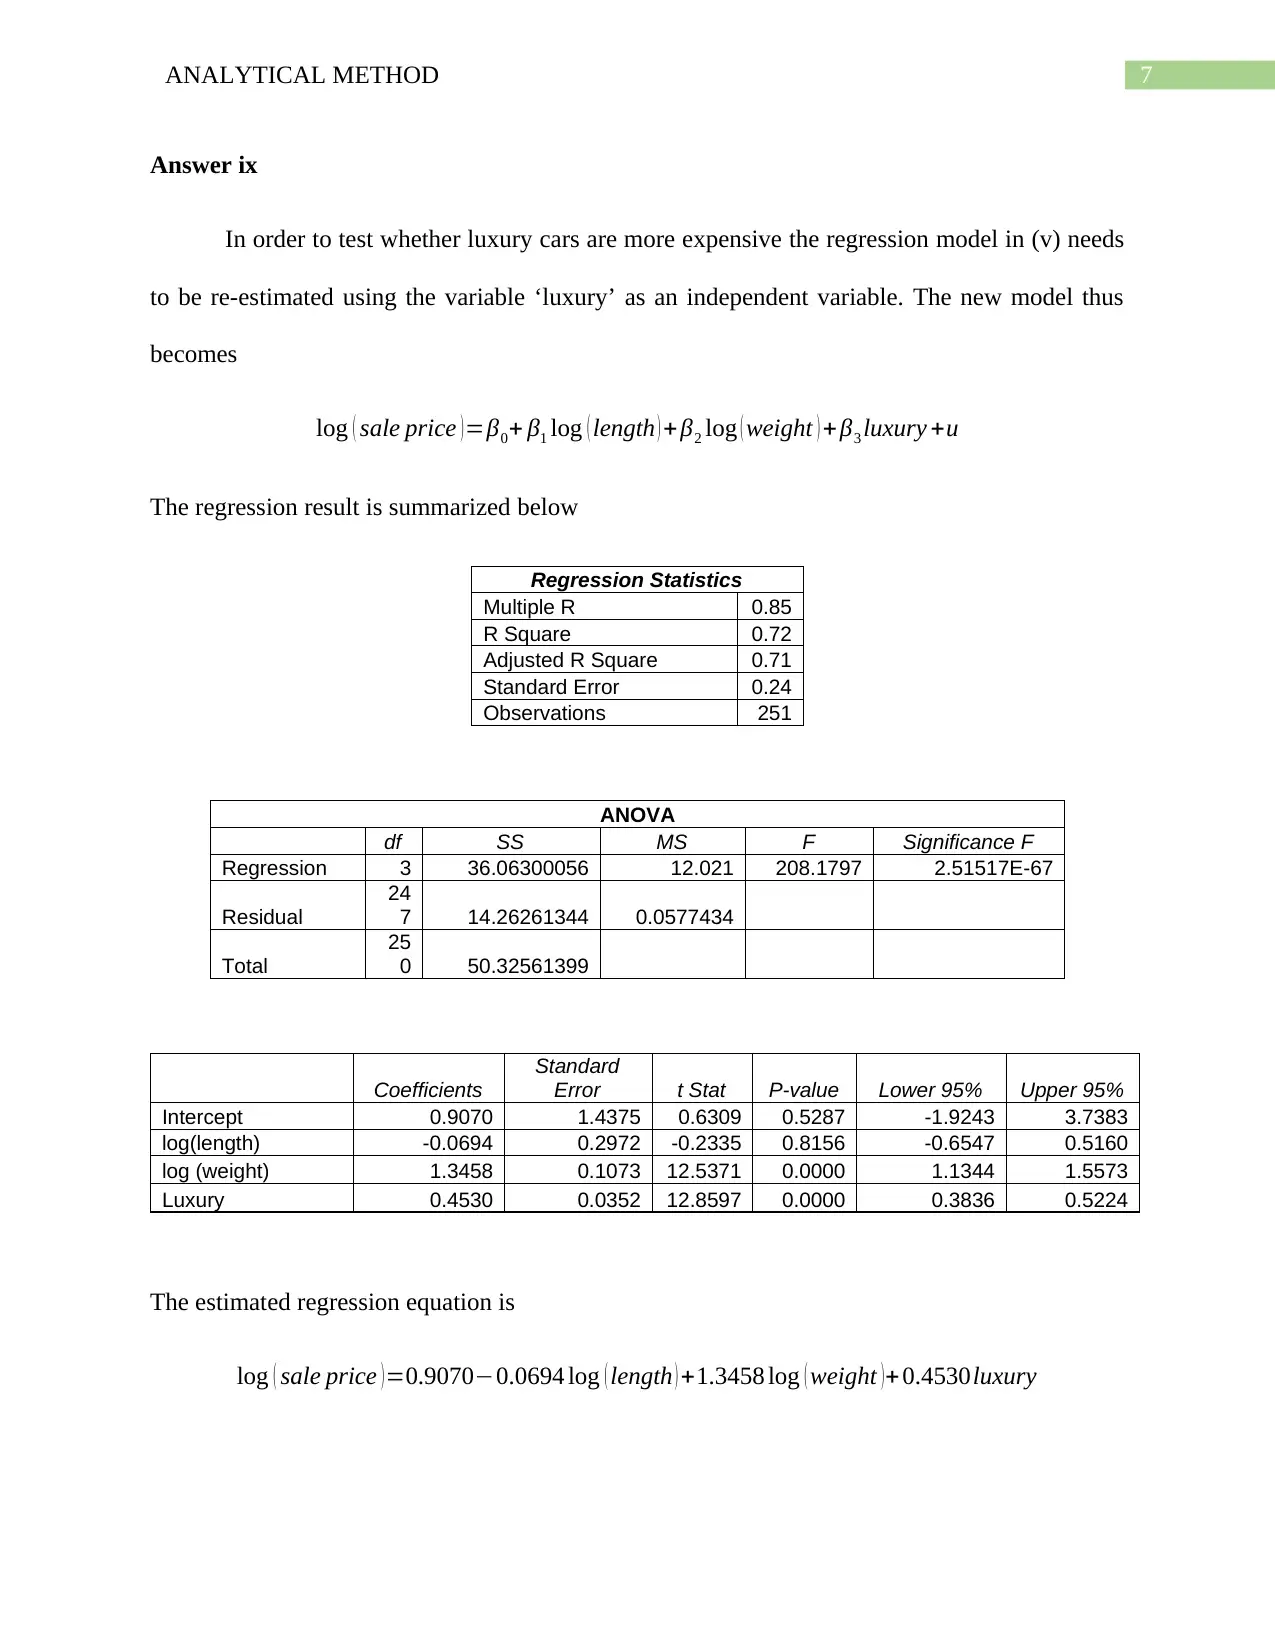
This assignment solution presents a comprehensive analysis of car sales data using regression models. The analysis begins with an examination of the relationship between sales price and car length and weight, estimating the elasticity of sales price with respect to weight and testing its statistical significance. The solution then explores a multiple regression model incorporating horsepower and luggage size, assessing the statistical significance of each variable and the overall model. Furthermore, the assignment investigates the impact of luxury features on sales price, employing regression analysis to determine if luxury cars command higher prices. The solution utilizes statistical tests, including t-tests and F-tests, to validate the findings, providing a detailed interpretation of the regression results and their implications.
1 out of 10
Related Documents


Your All-in-One AI-Powered Toolkit for Academic Success.
+13062052269
info@desklib.com
Available 24*7 on WhatsApp / Email
![[object Object]](/_next/static/media/star-bottom.7253800d.svg)
Copyright © 2020–2026 A2Z Services. All Rights Reserved. Developed and managed by ZUCOL.