Analysis of Analytics and Decision Support in Health Organizations
VerifiedAdded on 2022/09/17
|7
|860
|23
Report
AI Summary
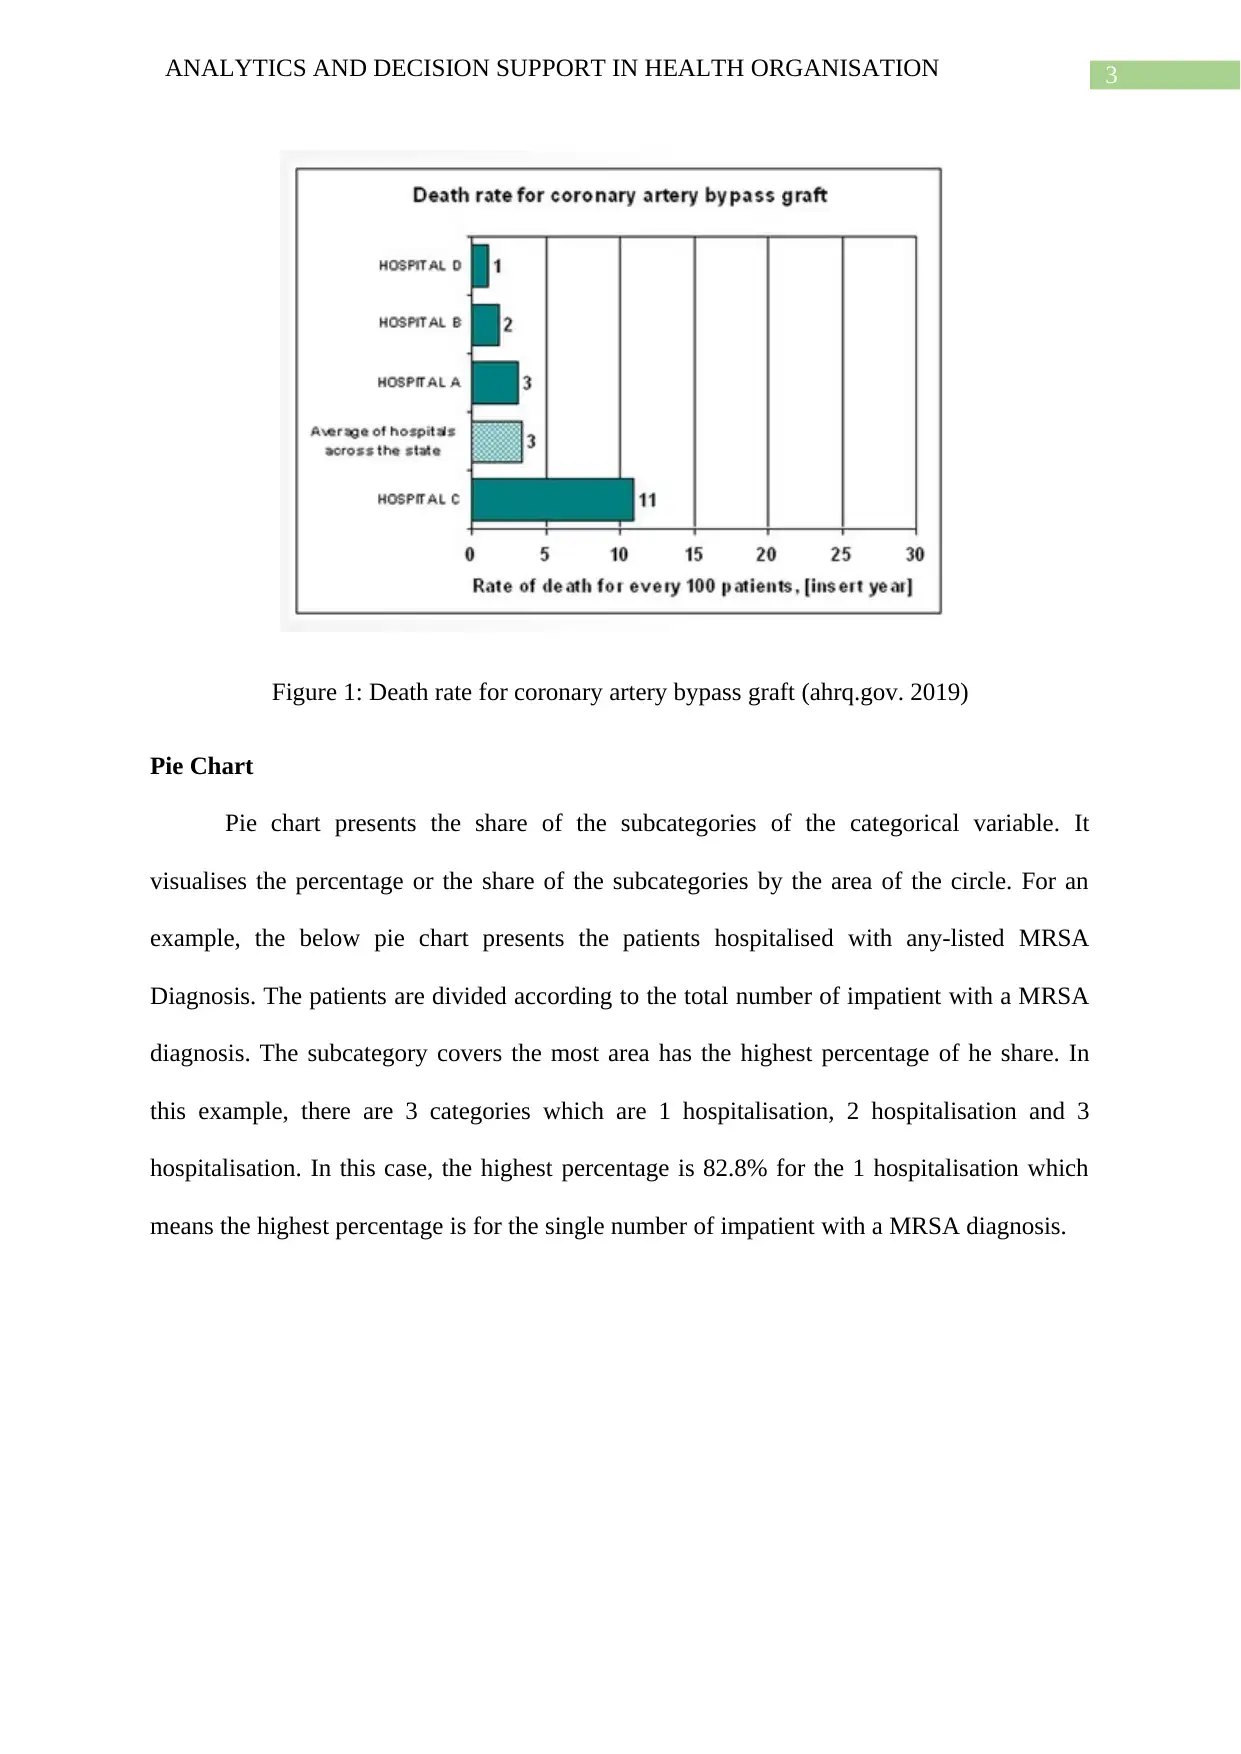
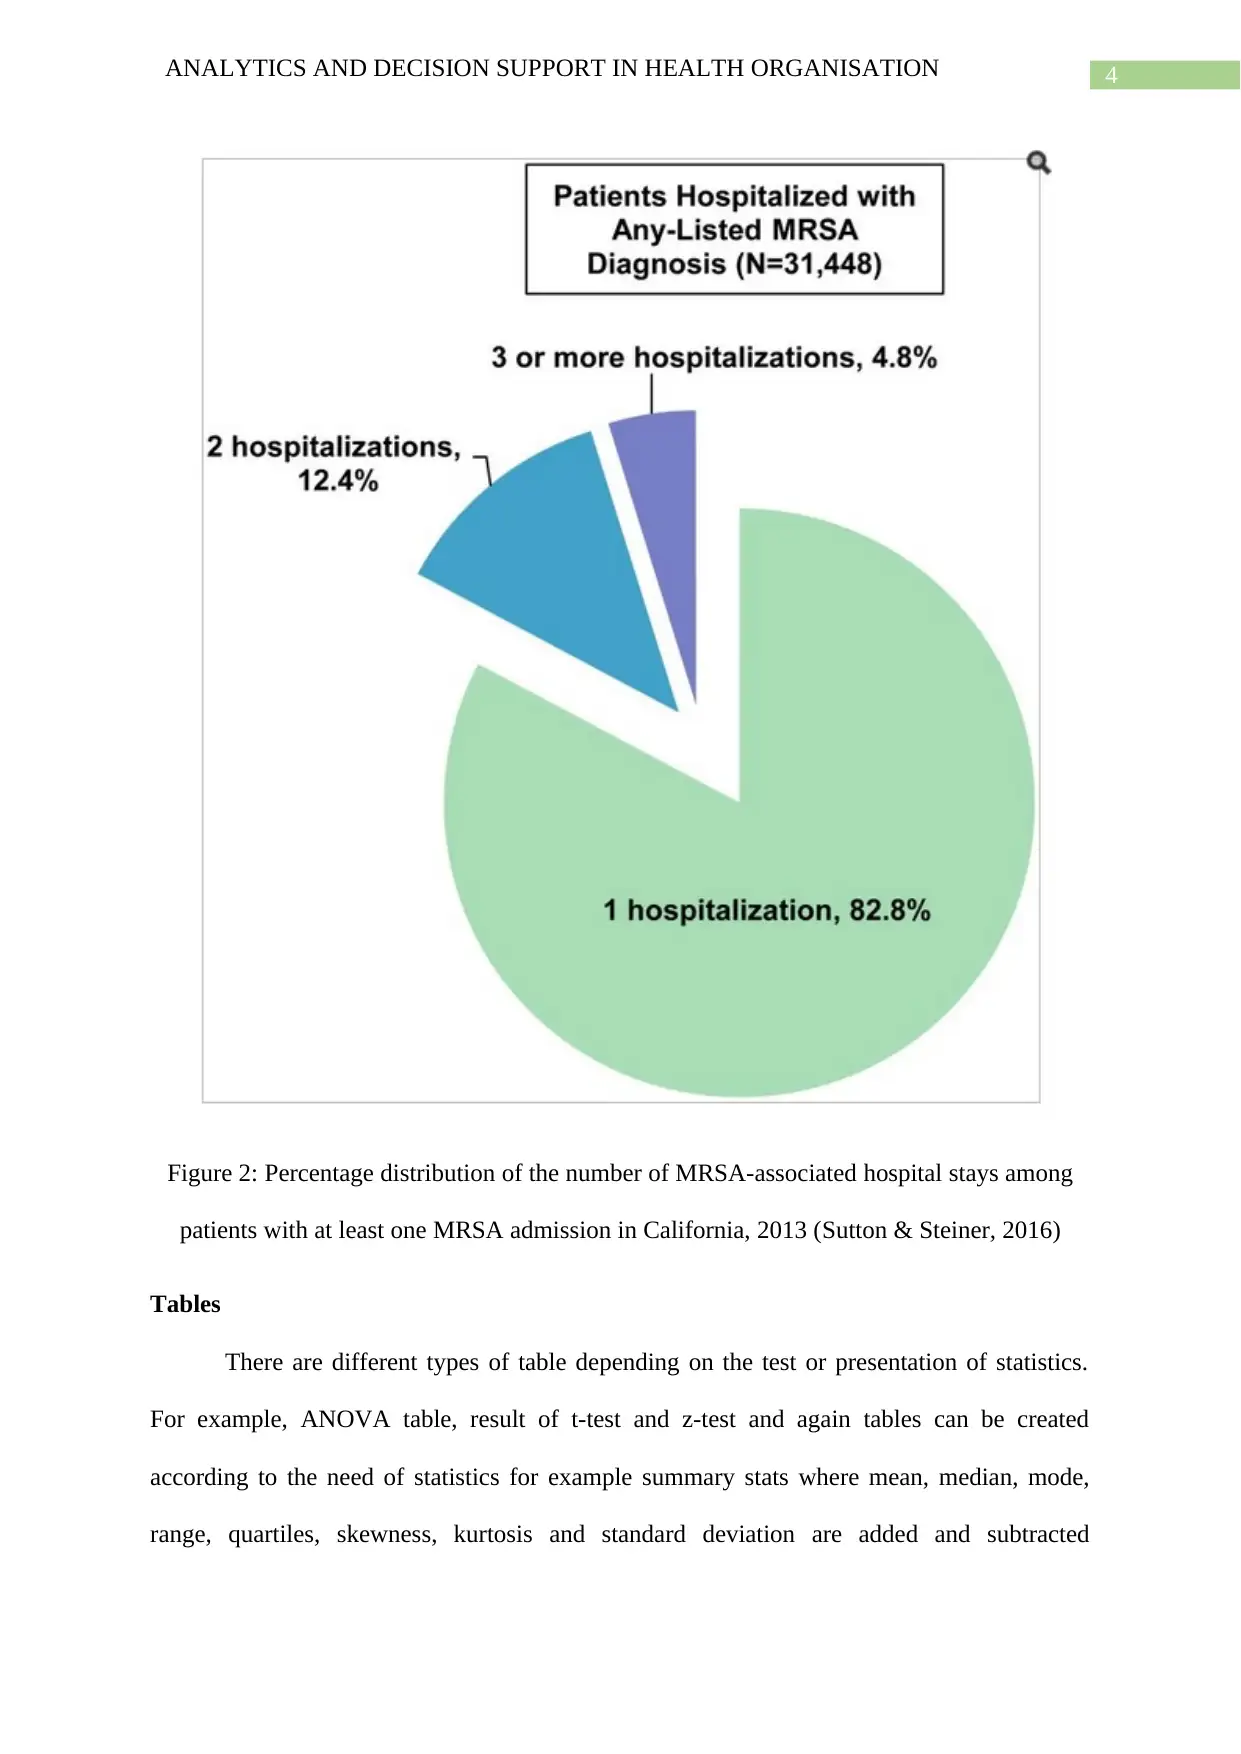
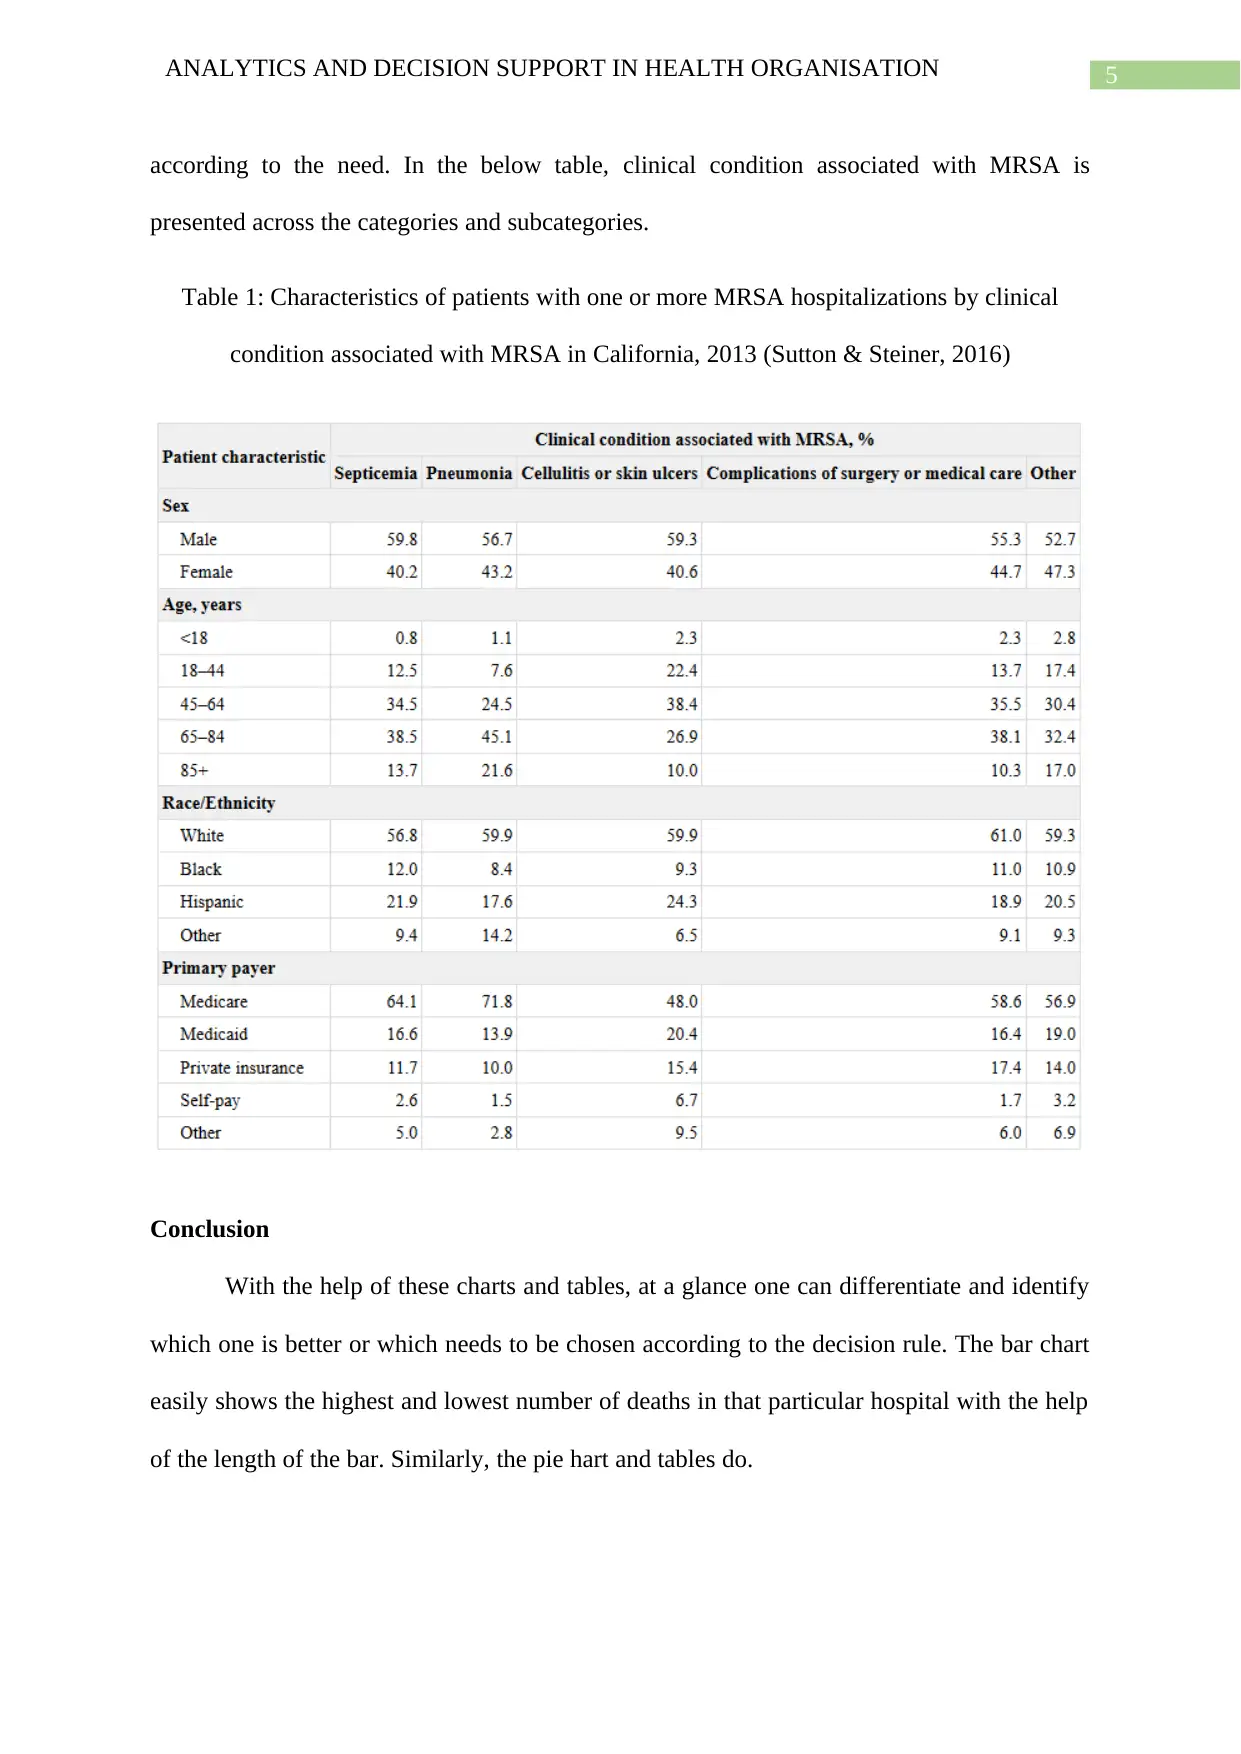
This report focuses on the application of analytics and decision support systems within healthcare organizations. It emphasizes the scientific process of uncovering significant patterns from data to improve patient care. The report highlights the importance of analytics in assisting clinicians by enabling them to analyze patient data for diagnosis and treatment improvements. It also discusses the use of various data visualization tools such as bar charts, pie charts, and tables. The report provides examples of how these tools are used to present and interpret healthcare data, such as comparing death rates in hospitals using bar charts, illustrating the distribution of patient demographics using pie charts, and presenting clinical conditions associated with MRSA using tables. The conclusion stresses the effectiveness of these visual aids in quickly differentiating and choosing the best course of action based on the decision-making rules.
1 out of 7