Business Information System Analysis of TAPIS Training Company Report
VerifiedAdded on 2020/02/05
|24
|4869
|58
Report
AI Summary
This report analyzes the business information system of TAPIS, a professional training company, based on data collected from 55 respondents. The analysis examines the popularity of different courses offered, with human resources and management courses identified as the most preferred, while sales and marketing courses showed the highest bookings. The report also assesses the need for professional trainers, revealing a strong demand for experienced instructors. Findings indicate a need for more trainers and improvements in certain courses, especially engineering, to boost bookings. Recommendations include recruiting more professional trainers, improving course infrastructure, and focusing on marketing strategies to increase student enrollment and overall profitability, with detailed action plans provided for implementation. The report concludes by emphasizing the importance of adapting course offerings based on market demand and student preferences.

BUSINESS INFORMATION SYSTEM
1
1
Paraphrase This Document
Need a fresh take? Get an instant paraphrase of this document with our AI Paraphraser
Table of contents
Introduction......................................................................................................................................5
Data analysis and findings:..............................................................................................................5
Conclusion and recommendations.................................................................................................21
2
List of figures
Figure 1: Courses Offered by TAPIS..............................................................................................6
Figure 2: Courses mostly booked....................................................................................................8
Figure 3: Courses booked less.........................................................................................................9
Figure 4: Requirement of professional trainers.............................................................................11
Figure 5: Courses having sufficient trainers..................................................................................12
Figure 6: Successful trainers..........................................................................................................13
Figure 7: Capability of trainers to guide the students....................................................................15
Figure 8: Categories of courses best for the company...................................................................16
Figure 9: Effect of less trainer on company business....................................................................18
Figure 10: Need of more trainers...................................................................................................19
Figure 11: Recommendations for better future performance by TAPIS.......................................20
3
⊘ This is a preview!⊘
Do you want full access?
Subscribe today to unlock all pages.
Trusted by 1+ million students worldwide
List of tables
Table 1: Courses Offered by TAPIS................................................................................................6
Table 2: Courses mostly booked......................................................................................................9
Table 3: Courses booked less........................................................................................................10
Table 4: Requirement of professional trainers...............................................................................12
Table 5: Courses having sufficient trainers...................................................................................13
Table 6: Successful trainers...........................................................................................................14
Table 7: Capability of trainers to guide the students.....................................................................16
Table 8: Categories of courses best for the company....................................................................17
Table 9: Effect of less trainer on company business.....................................................................18
Table 10: Need of more trainers....................................................................................................20
Table 11: Recommendations for better future performance by TAPIS.........................................21
Table 12: Table for Recommendation 1........................................................................................23
Table 13: Action plan for Recommendation 1..............................................................................23
Table 14: Table for Recommendation 2........................................................................................24
Table 15: Action plan for Recommendation 3..............................................................................24
Table 16: Table for Recommendation 3........................................................................................25
Table 17: Action plan for Recommendation 3..............................................................................25
4
Paraphrase This Document
Need a fresh take? Get an instant paraphrase of this document with our AI Paraphraser
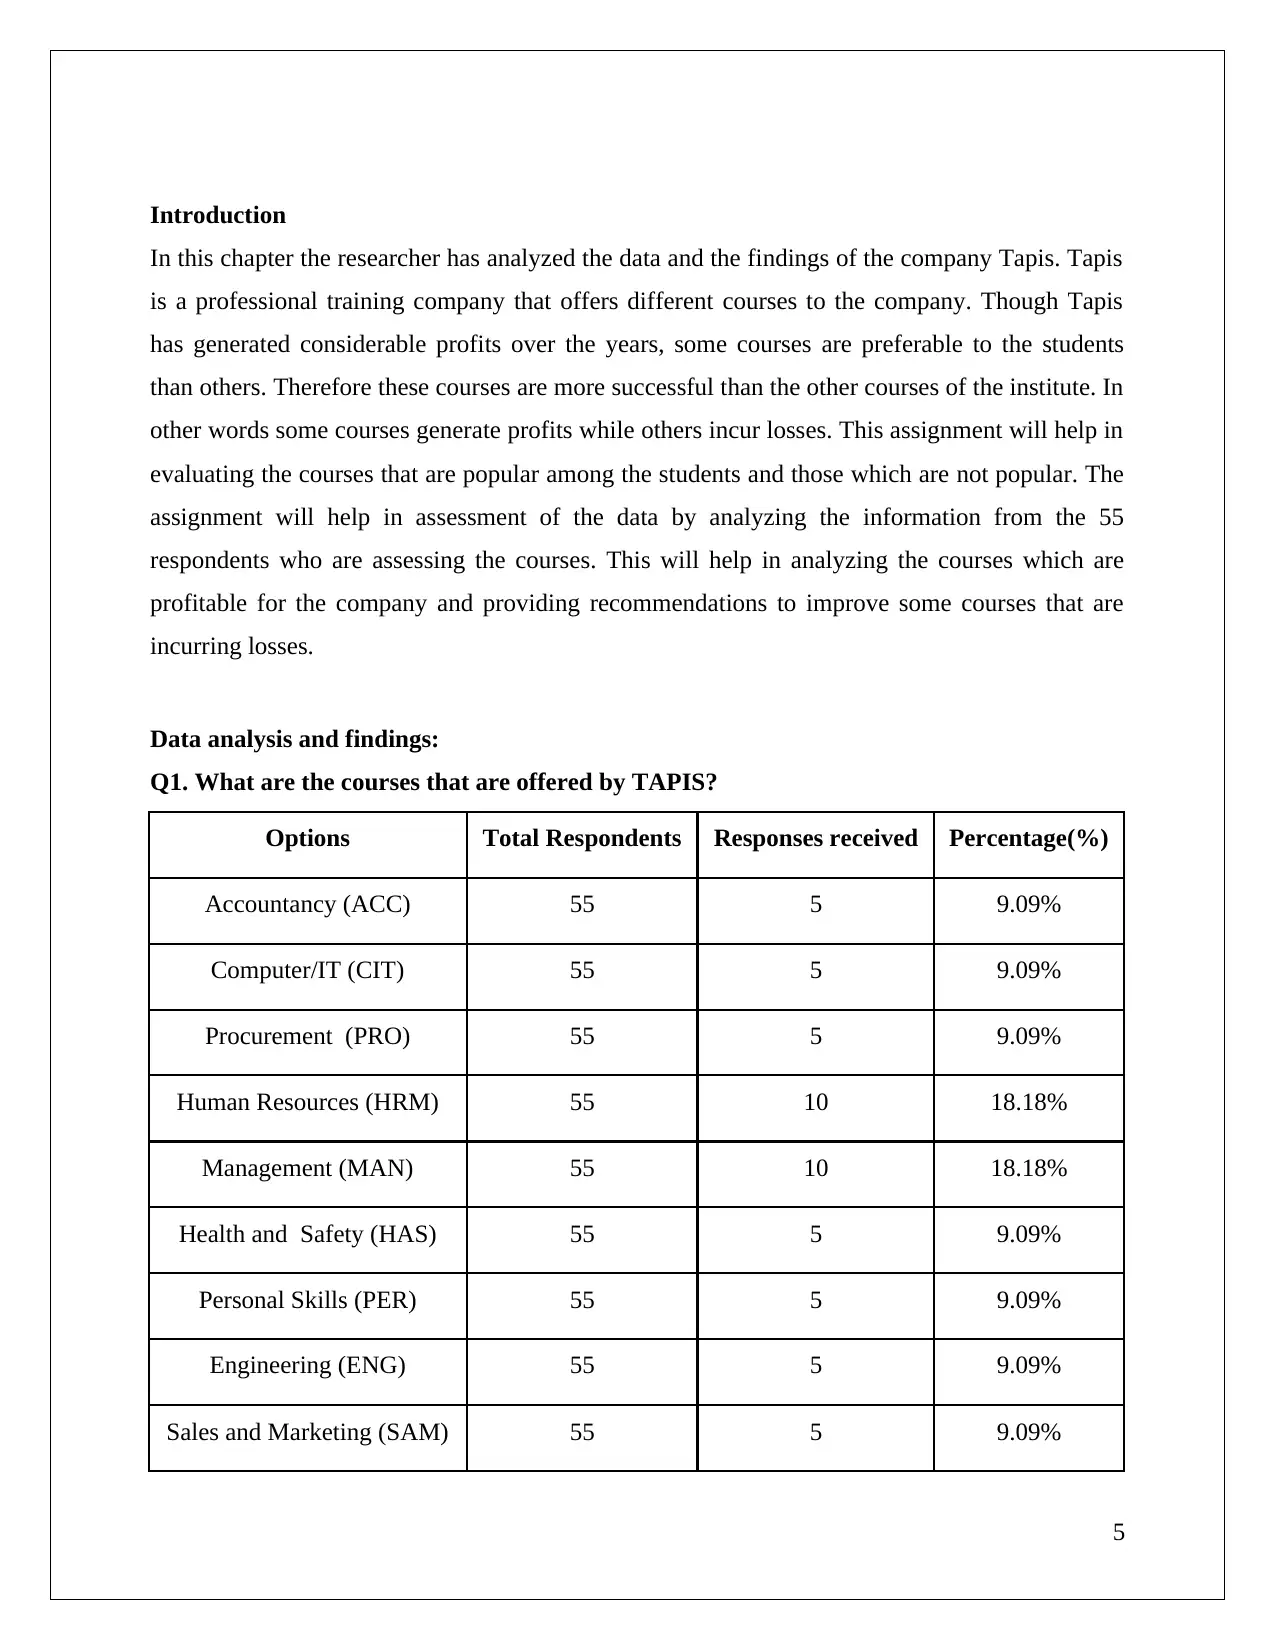
Introduction
In this chapter the researcher has analyzed the data and the findings of the company Tapis. Tapis
is a professional training company that offers different courses to the company. Though Tapis
has generated considerable profits over the years, some courses are preferable to the students
than others. Therefore these courses are more successful than the other courses of the institute. In
other words some courses generate profits while others incur losses. This assignment will help in
evaluating the courses that are popular among the students and those which are not popular. The
assignment will help in assessment of the data by analyzing the information from the 55
respondents who are assessing the courses. This will help in analyzing the courses which are
profitable for the company and providing recommendations to improve some courses that are
incurring losses.
Data analysis and findings:
Q1. What are the courses that are offered by TAPIS?
Options Total Respondents Responses received Percentage(%)
Accountancy (ACC) 55 5 9.09%
Computer/IT (CIT) 55 5 9.09%
Procurement (PRO) 55 5 9.09%
Human Resources (HRM) 55 10 18.18%
Management (MAN) 55 10 18.18%
Health and Safety (HAS) 55 5 9.09%
Personal Skills (PER) 55 5 9.09%
Engineering (ENG) 55 5 9.09%
Sales and Marketing (SAM) 55 5 9.09%
5
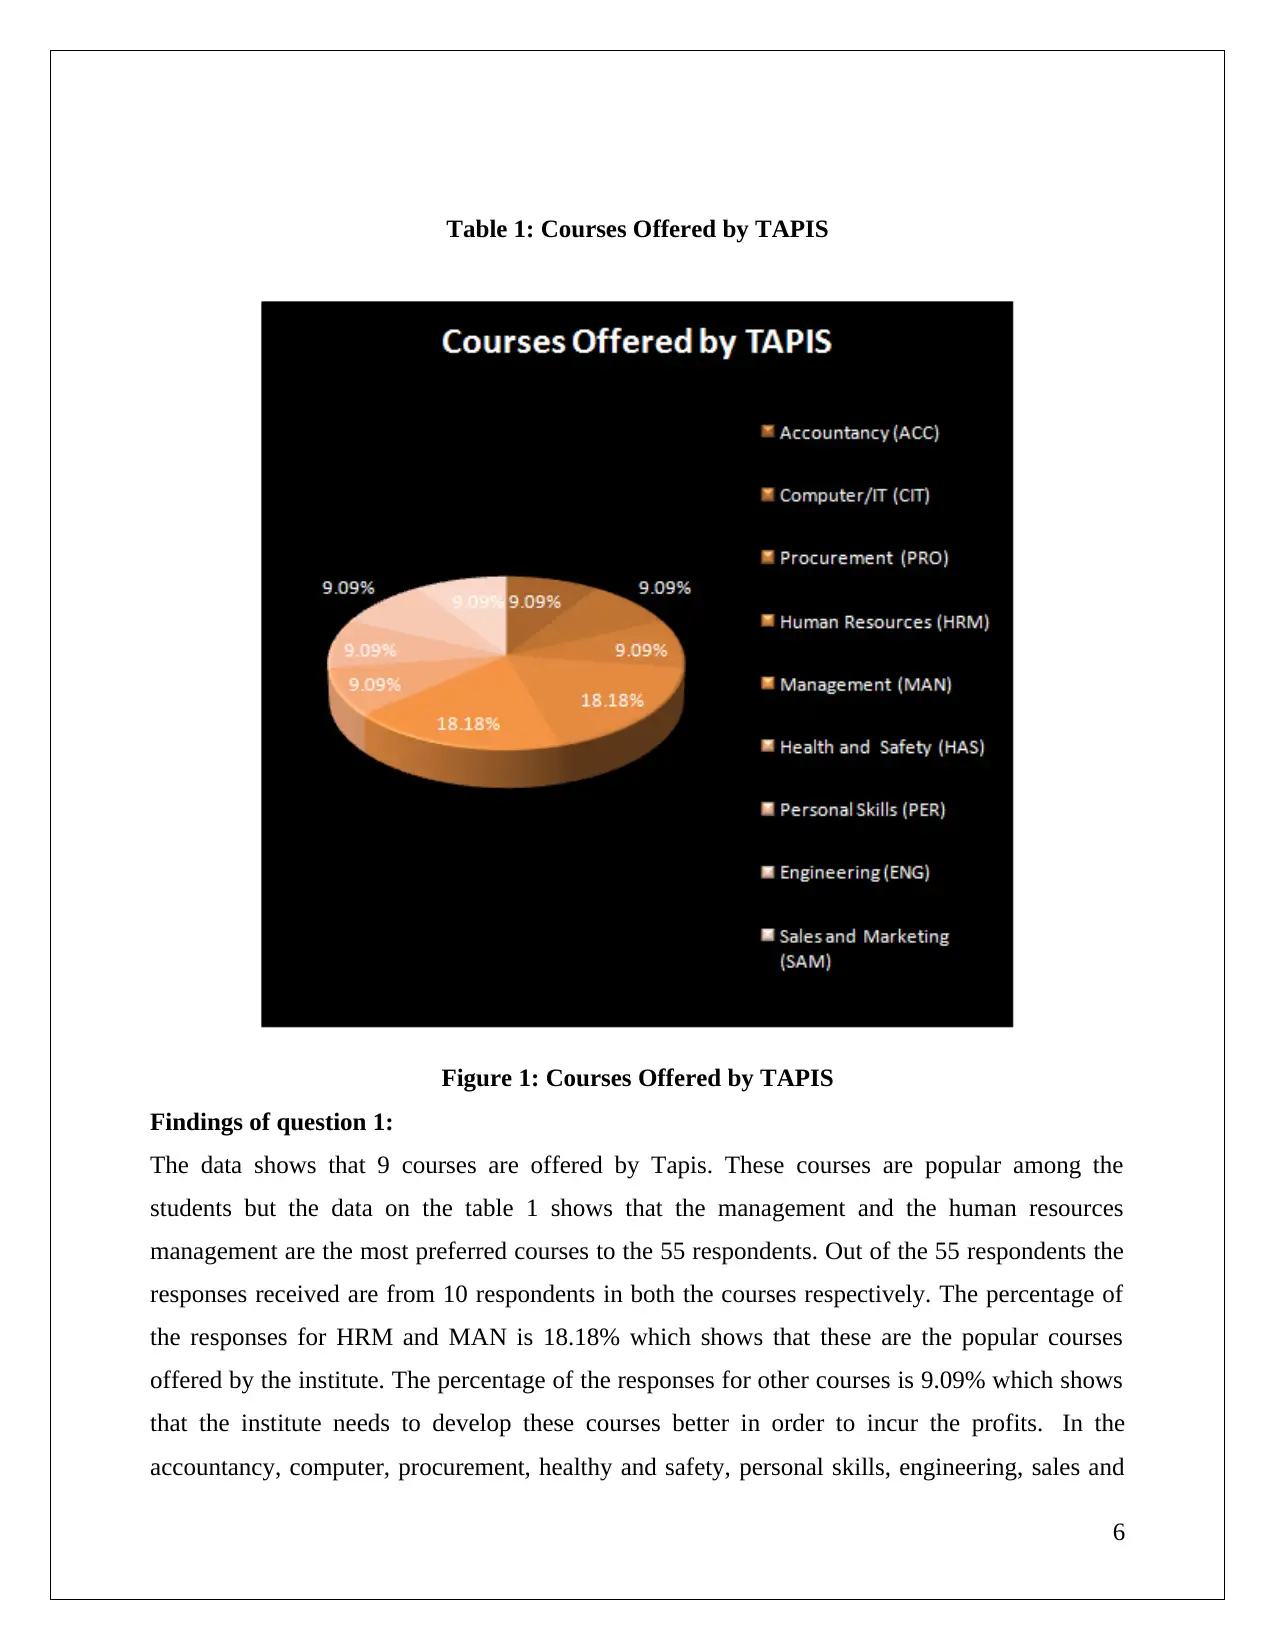
Table 1: Courses Offered by TAPIS
Figure 1: Courses Offered by TAPIS
Findings of question 1:
The data shows that 9 courses are offered by Tapis. These courses are popular among the
students but the data on the table 1 shows that the management and the human resources
management are the most preferred courses to the 55 respondents. Out of the 55 respondents the
responses received are from 10 respondents in both the courses respectively. The percentage of
the responses for HRM and MAN is 18.18% which shows that these are the popular courses
offered by the institute. The percentage of the responses for other courses is 9.09% which shows
that the institute needs to develop these courses better in order to incur the profits. In the
accountancy, computer, procurement, healthy and safety, personal skills, engineering, sales and
6
⊘ This is a preview!⊘
Do you want full access?
Subscribe today to unlock all pages.
Trusted by 1+ million students worldwide
marketing the percentage of the responses received are less as compared to HRM and
management. Therefore the courses of human resource and management are popular among the
students thereby generating profits for the students.
Analysis of question 1:
The given table shows that the respondents prefer the human resource and management courses
more than the other courses. The course trainers of HRM and management are the most
successful ones as compared to others. Majority of the students prefer these two courses to
others. The different courses that are offered by the institute are popular among the students as
the students prefer this institute for these courses to other ones.. The faculty of these courses is
better than those of others. The institute needs to offer more courses in order to establish it as an
professional successful institute. The development of the infrastructure and the internal factors
such as discipline will help the institute in considering other professional courses in the institute.
The HRM is popular as it helps in maximizing the performance of the employees in an
organization. As Tapis is situated in an industrial area and most of the employees are company
based so there is a need of HRM in a company. It helps in building the organizational structure
so the human resource is very popular in any company. The management also helps in
establishing the aims and objectives of any organization. However the other courses are not so
popular among the masses. Considering the high employability in these HRM and MAN the
students find these courses quite alluring.
Q2. Which courses do you think are booked mostly?
Options Total Respondents Responses received Percentage(%)
Accountancy (ACC) 55 15 27.27%
Computer/IT (CIT) 55 10 18.18%
Personal Skills (PER) 55 10 18.18%
Human Resources (HRM) 55 10 18.18%
Management (MAN) 55 10 18.18%
7
Paraphrase This Document
Need a fresh take? Get an instant paraphrase of this document with our AI Paraphraser
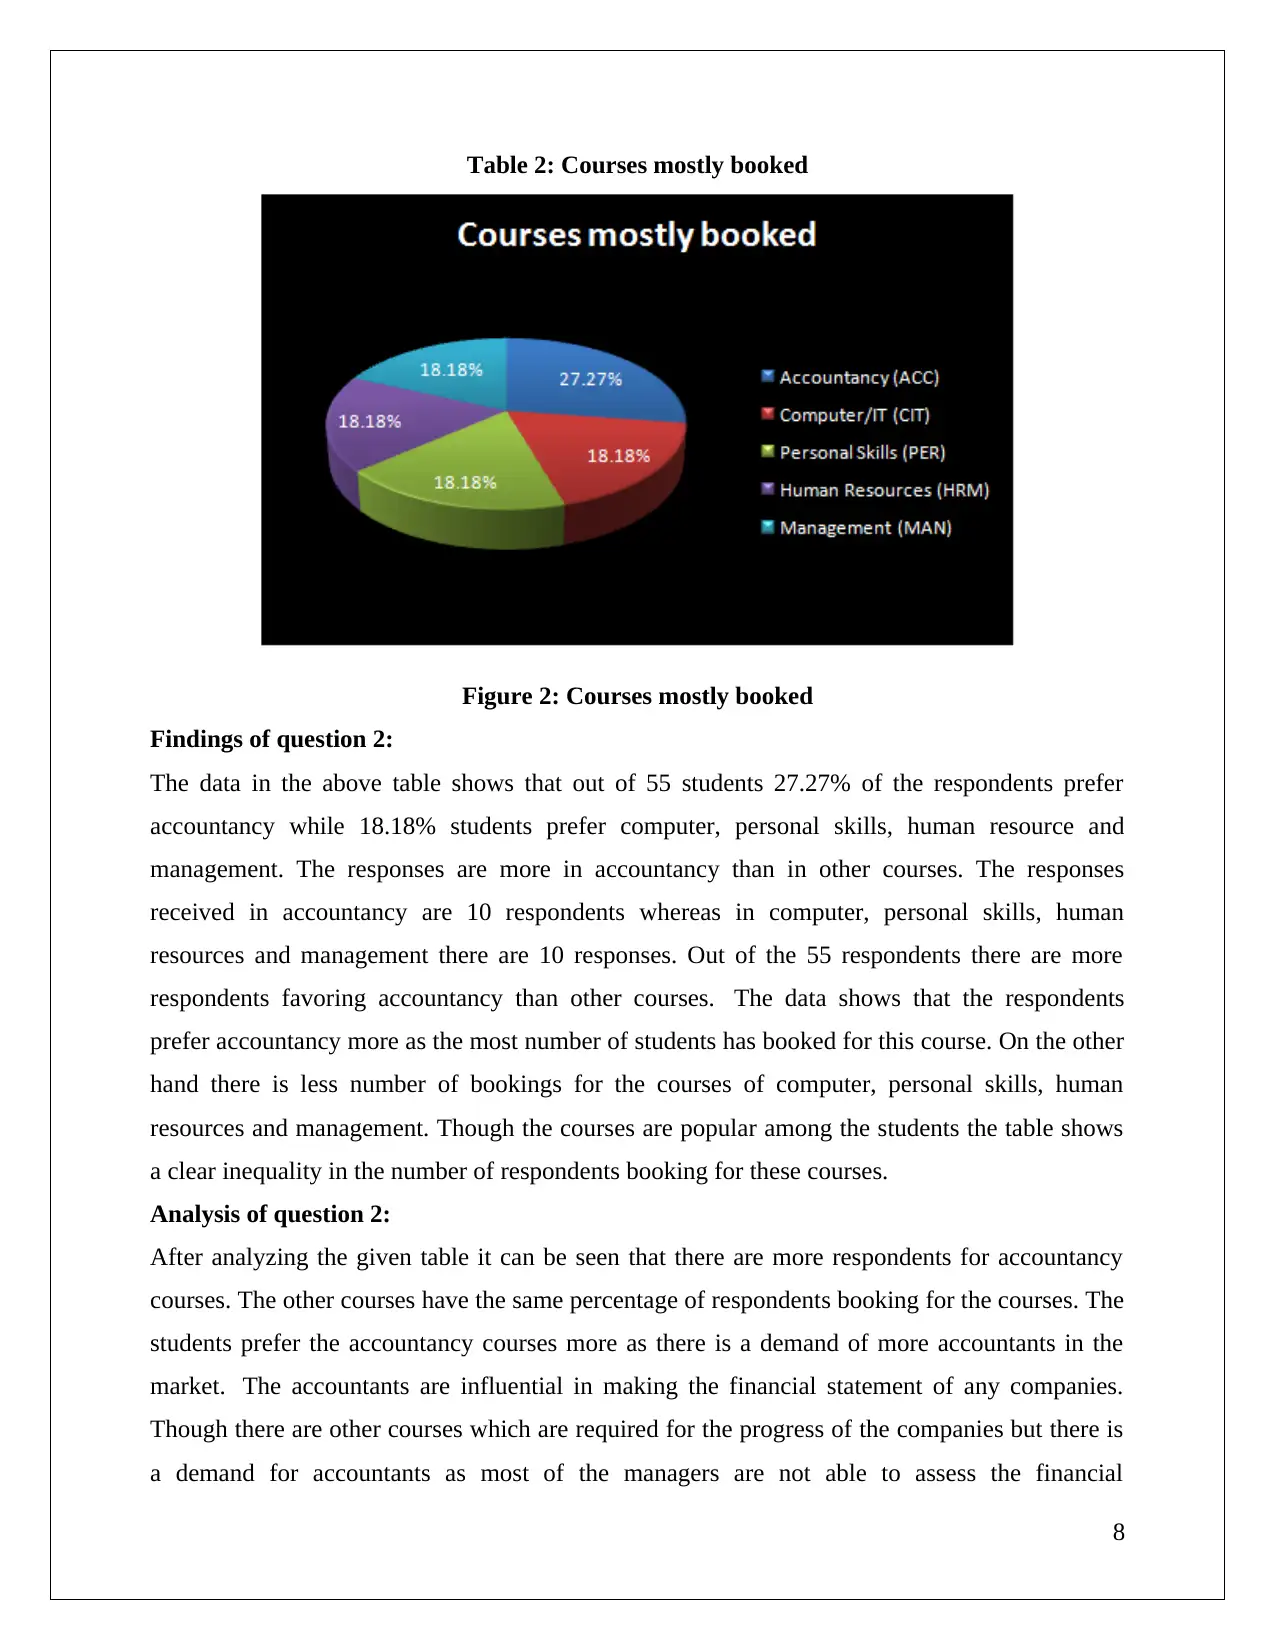
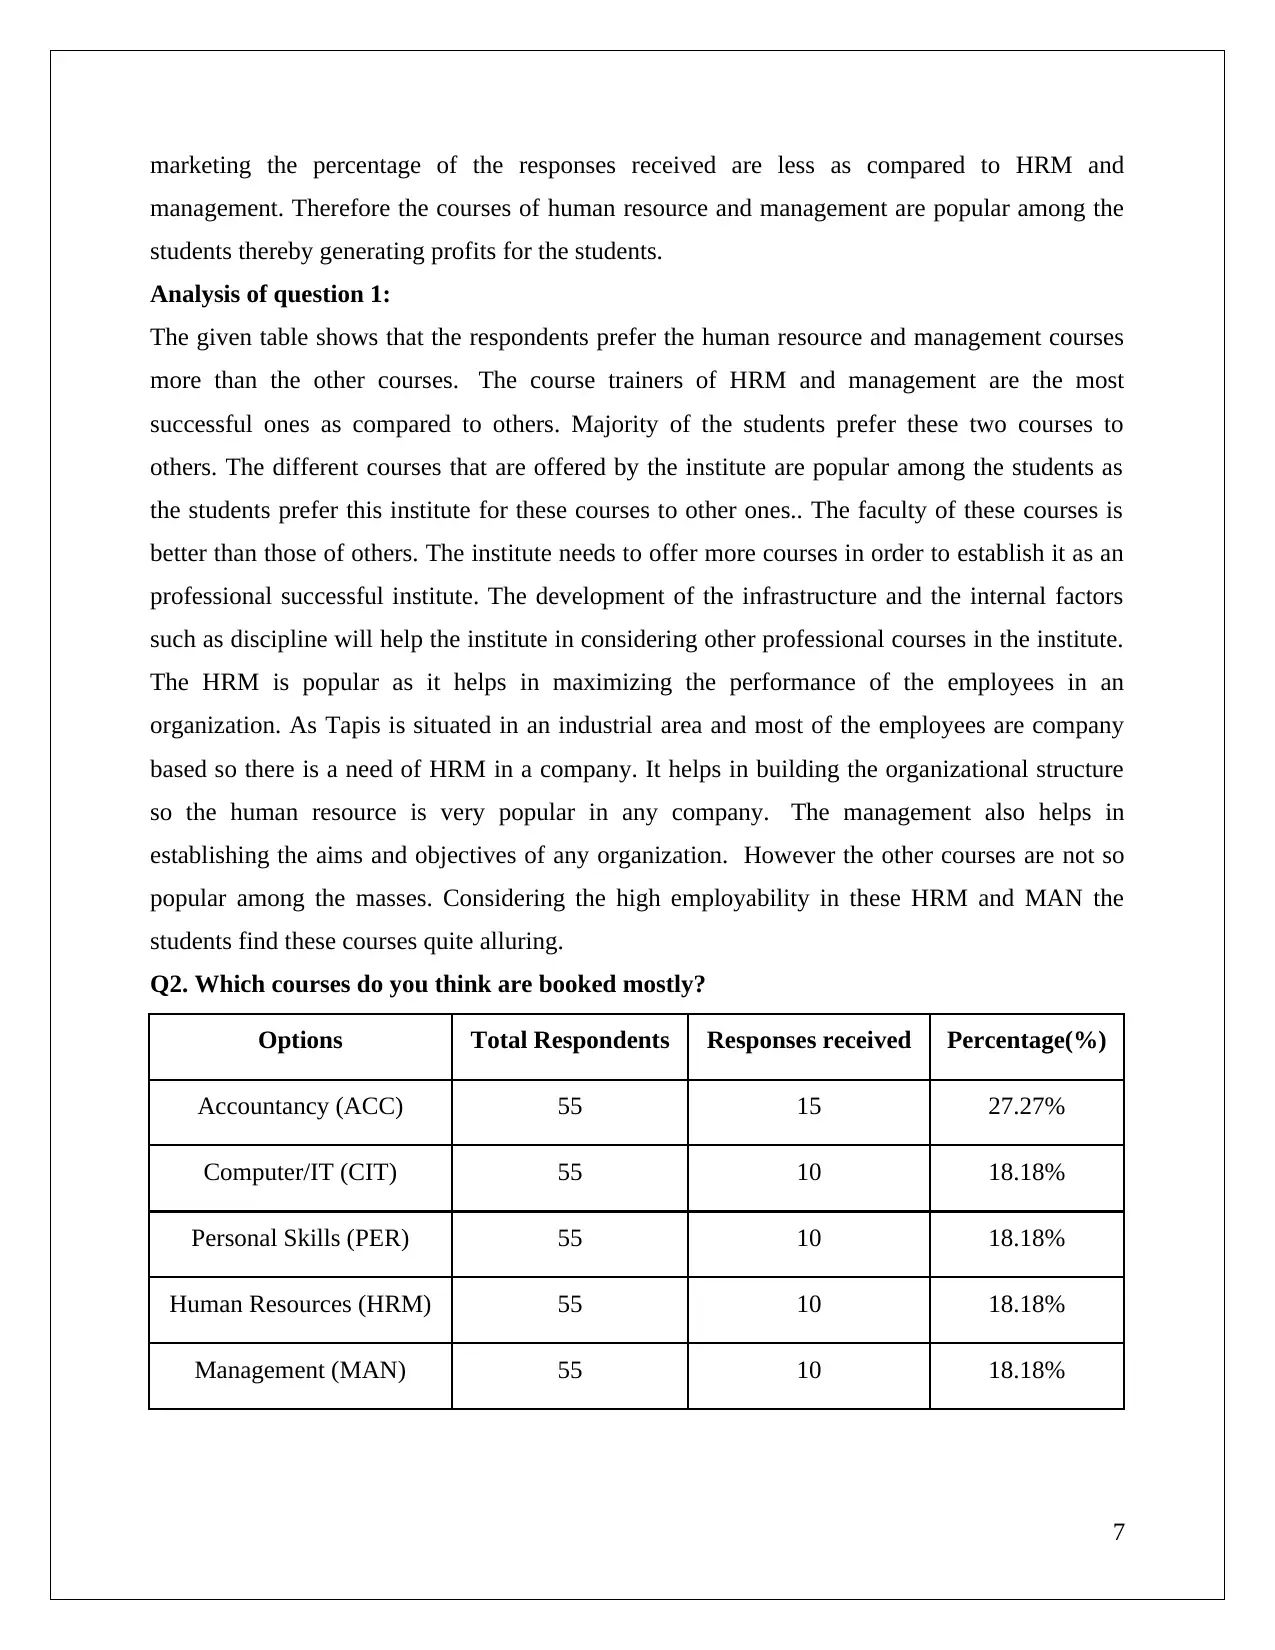
Table 2: Courses mostly booked
Figure 2: Courses mostly booked
Findings of question 2:
The data in the above table shows that out of 55 students 27.27% of the respondents prefer
accountancy while 18.18% students prefer computer, personal skills, human resource and
management. The responses are more in accountancy than in other courses. The responses
received in accountancy are 10 respondents whereas in computer, personal skills, human
resources and management there are 10 responses. Out of the 55 respondents there are more
respondents favoring accountancy than other courses. The data shows that the respondents
prefer accountancy more as the most number of students has booked for this course. On the other
hand there is less number of bookings for the courses of computer, personal skills, human
resources and management. Though the courses are popular among the students the table shows
a clear inequality in the number of respondents booking for these courses.
Analysis of question 2:
After analyzing the given table it can be seen that there are more respondents for accountancy
courses. The other courses have the same percentage of respondents booking for the courses. The
students prefer the accountancy courses more as there is a demand of more accountants in the
market. The accountants are influential in making the financial statement of any companies.
Though there are other courses which are required for the progress of the companies but there is
a demand for accountants as most of the managers are not able to assess the financial
8
implications on their business. Most of them do not understand the inclusion of primary costs,
total costs, manufacturing costs and other terms like regression in the financial statement. As a
result their business is not able to generate better revenues and maximize profit. Therefore they
need accountants in order to make the business profitably. In addition to the market demand the
faculty of this course is good and due to good infrastructure in the institute the students prefer
this course to others. The faculty of other courses is not better as accountancy course so the
booking for this course is more than others. Further, the fees for this course are less as compared
to human resource and personal skills.
Q3. Which courses do you think are booked less?
Options Total Respondents Responses received Percentage(%)
Procurement (PRO) 55 15 27.27%
Health and Safety (HAS) 55 15 18.18%
Engineering (ENG) 55 5 9.09%
Sales and Marketing (SAM) 55 20 36.36%
Table 3: Courses booked less
Figure 3: Courses booked less
Findings of question 3:
9
⊘ This is a preview!⊘
Do you want full access?
Subscribe today to unlock all pages.
Trusted by 1+ million students worldwide
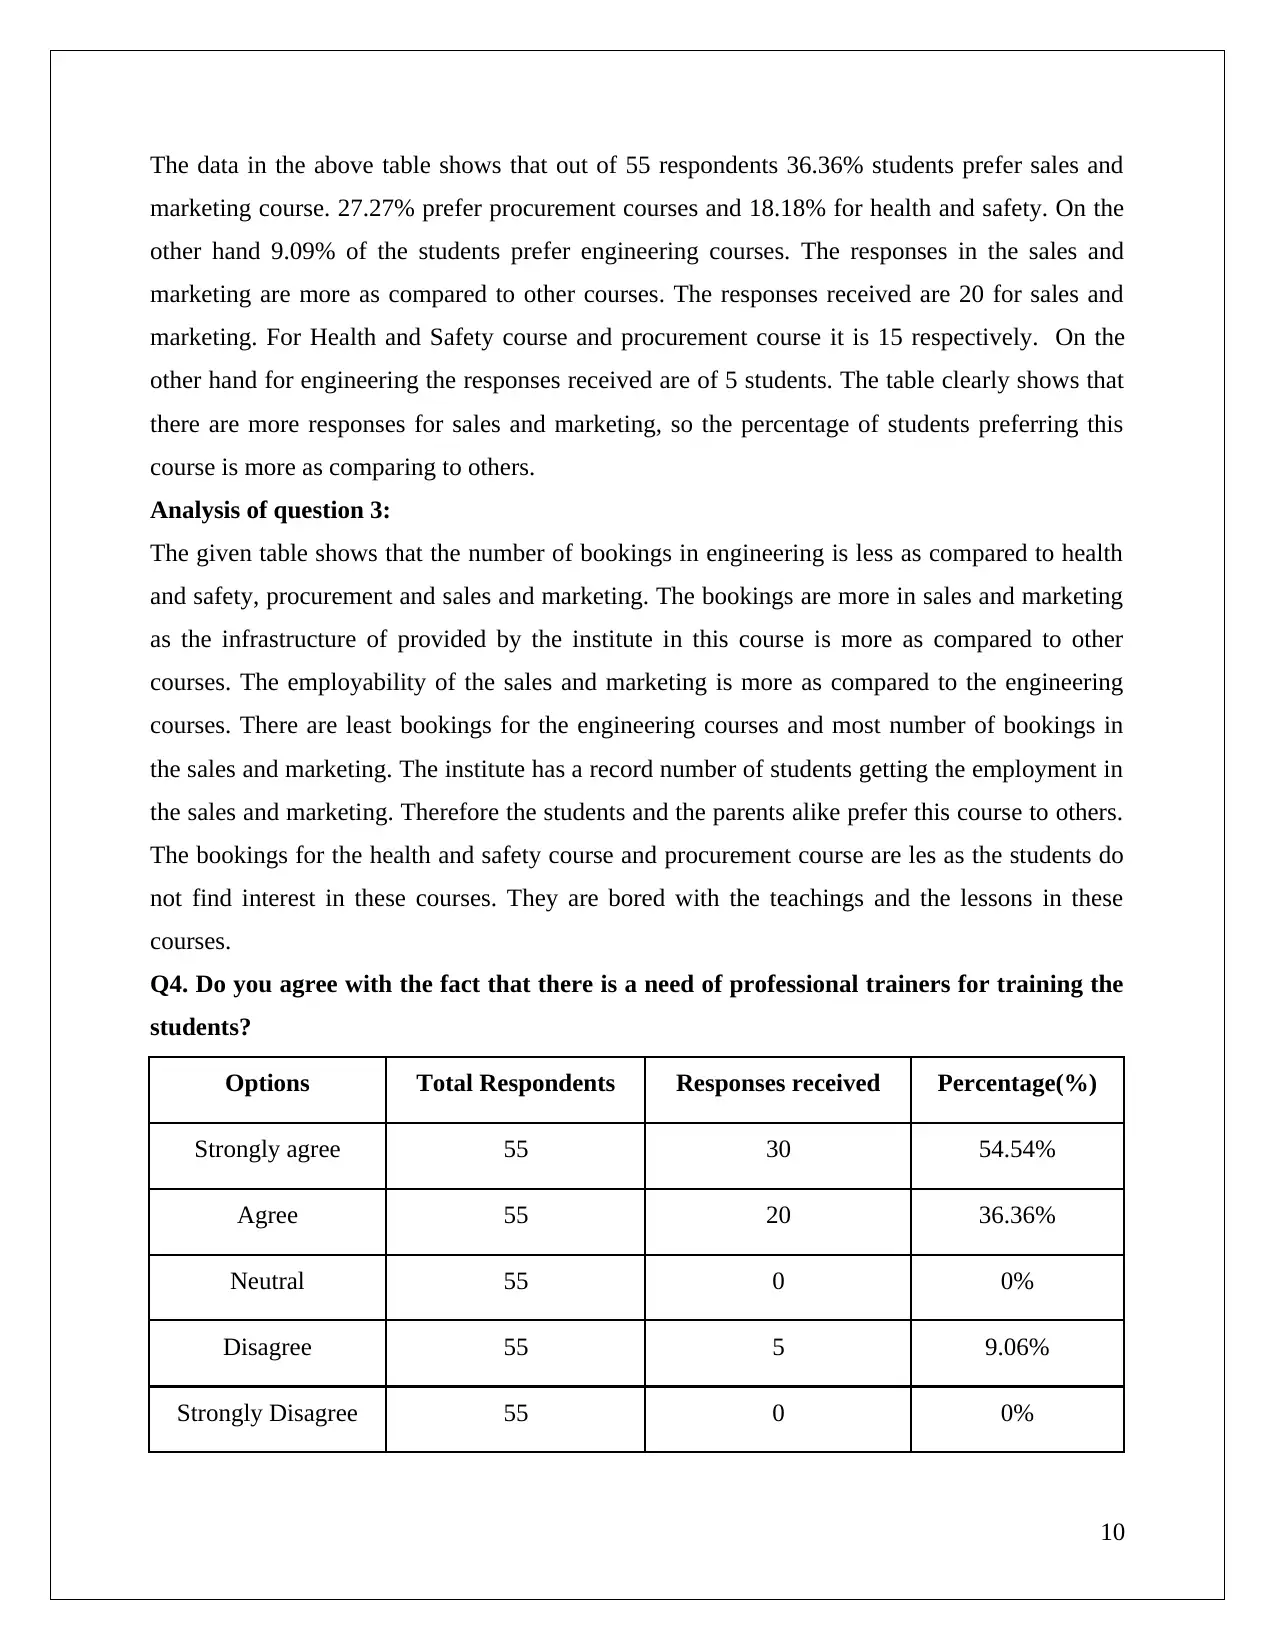
The data in the above table shows that out of 55 respondents 36.36% students prefer sales and
marketing course. 27.27% prefer procurement courses and 18.18% for health and safety. On the
other hand 9.09% of the students prefer engineering courses. The responses in the sales and
marketing are more as compared to other courses. The responses received are 20 for sales and
marketing. For Health and Safety course and procurement course it is 15 respectively. On the
other hand for engineering the responses received are of 5 students. The table clearly shows that
there are more responses for sales and marketing, so the percentage of students preferring this
course is more as comparing to others.
Analysis of question 3:
The given table shows that the number of bookings in engineering is less as compared to health
and safety, procurement and sales and marketing. The bookings are more in sales and marketing
as the infrastructure of provided by the institute in this course is more as compared to other
courses. The employability of the sales and marketing is more as compared to the engineering
courses. There are least bookings for the engineering courses and most number of bookings in
the sales and marketing. The institute has a record number of students getting the employment in
the sales and marketing. Therefore the students and the parents alike prefer this course to others.
The bookings for the health and safety course and procurement course are les as the students do
not find interest in these courses. They are bored with the teachings and the lessons in these
courses.
Q4. Do you agree with the fact that there is a need of professional trainers for training the
students?
Options Total Respondents Responses received Percentage(%)
Strongly agree 55 30 54.54%
Agree 55 20 36.36%
Neutral 55 0 0%
Disagree 55 5 9.06%
Strongly Disagree 55 0 0%
10
Paraphrase This Document
Need a fresh take? Get an instant paraphrase of this document with our AI Paraphraser
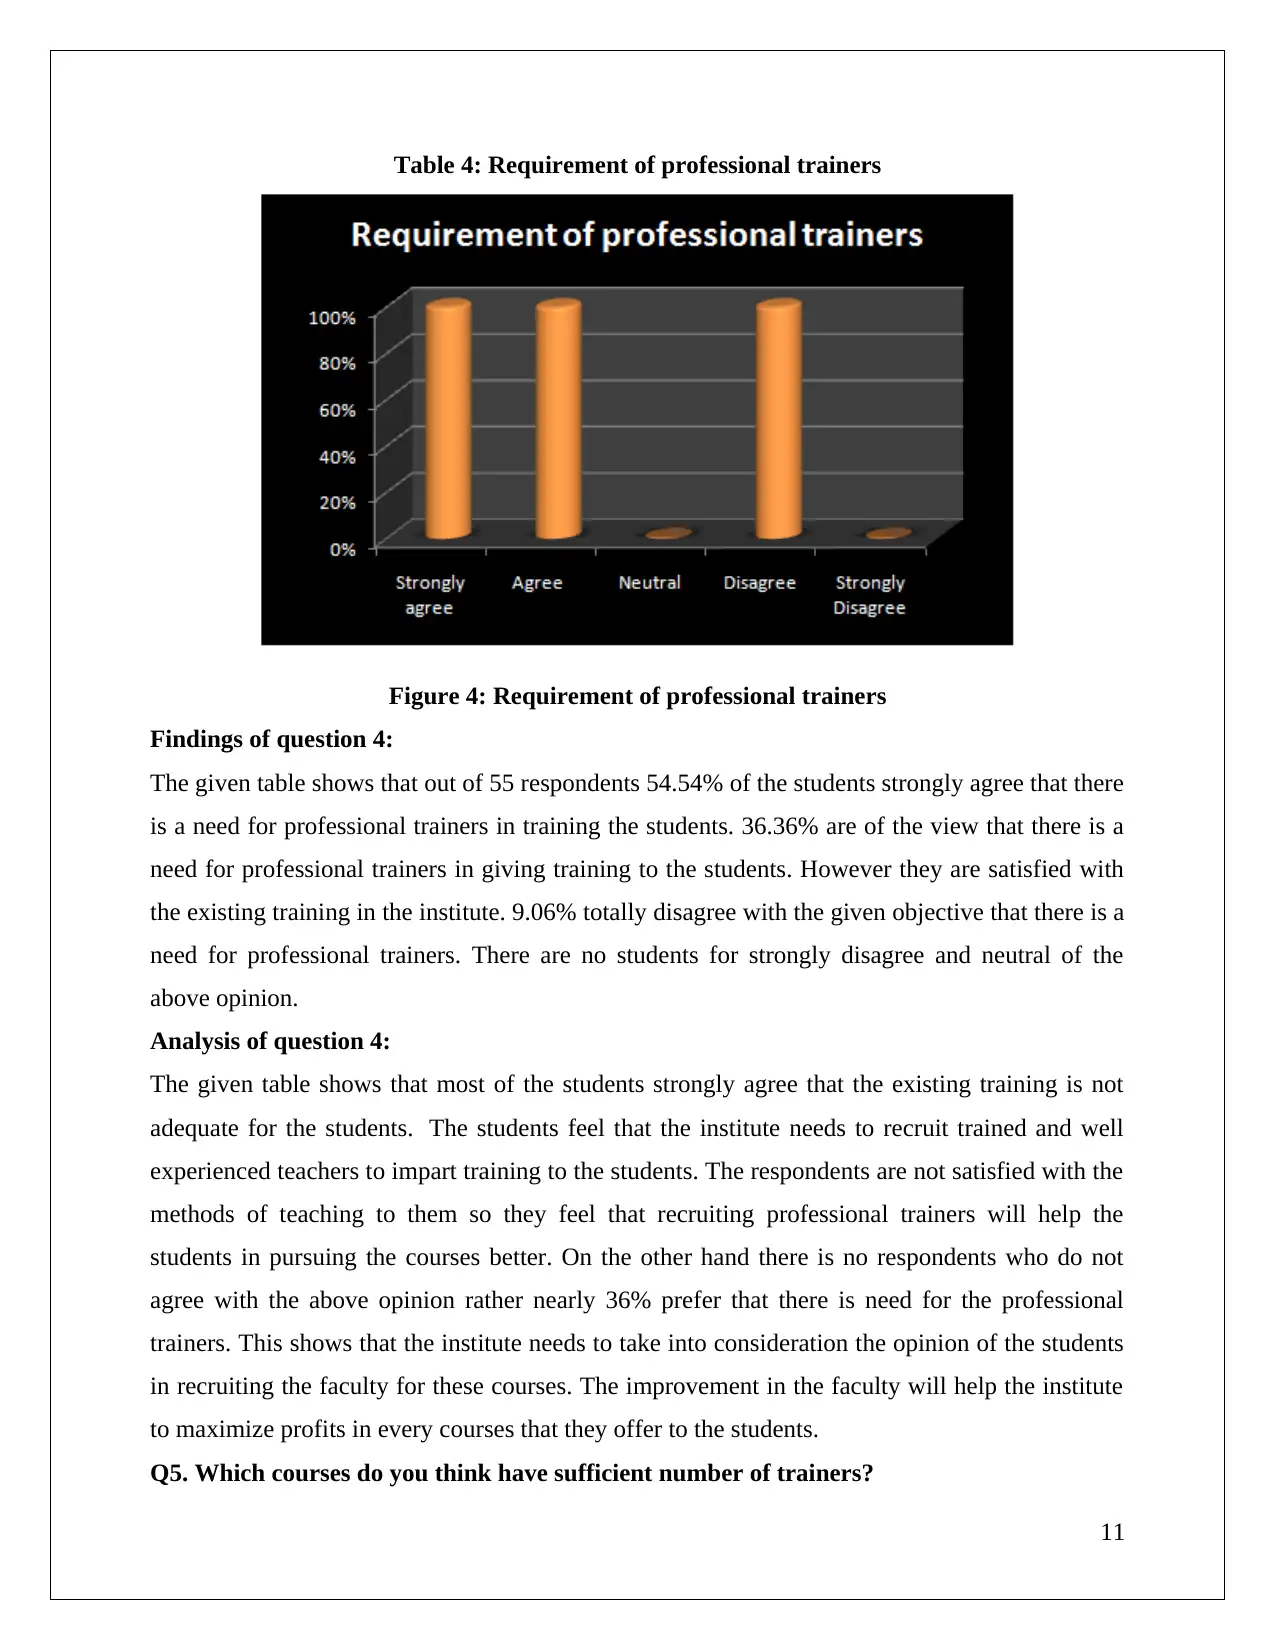
Table 4: Requirement of professional trainers
Figure 4: Requirement of professional trainers
Findings of question 4:
The given table shows that out of 55 respondents 54.54% of the students strongly agree that there
is a need for professional trainers in training the students. 36.36% are of the view that there is a
need for professional trainers in giving training to the students. However they are satisfied with
the existing training in the institute. 9.06% totally disagree with the given objective that there is a
need for professional trainers. There are no students for strongly disagree and neutral of the
above opinion.
Analysis of question 4:
The given table shows that most of the students strongly agree that the existing training is not
adequate for the students. The students feel that the institute needs to recruit trained and well
experienced teachers to impart training to the students. The respondents are not satisfied with the
methods of teaching to them so they feel that recruiting professional trainers will help the
students in pursuing the courses better. On the other hand there is no respondents who do not
agree with the above opinion rather nearly 36% prefer that there is need for the professional
trainers. This shows that the institute needs to take into consideration the opinion of the students
in recruiting the faculty for these courses. The improvement in the faculty will help the institute
to maximize profits in every courses that they offer to the students.
Q5. Which courses do you think have sufficient number of trainers?
11
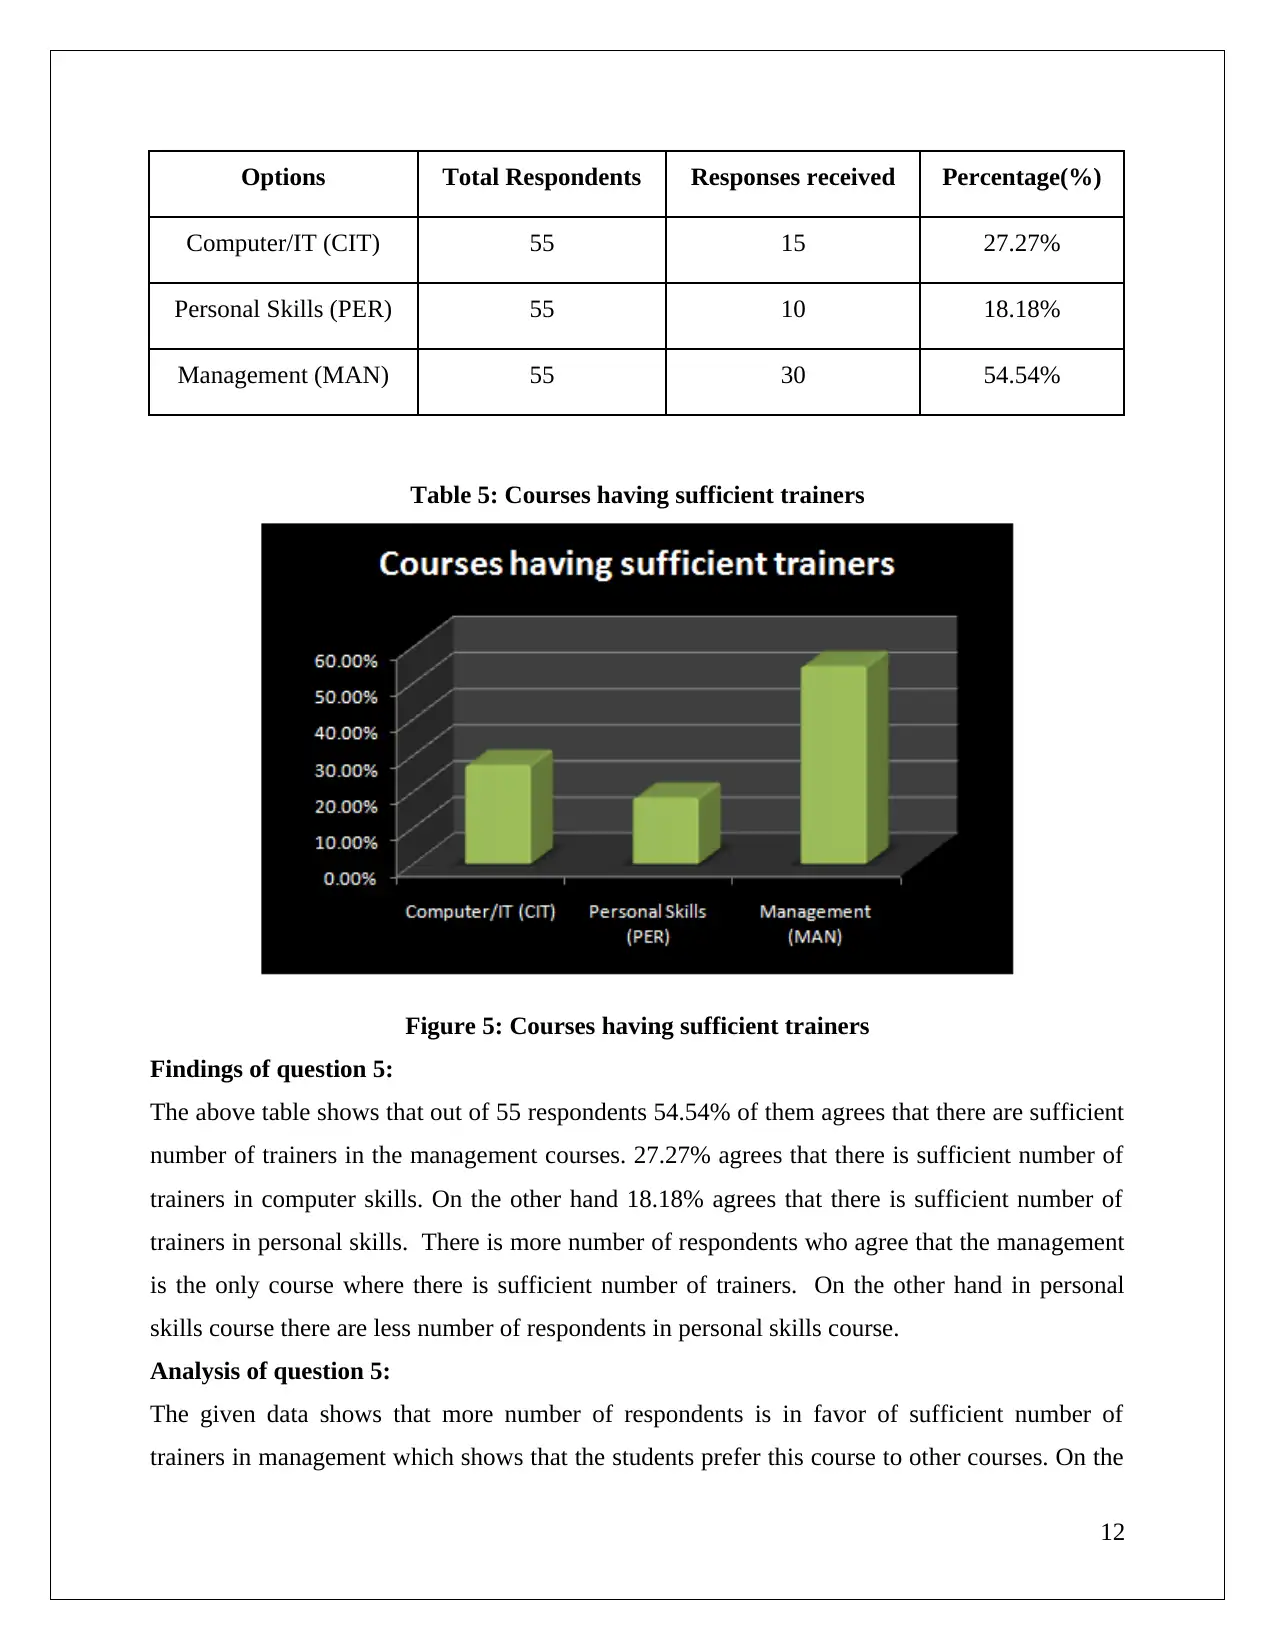
Options Total Respondents Responses received Percentage(%)
Computer/IT (CIT) 55 15 27.27%
Personal Skills (PER) 55 10 18.18%
Management (MAN) 55 30 54.54%
Table 5: Courses having sufficient trainers
Figure 5: Courses having sufficient trainers
Findings of question 5:
The above table shows that out of 55 respondents 54.54% of them agrees that there are sufficient
number of trainers in the management courses. 27.27% agrees that there is sufficient number of
trainers in computer skills. On the other hand 18.18% agrees that there is sufficient number of
trainers in personal skills. There is more number of respondents who agree that the management
is the only course where there is sufficient number of trainers. On the other hand in personal
skills course there are less number of respondents in personal skills course.
Analysis of question 5:
The given data shows that more number of respondents is in favor of sufficient number of
trainers in management which shows that the students prefer this course to other courses. On the
12
⊘ This is a preview!⊘
Do you want full access?
Subscribe today to unlock all pages.
Trusted by 1+ million students worldwide
1 out of 24
Related Documents


Your All-in-One AI-Powered Toolkit for Academic Success.
+13062052269
info@desklib.com
Available 24*7 on WhatsApp / Email
![[object Object]](/_next/static/media/star-bottom.7253800d.svg)
Unlock your academic potential
Copyright © 2020–2026 A2Z Services. All Rights Reserved. Developed and managed by ZUCOL.