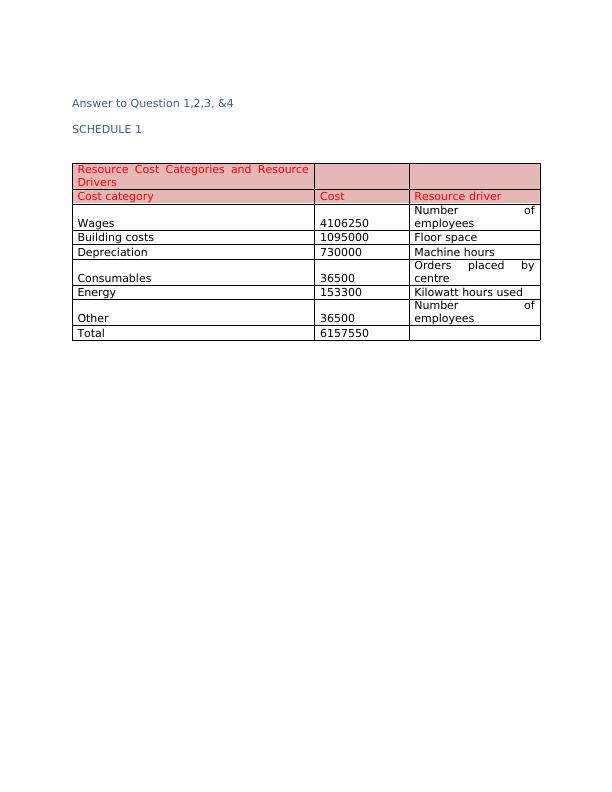
Resource Cost Categories and Resource Drivers
Added on 2022-11-25
15 Pages2601 Words102 Views
End of preview
Want to access all the pages? Upload your documents or become a member.
Activity Based Costing and Traditional Based Costing
|15
|2758
|96
Activity Based Costing vs Traditional/Absorption Costing
|12
|2627
|267
Comparison of Absorption Costing and Activity Based Costing
|15
|2569
|153
Report - Management Accounting
|15
|2908
|310
Management Accounting Project Report: Answers, Schedules, and List of Activities
|15
|3715
|233
Management Accounting: Cost Analysis and Activity Drivers
|25
|2530
|370