Impact of Speed on Accident Severity
VerifiedAdded on 2020/09/08
|28
|3335
|55
AI Summary
The assignment uses data mining methods to analyze the relationship between vehicle speed and accident severity. It concludes that there is a significant importance of controlling speed, particularly at 30.68, where both casualty number and severity level are high. The study suggests forming rules in the UK to limit speed to below 30 to reduce accidents and maintain moderate severity levels.
Contribute Materials
Your contribution can guide someone’s learning journey. Share your
documents today.

APPLICATION OF DATA MINING AND
BUSINESS INTELLIGENCE TO REAL
DATA
BUSINESS INTELLIGENCE TO REAL
DATA
Secure Best Marks with AI Grader
Need help grading? Try our AI Grader for instant feedback on your assignments.
TABLE OF CONTENTS
INTRODUCTION...........................................................................................................................1
1 Identification of specific problem that can be addressed by using data mining methods........1
2. Use data mining methods, visualize data and prepare report on descriptive analysis.............2
3. Check the data quality and preparation of data quality report for the model........................14
4 Data mining methods and their application............................................................................20
CONCLUSION..............................................................................................................................26
REFERENCES..............................................................................................................................27
INTRODUCTION
Analytics is the one of fastest growing domain across globe. In past few years many changes are observed in analytics space
and with advent of machine learning new innovation takes place in analytics field. In present research study practical application of
data mining techniques and business intelligence is demonstrated. Varied data mining methods can be used for analysis of data like
cluster analysis and decision tree approach etc. Data mining methods basically refers to the approaches that are used to explore data in
proper manner. In the report obtained results are analyzed in legitimate way and on that basis steps will be suggested that must be
followed to tackle accident rates.
1 Identification of specific problem that can be addressed by using data mining methods
While applying data mining methods it is very important to develop broad understanding about problem. Out of overall data
set by considering problem statement three variables are picked up and on same data mining methods are applied. These three
variables are accident severity, number of causalities and speed limit. It is very hard to estimate accurate severity level of accident
when same takes place in specific situation. Thus, problem statement is prepared and main objective is to identify severity level of
accident in different situations by taking in to account number of casuality and speed limit.
In order to address mentioned problem which is related to measurement of intensity or severity of accident when casuality
happened and vehicle speed comes in different categories cluster analysis and decision tree diagram is used. There is rationale behind
using these approaches in the present research studies. Cluster analysis approach reflect the data points which are similar to each other
in terms of proximity (How To Group Objects Into Similar Categories, Cluster Analysis, 2017). Thus areas where severity of accident,
number of casuality and speed limit have similarity can be identified and siutations can be identified when high level of severity of
accident comes in existance.
In order to obtain more detailed overview of this situation decision tree diagram is used which reflect the sequence in which
different events occur by considering proximity and Gini index (Decision tree, 2017). Confusuion matrix is also taken in to account in
decision tree to ensure that classification is made across different categories in proper manner. Thus, by using decision tree an attempt
1 | P a g e
is made to identify level of accident severity percentage at different level of speed limit. Further, in second stage at different level of
speed limit on different points of casualities severity of accident is measured. Interpreted results will clearly reflect speed limit on
which most of accident takes place and their severity level.
2. Use data mining methods, visualize data and prepare report on descriptive analysis
There are number of data mining techniques that are applied by analysts includes clustering, prediction analysis, decision tree,
sequential analysis and many others. Clustering is the technique which provides us detailed overview of the given data set. The
method arranges data in different clusters with similar characteristics. Every cluster is a group of several units that belongs to same
category with having similiar characteristics. Thus, the clustering method helps to group together the similar objects and units with
dissimilar characteristics are grouped into an another cluster. Thus, partioning the given data set into meaningul sub-classes referred as
cluster provides materialstic information for the data analysis. It is an unsupervised classification which have no predetermined
classes for the formation of clusters. A cluster in which there is existence of high similarities in intra class and low similarities in inter-
class is a sign of good cluster. It helps in gaining deepen understanding of the data set and helps to detect out hidden patterns.
Besides this, decision tree is also the best tehnique which helps to visualize data graphically and indicates possible
consequences, probable cost, outcome, resources and others which helps in rationalized decisions. It is a tree-like structure which
clearly present various chances along with the possible outcome and facilitates analyst in succesful decisions. It represent decision
note in square shape, chances are represented by circles and end notes are preseted in triangular shape. The most important benefit of
the decision tree is that it is a very simple method that provides important insight into the problem for making good decisions.
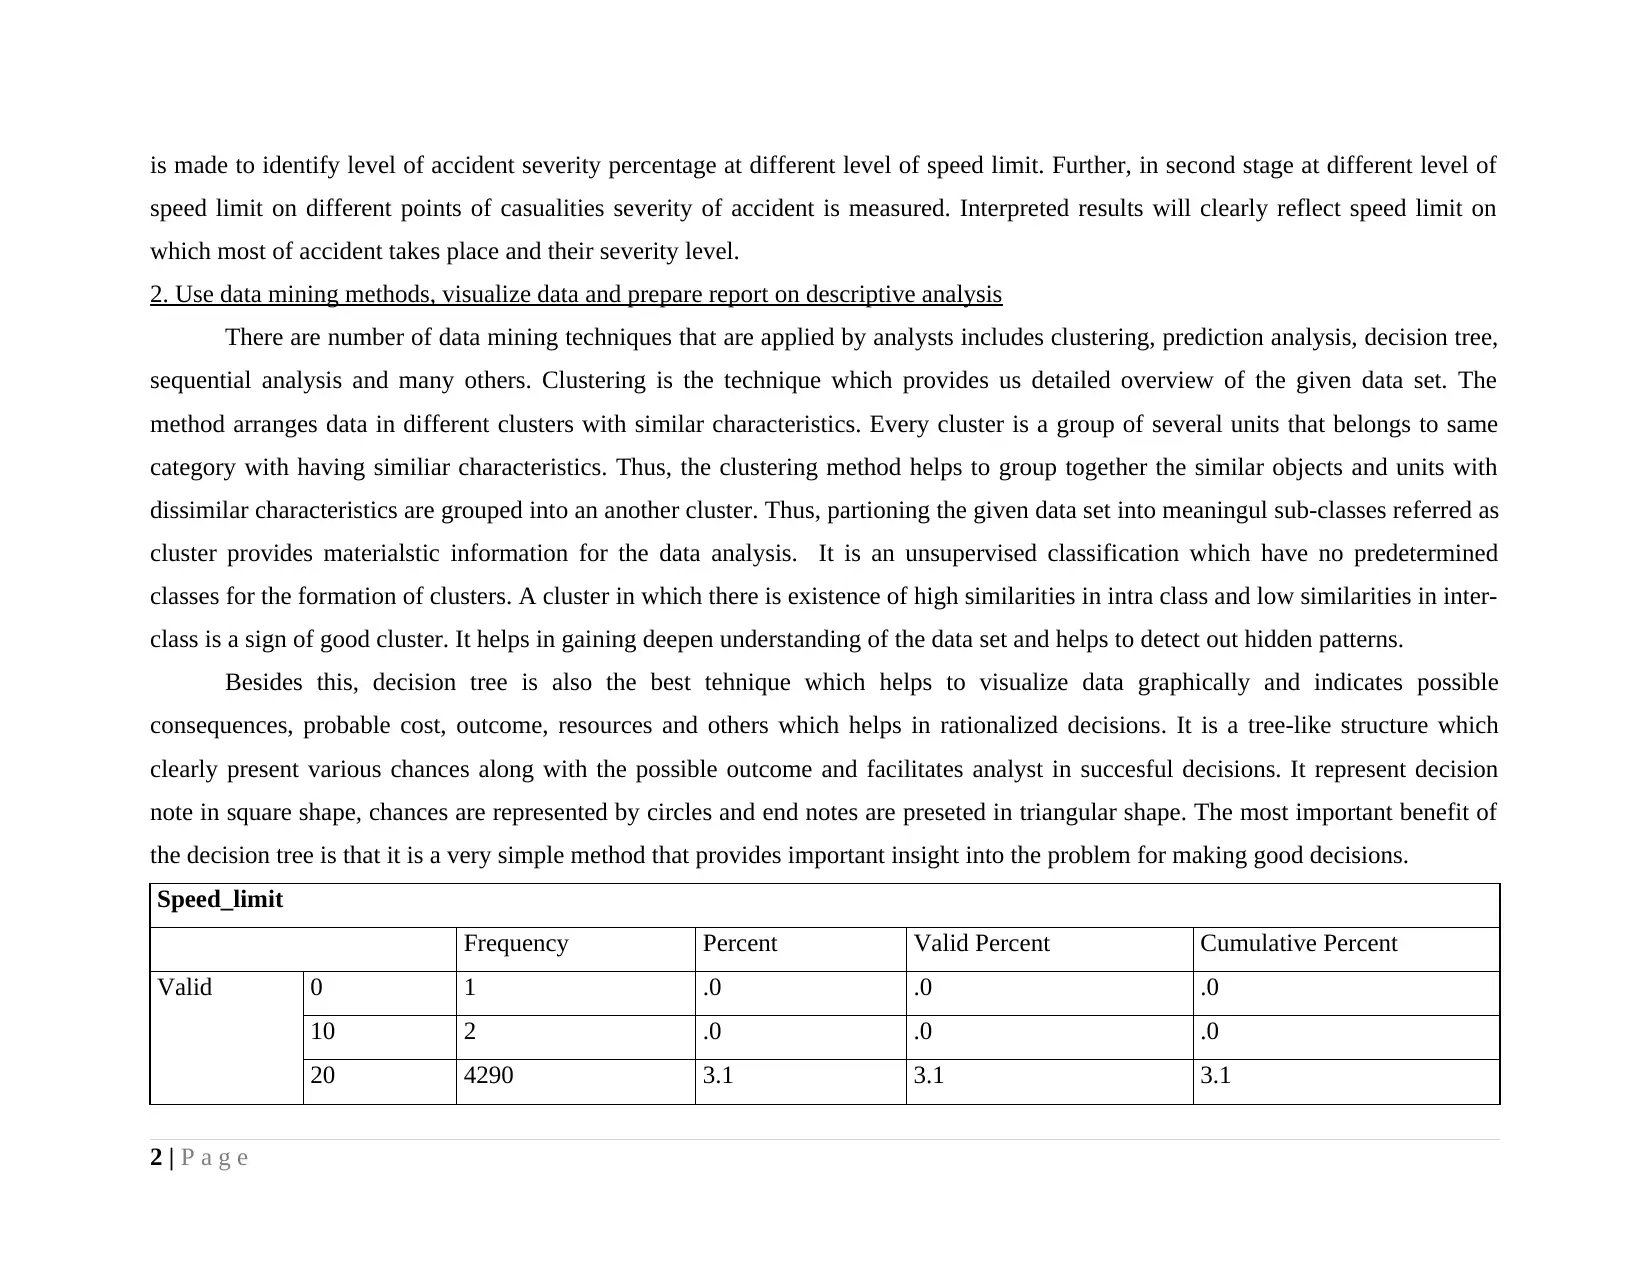
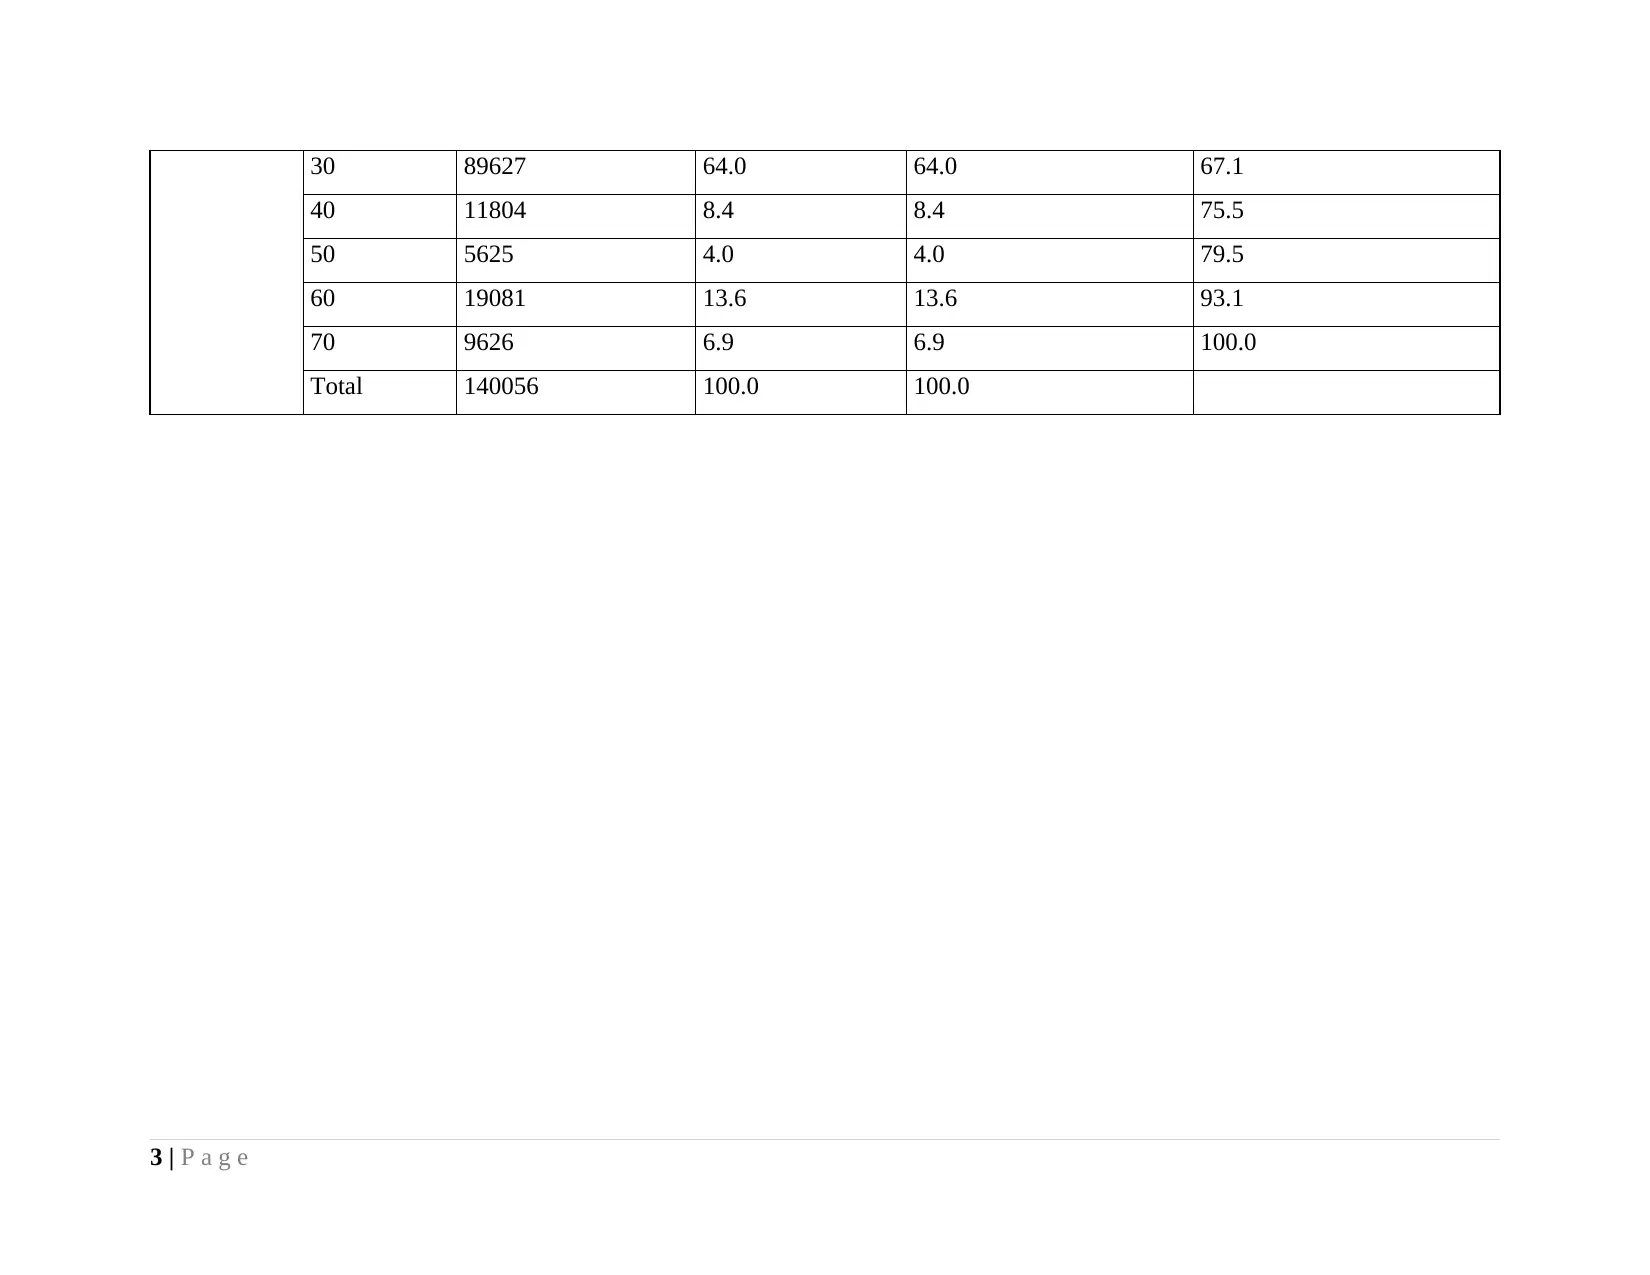
Speed_limit
Frequency Percent Valid Percent Cumulative Percent
Valid 0 1 .0 .0 .0
10 2 .0 .0 .0
20 4290 3.1 3.1 3.1
2 | P a g e
speed limit on different points of casualities severity of accident is measured. Interpreted results will clearly reflect speed limit on
which most of accident takes place and their severity level.
2. Use data mining methods, visualize data and prepare report on descriptive analysis
There are number of data mining techniques that are applied by analysts includes clustering, prediction analysis, decision tree,
sequential analysis and many others. Clustering is the technique which provides us detailed overview of the given data set. The
method arranges data in different clusters with similar characteristics. Every cluster is a group of several units that belongs to same
category with having similiar characteristics. Thus, the clustering method helps to group together the similar objects and units with
dissimilar characteristics are grouped into an another cluster. Thus, partioning the given data set into meaningul sub-classes referred as
cluster provides materialstic information for the data analysis. It is an unsupervised classification which have no predetermined
classes for the formation of clusters. A cluster in which there is existence of high similarities in intra class and low similarities in inter-
class is a sign of good cluster. It helps in gaining deepen understanding of the data set and helps to detect out hidden patterns.
Besides this, decision tree is also the best tehnique which helps to visualize data graphically and indicates possible
consequences, probable cost, outcome, resources and others which helps in rationalized decisions. It is a tree-like structure which
clearly present various chances along with the possible outcome and facilitates analyst in succesful decisions. It represent decision
note in square shape, chances are represented by circles and end notes are preseted in triangular shape. The most important benefit of
the decision tree is that it is a very simple method that provides important insight into the problem for making good decisions.
Speed_limit
Frequency Percent Valid Percent Cumulative Percent
Valid 0 1 .0 .0 .0
10 2 .0 .0 .0
20 4290 3.1 3.1 3.1
2 | P a g e
Secure Best Marks with AI Grader
Need help grading? Try our AI Grader for instant feedback on your assignments.
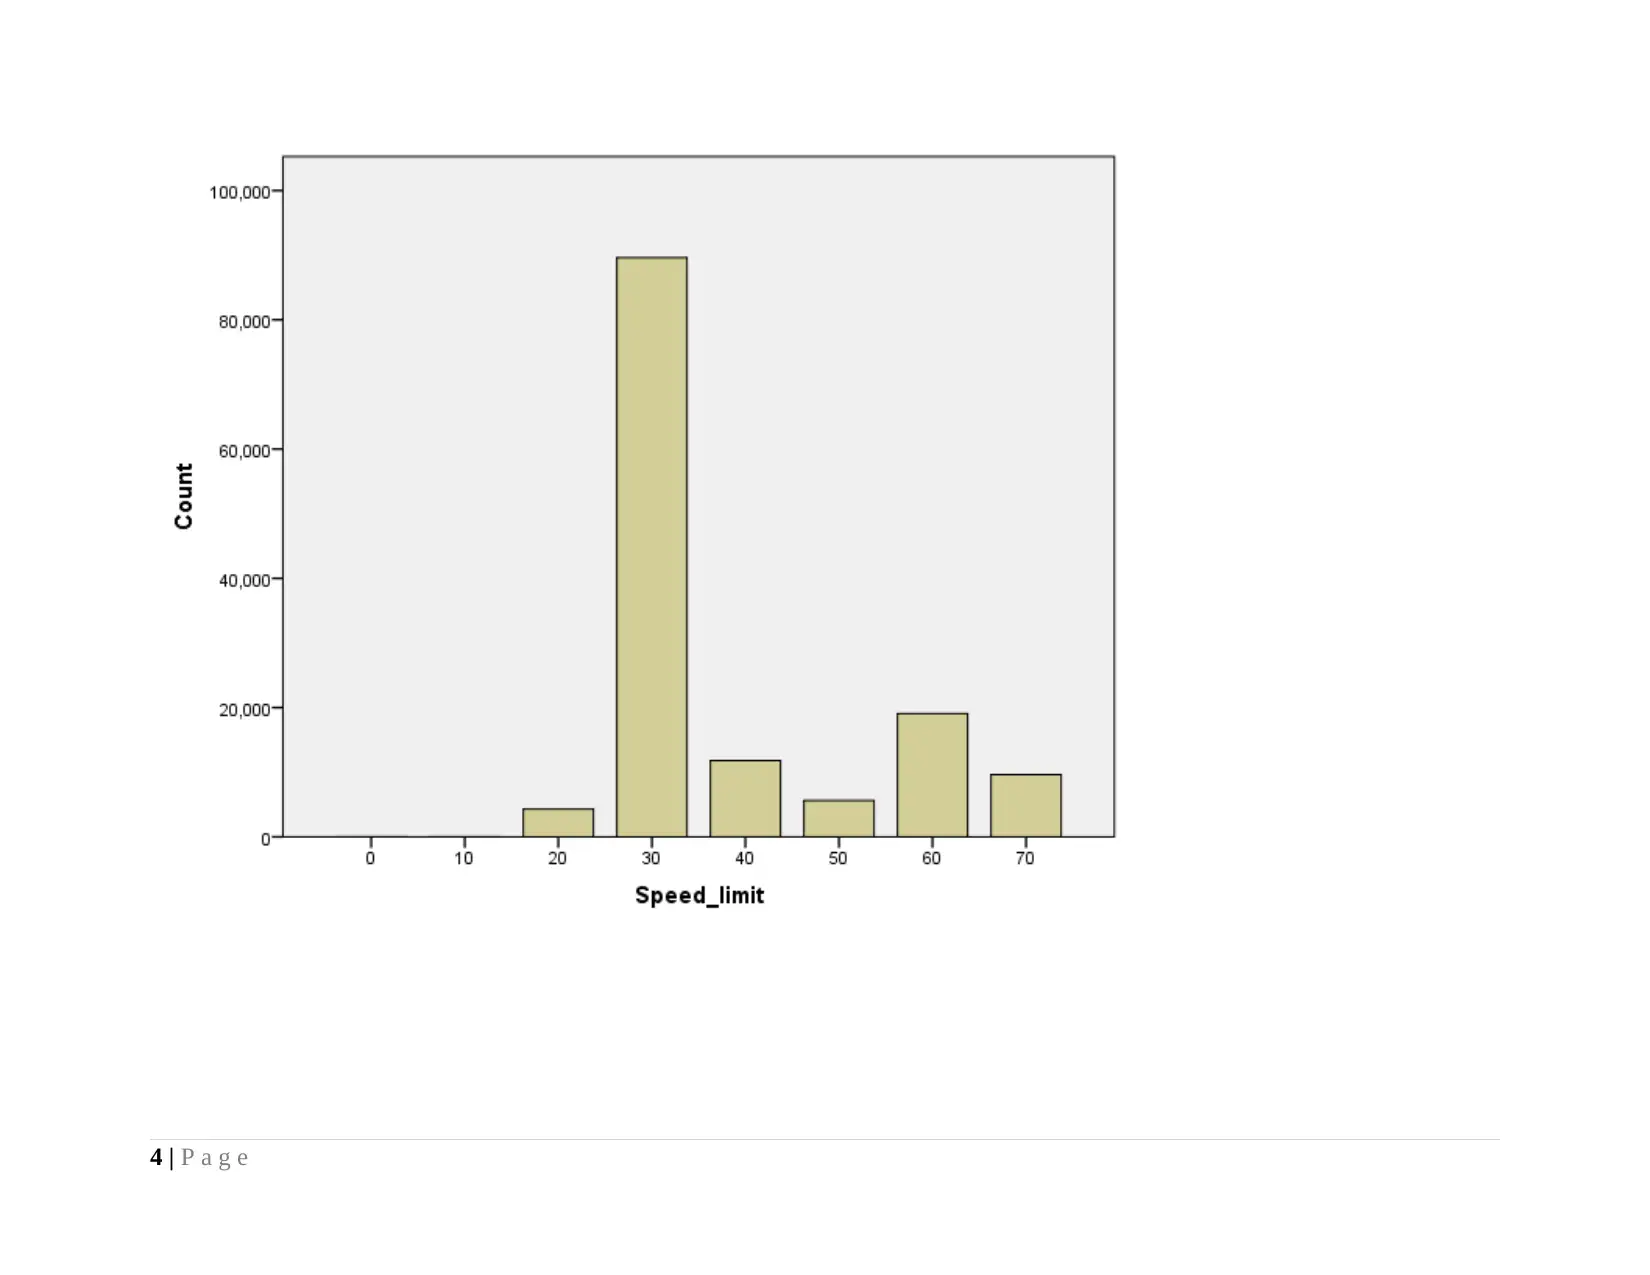
30 89627 64.0 64.0 67.1
40 11804 8.4 8.4 75.5
50 5625 4.0 4.0 79.5
60 19081 13.6 13.6 93.1
70 9626 6.9 6.9 100.0
Total 140056 100.0 100.0
3 | P a g e
40 11804 8.4 8.4 75.5
50 5625 4.0 4.0 79.5
60 19081 13.6 13.6 93.1
70 9626 6.9 6.9 100.0
Total 140056 100.0 100.0
3 | P a g e
4 | P a g e
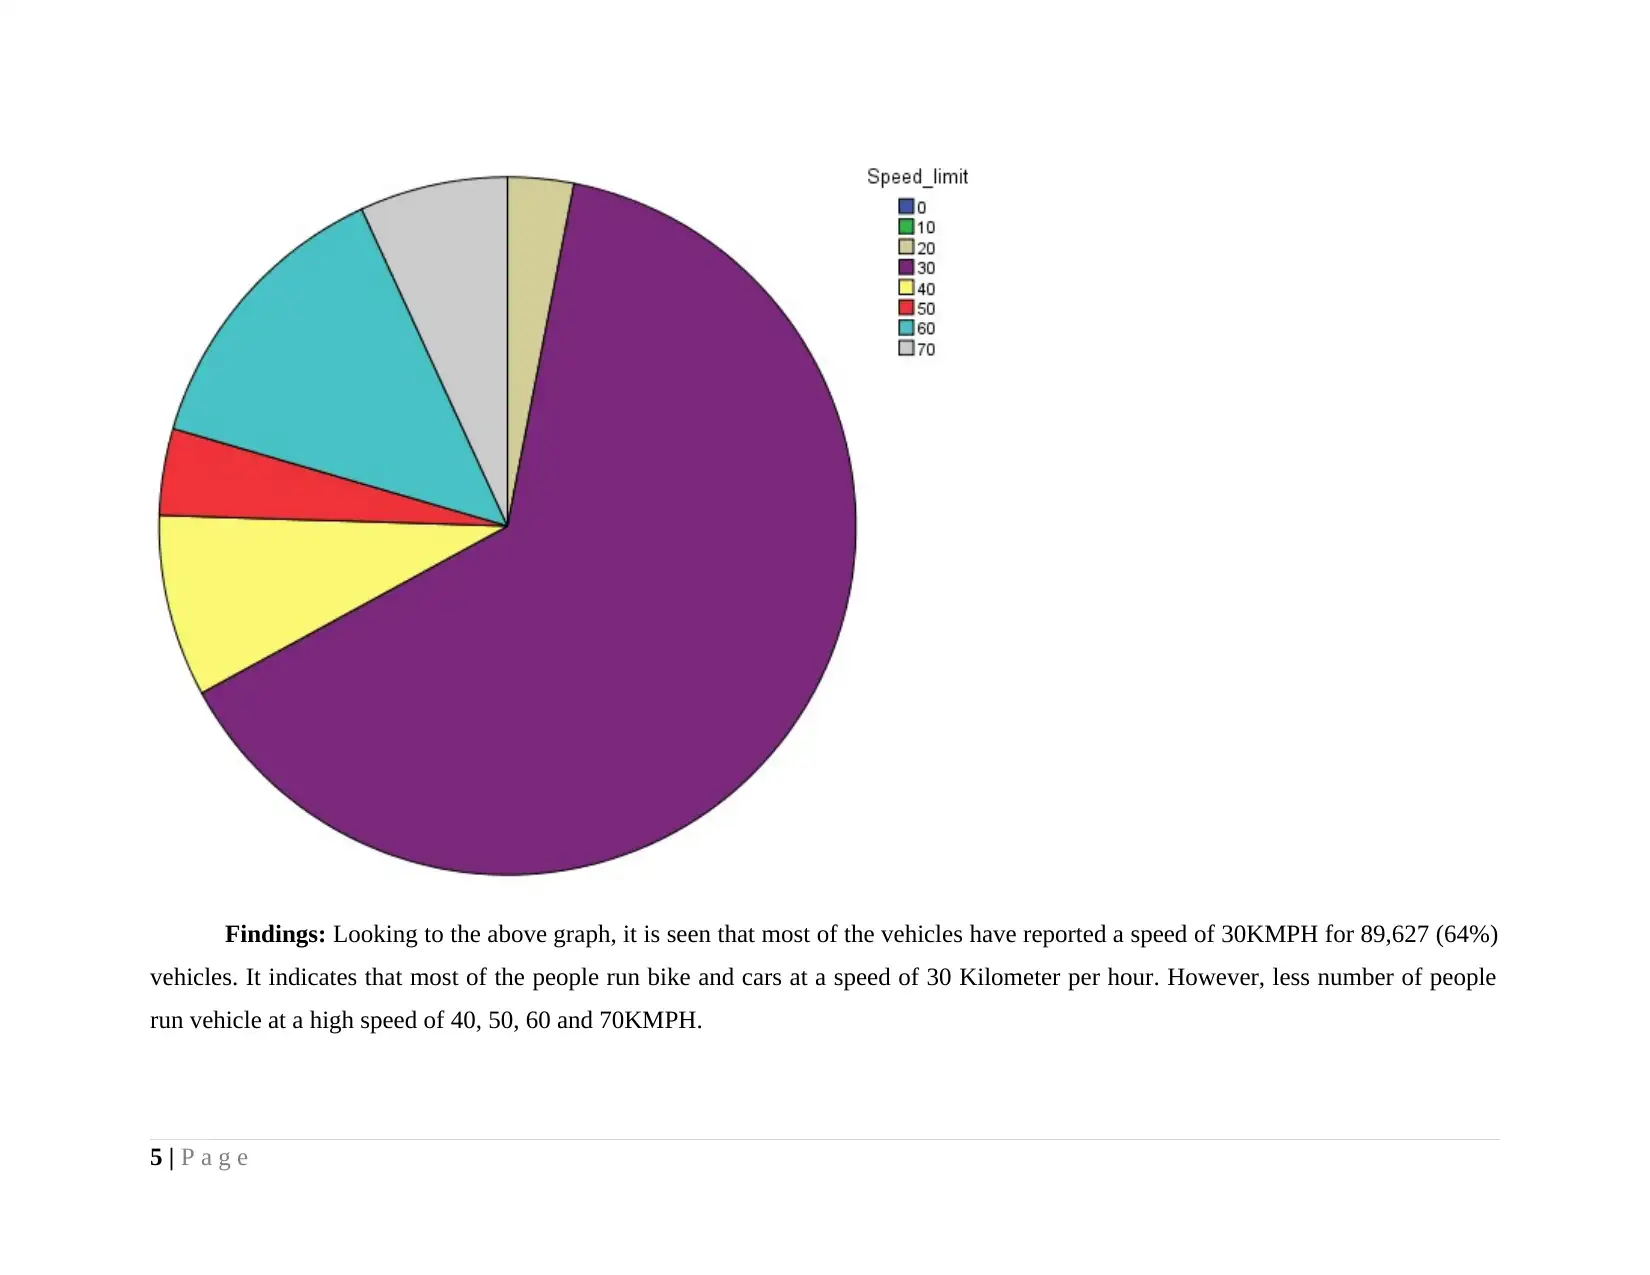
Findings: Looking to the above graph, it is seen that most of the vehicles have reported a speed of 30KMPH for 89,627 (64%)
vehicles. It indicates that most of the people run bike and cars at a speed of 30 Kilometer per hour. However, less number of people
run vehicle at a high speed of 40, 50, 60 and 70KMPH.
5 | P a g e
vehicles. It indicates that most of the people run bike and cars at a speed of 30 Kilometer per hour. However, less number of people
run vehicle at a high speed of 40, 50, 60 and 70KMPH.
5 | P a g e
Paraphrase This Document
Need a fresh take? Get an instant paraphrase of this document with our AI Paraphraser
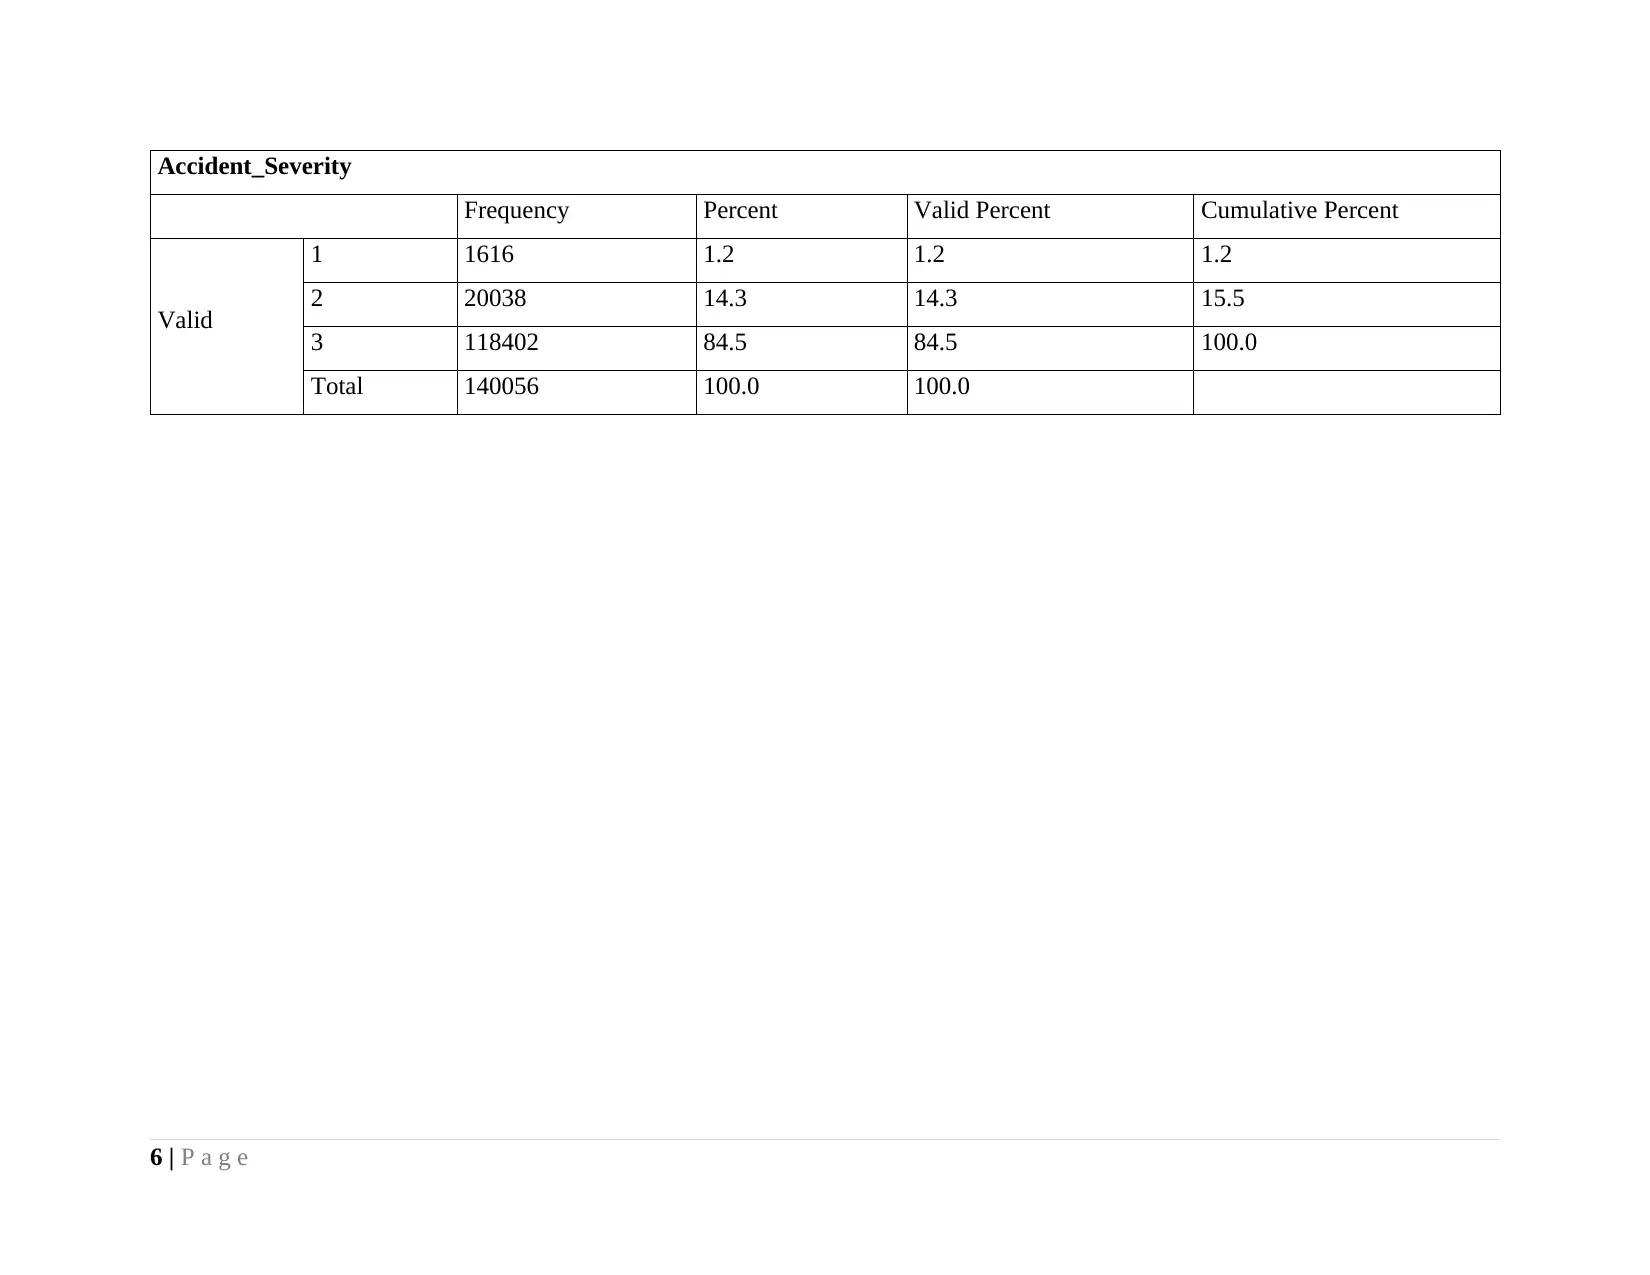
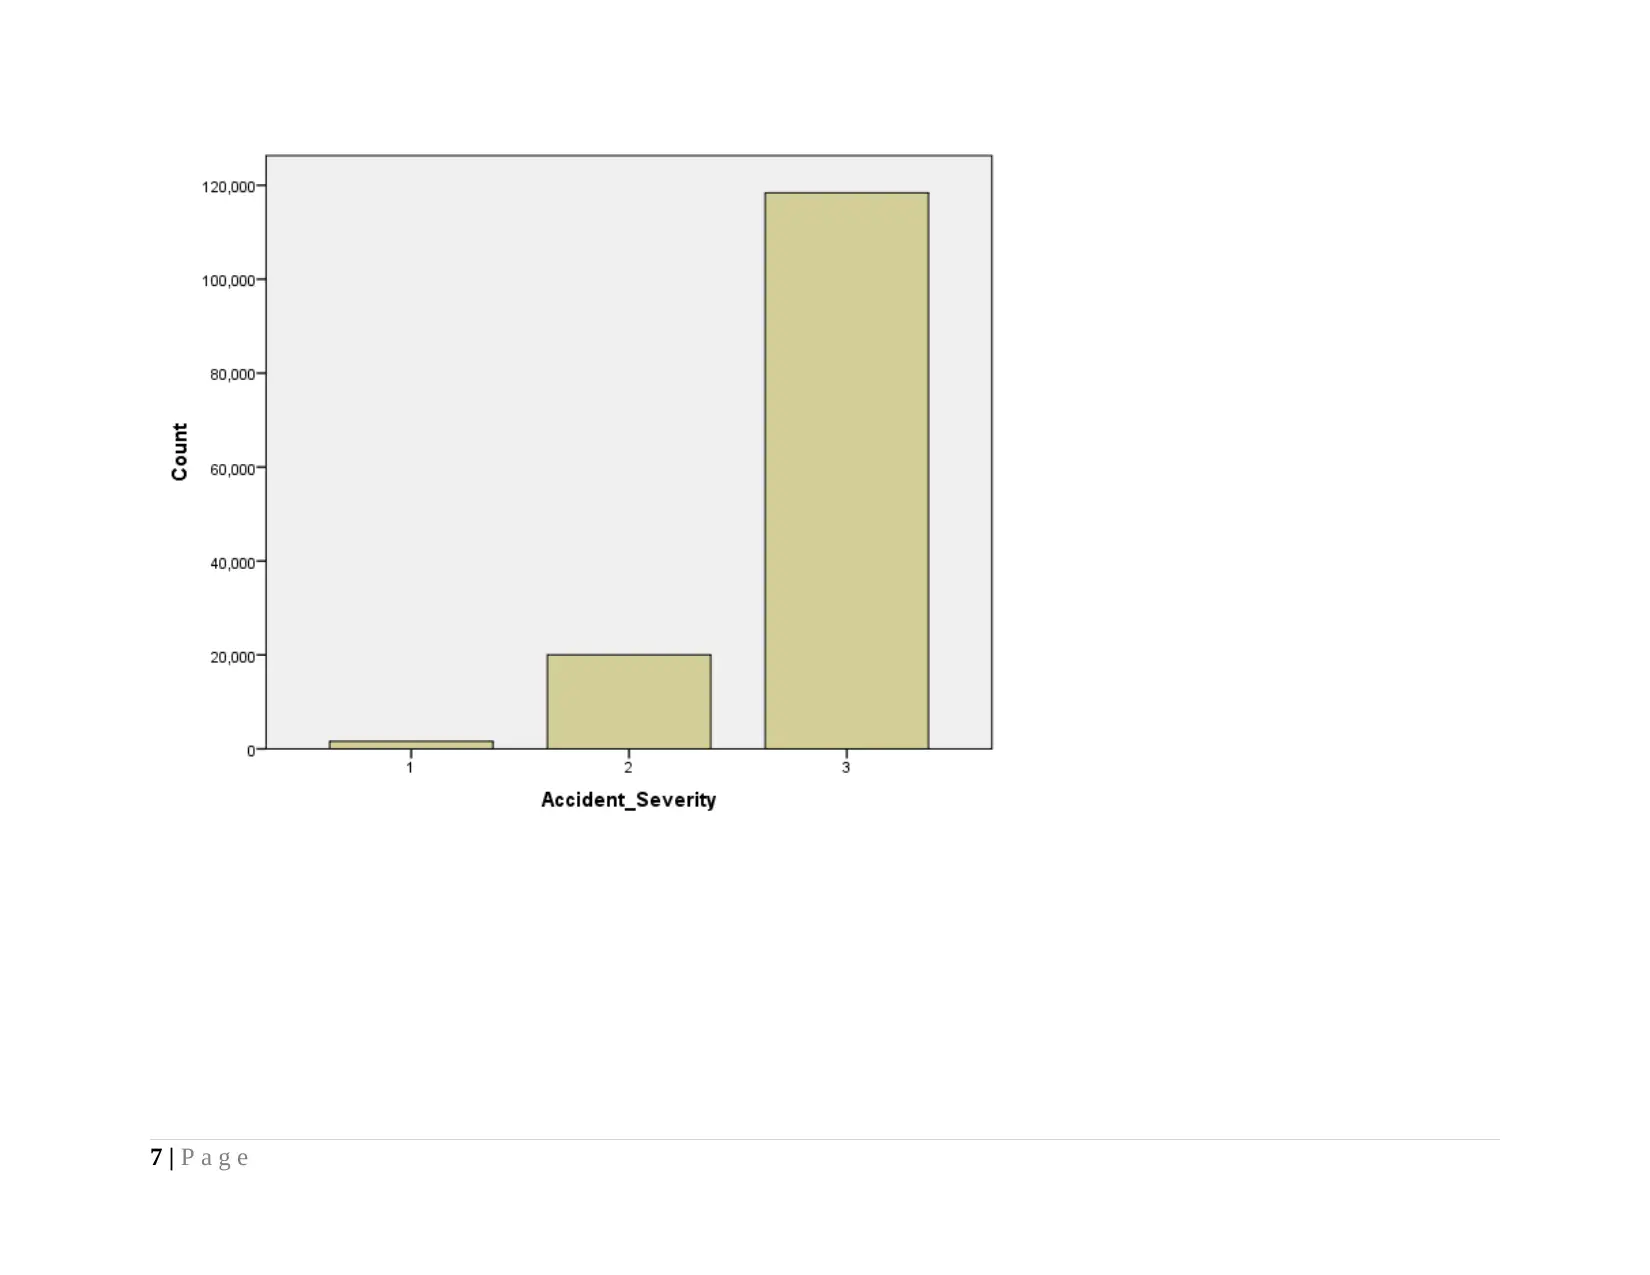
Accident_Severity
Frequency Percent Valid Percent Cumulative Percent
Valid
1 1616 1.2 1.2 1.2
2 20038 14.3 14.3 15.5
3 118402 84.5 84.5 100.0
Total 140056 100.0 100.0
6 | P a g e
Frequency Percent Valid Percent Cumulative Percent
Valid
1 1616 1.2 1.2 1.2
2 20038 14.3 14.3 15.5
3 118402 84.5 84.5 100.0
Total 140056 100.0 100.0
6 | P a g e
7 | P a g e
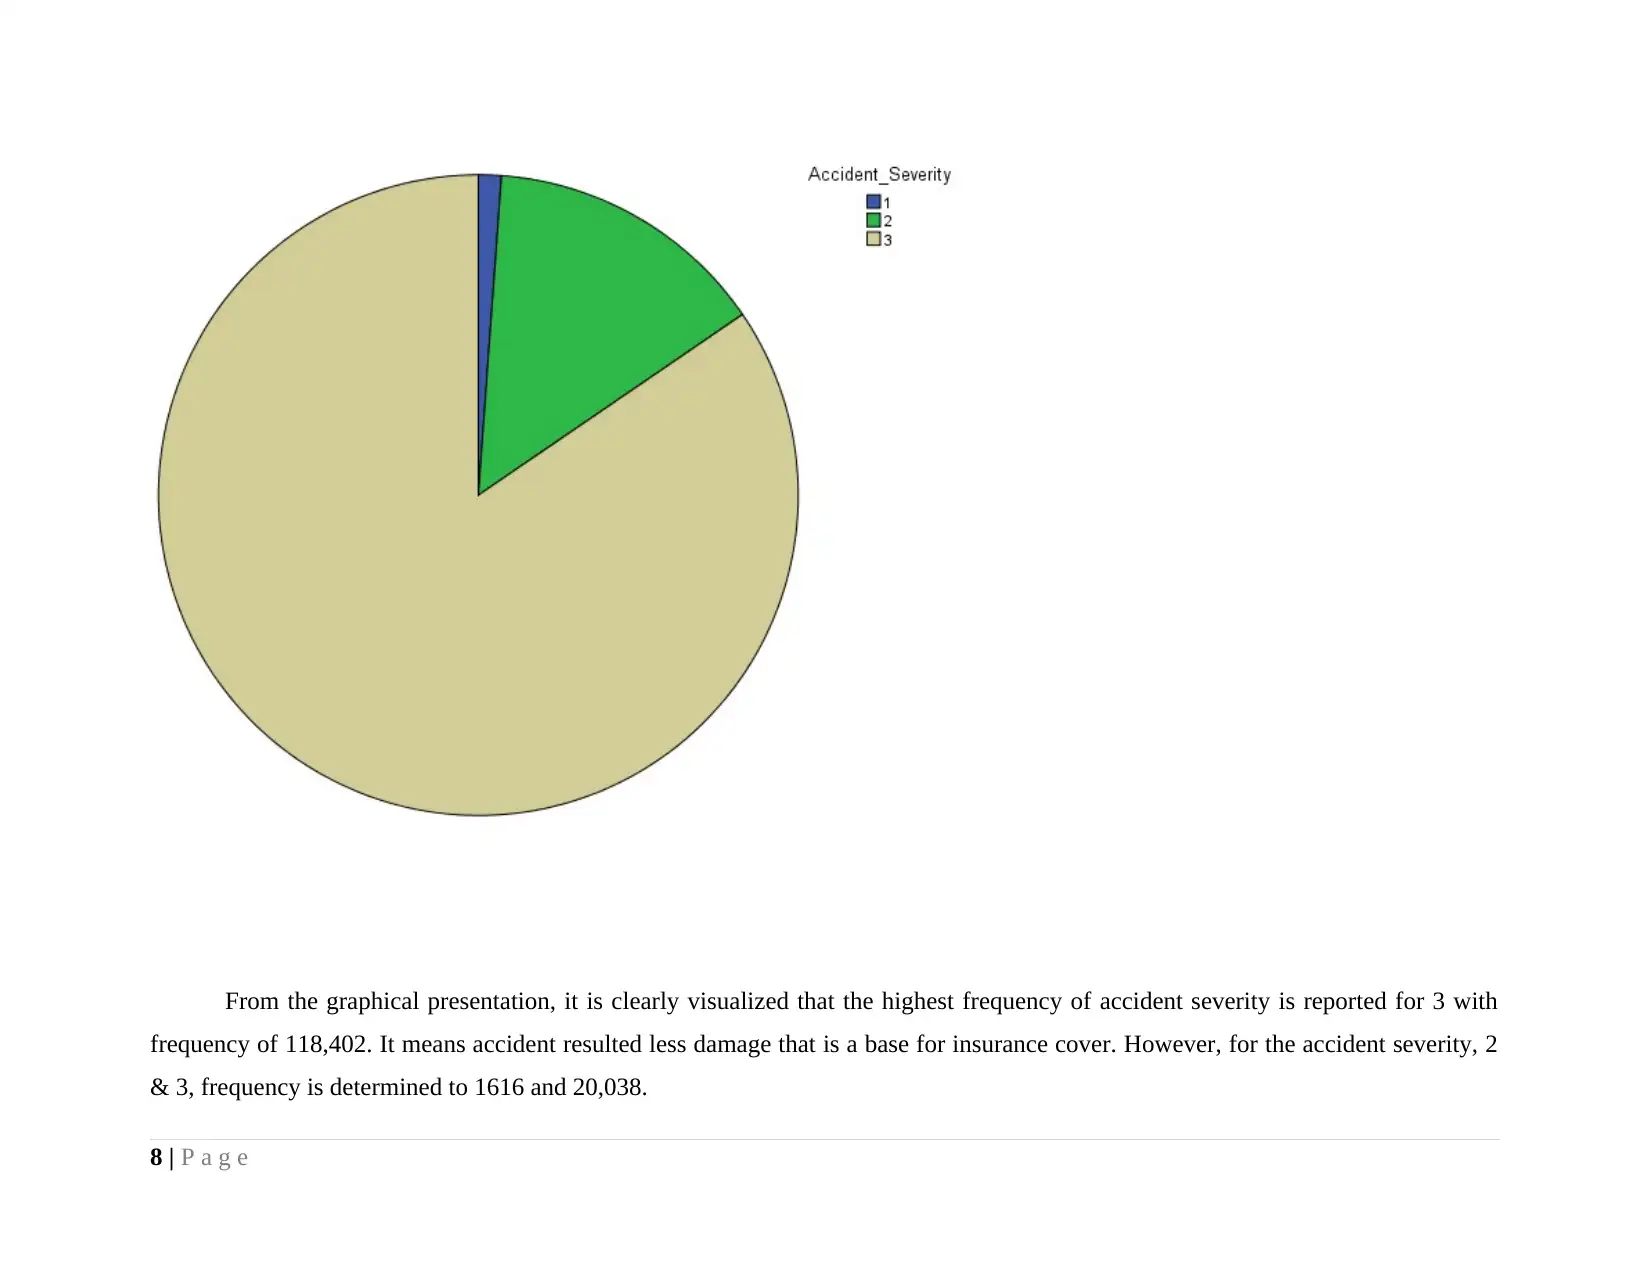
From the graphical presentation, it is clearly visualized that the highest frequency of accident severity is reported for 3 with
frequency of 118,402. It means accident resulted less damage that is a base for insurance cover. However, for the accident severity, 2
& 3, frequency is determined to 1616 and 20,038.
8 | P a g e
frequency of 118,402. It means accident resulted less damage that is a base for insurance cover. However, for the accident severity, 2
& 3, frequency is determined to 1616 and 20,038.
8 | P a g e
Secure Best Marks with AI Grader
Need help grading? Try our AI Grader for instant feedback on your assignments.
9 | P a g e

10 | P a g e
11 | P a g e
Paraphrase This Document
Need a fresh take? Get an instant paraphrase of this document with our AI Paraphraser
12 | P a g e
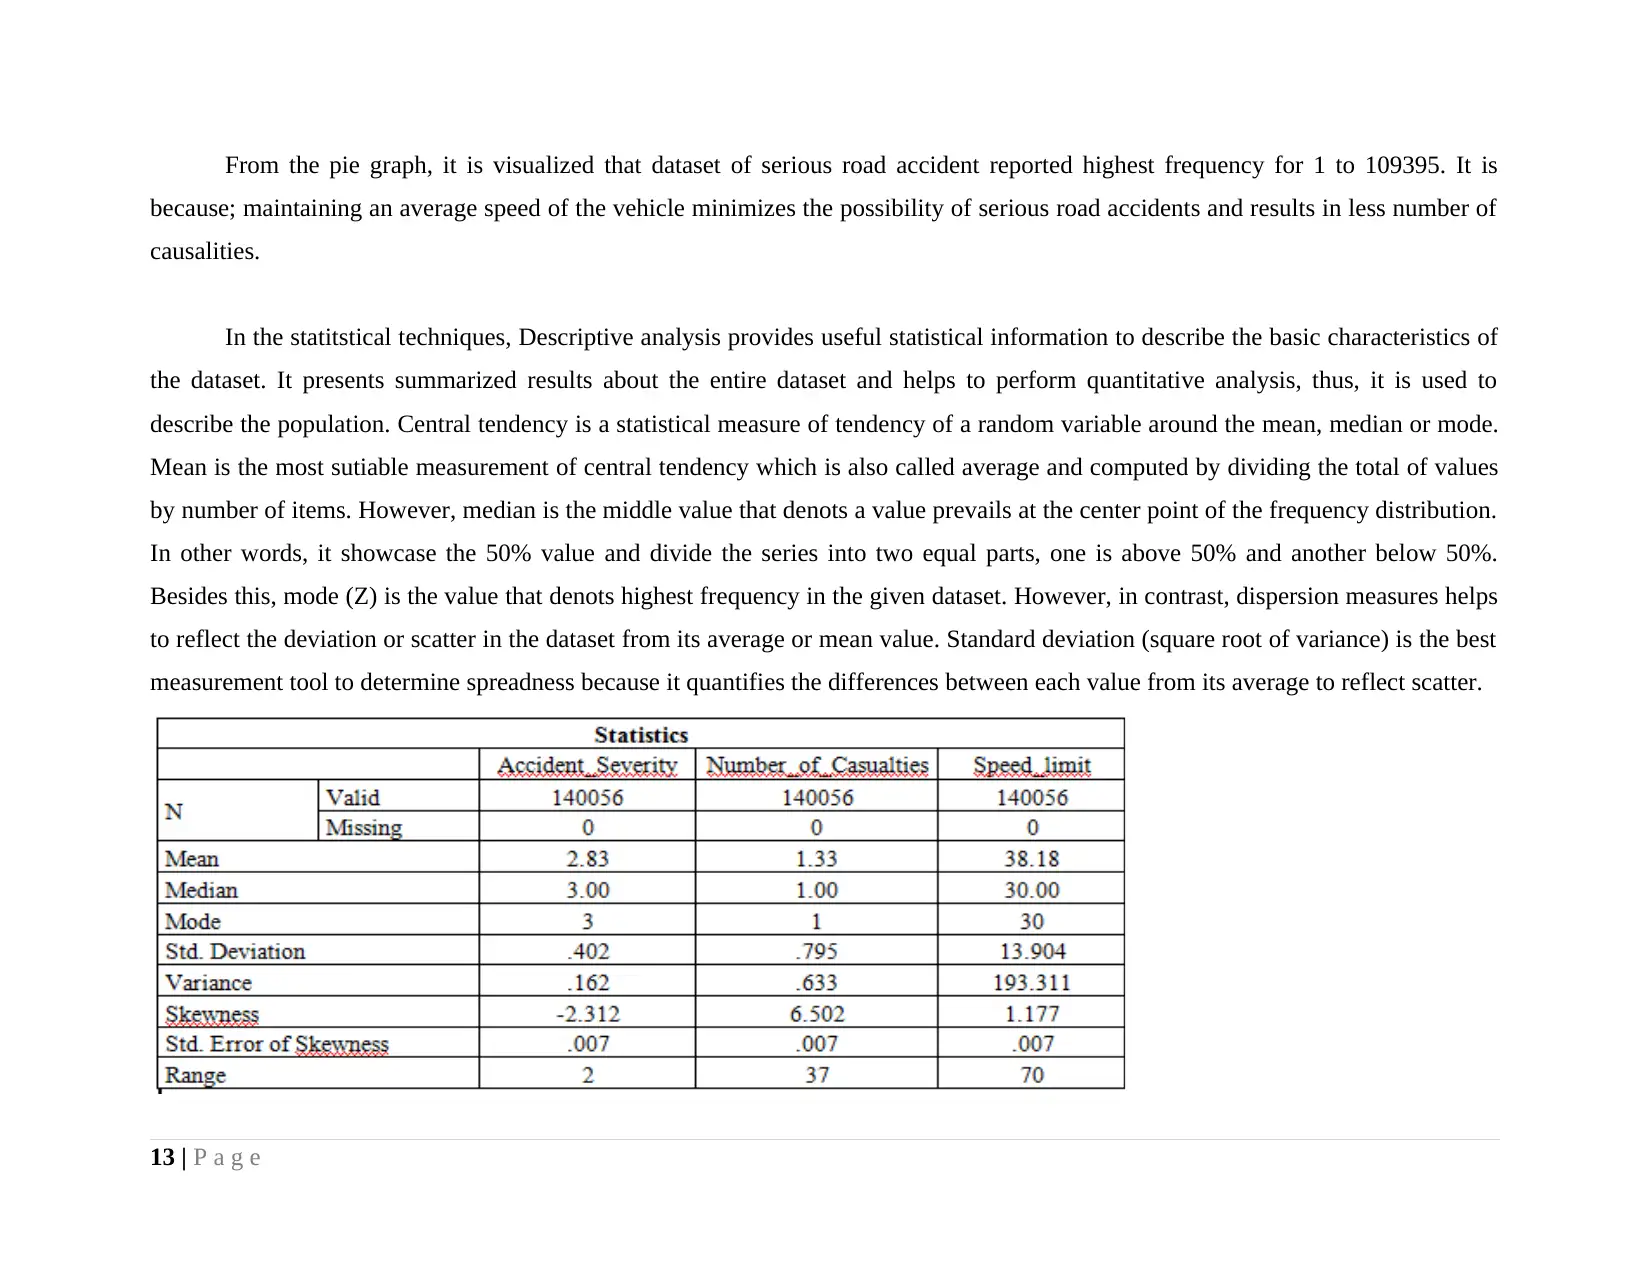
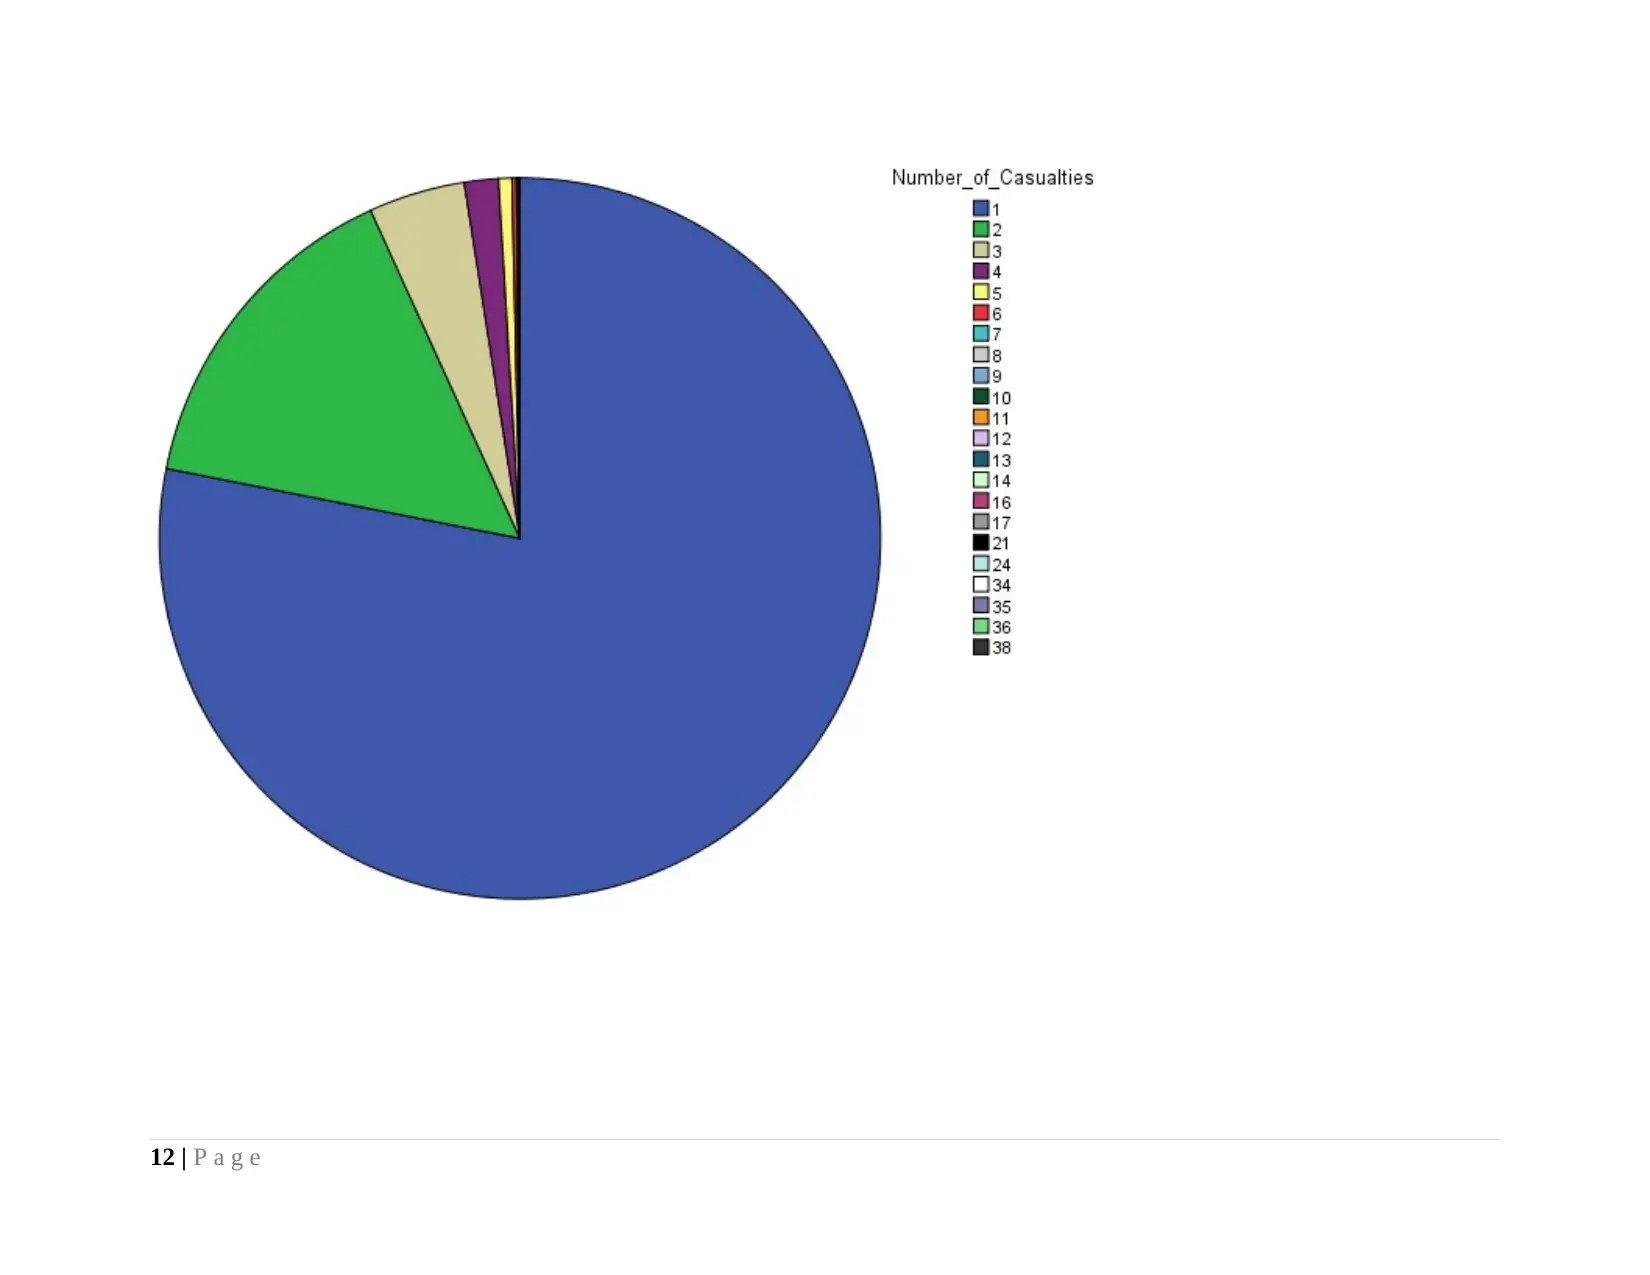
From the pie graph, it is visualized that dataset of serious road accident reported highest frequency for 1 to 109395. It is
because; maintaining an average speed of the vehicle minimizes the possibility of serious road accidents and results in less number of
causalities.
In the statitstical techniques, Descriptive analysis provides useful statistical information to describe the basic characteristics of
the dataset. It presents summarized results about the entire dataset and helps to perform quantitative analysis, thus, it is used to
describe the population. Central tendency is a statistical measure of tendency of a random variable around the mean, median or mode.
Mean is the most sutiable measurement of central tendency which is also called average and computed by dividing the total of values
by number of items. However, median is the middle value that denots a value prevails at the center point of the frequency distribution.
In other words, it showcase the 50% value and divide the series into two equal parts, one is above 50% and another below 50%.
Besides this, mode (Z) is the value that denots highest frequency in the given dataset. However, in contrast, dispersion measures helps
to reflect the deviation or scatter in the dataset from its average or mean value. Standard deviation (square root of variance) is the best
measurement tool to determine spreadness because it quantifies the differences between each value from its average to reflect scatter.
13 | P a g e
In the given data set, the results of descriptive statistics for the data series, accident severity indicates that an average of 2.83
near to 3 that indicates that the possibility of damage as a result of accident is low. However, median & mode of the severity score is
founded to 3. However, on the other note, average number of casualities have been determined to 1.33 and median & mode has been
determined to 1. Speed limit results reflects that average speed of the vehicle is 38.18 kilometer per hour and median & mode score is
identified to 30 KMPH. The results clearly demonstrated that by running vehicle at an average speed, possibility of serious accident
can be minimized or vice-versa. Looking to the result of standard deviation, it is observed that S.D is founded highest for the speed
limit to 13.904 however, for number of causalities and accident severity, it is reported comparatively less to 0.40 and 0.795
respectively. The results clearly presented that speed limit shows greater level of spreadness from the average limit of 38.18
Kilometer. Range is the simplest measurement tool of dispersion which just quantifies the differnce between maximum and minimum
value. It is founded highest for the speed limit dataset to 70, in contrast, range score for the accident severity and casualities have been
founded to 2 and 37 respectively.
3. Check the data quality and preparation of data quality report for the model
Data quality check is the one of the important stage of the process that is followed for application of data mining techniques.
This is because these approches can geenrate releavnt results only when data quality is of appropriate manner. There are some areas on
which focus need to be done in order to ensure that data of good quality is used for application of data mining methods. As per rules
there must not be any outliers in the data set. Outliers basically refers to numbers that originae out of trend in data set. These outliers
does not enable data scientist to make reliable prediction on the basis of training data set. Hence, it is very importan to ensure that
outliers are removed from data set. In the current data that is taken for analysis purpose there are no outliers as boxplot diagram is
generted and no outliers are detected in same. Apart from this, it is also very important to identify missing values if there are any in
data set. Missing values simply refers to the situation where in specific cell that is in data set there is no value. In case there is any
missing value same is removed by using mode value of the variable. In current data set that is taken in to account for analysis purpose
there are no missing values and this reveal that data quality is goodWhile performing data mining methods and tools, it is really
14 | P a g e
Secure Best Marks with AI Grader
Need help grading? Try our AI Grader for instant feedback on your assignments.
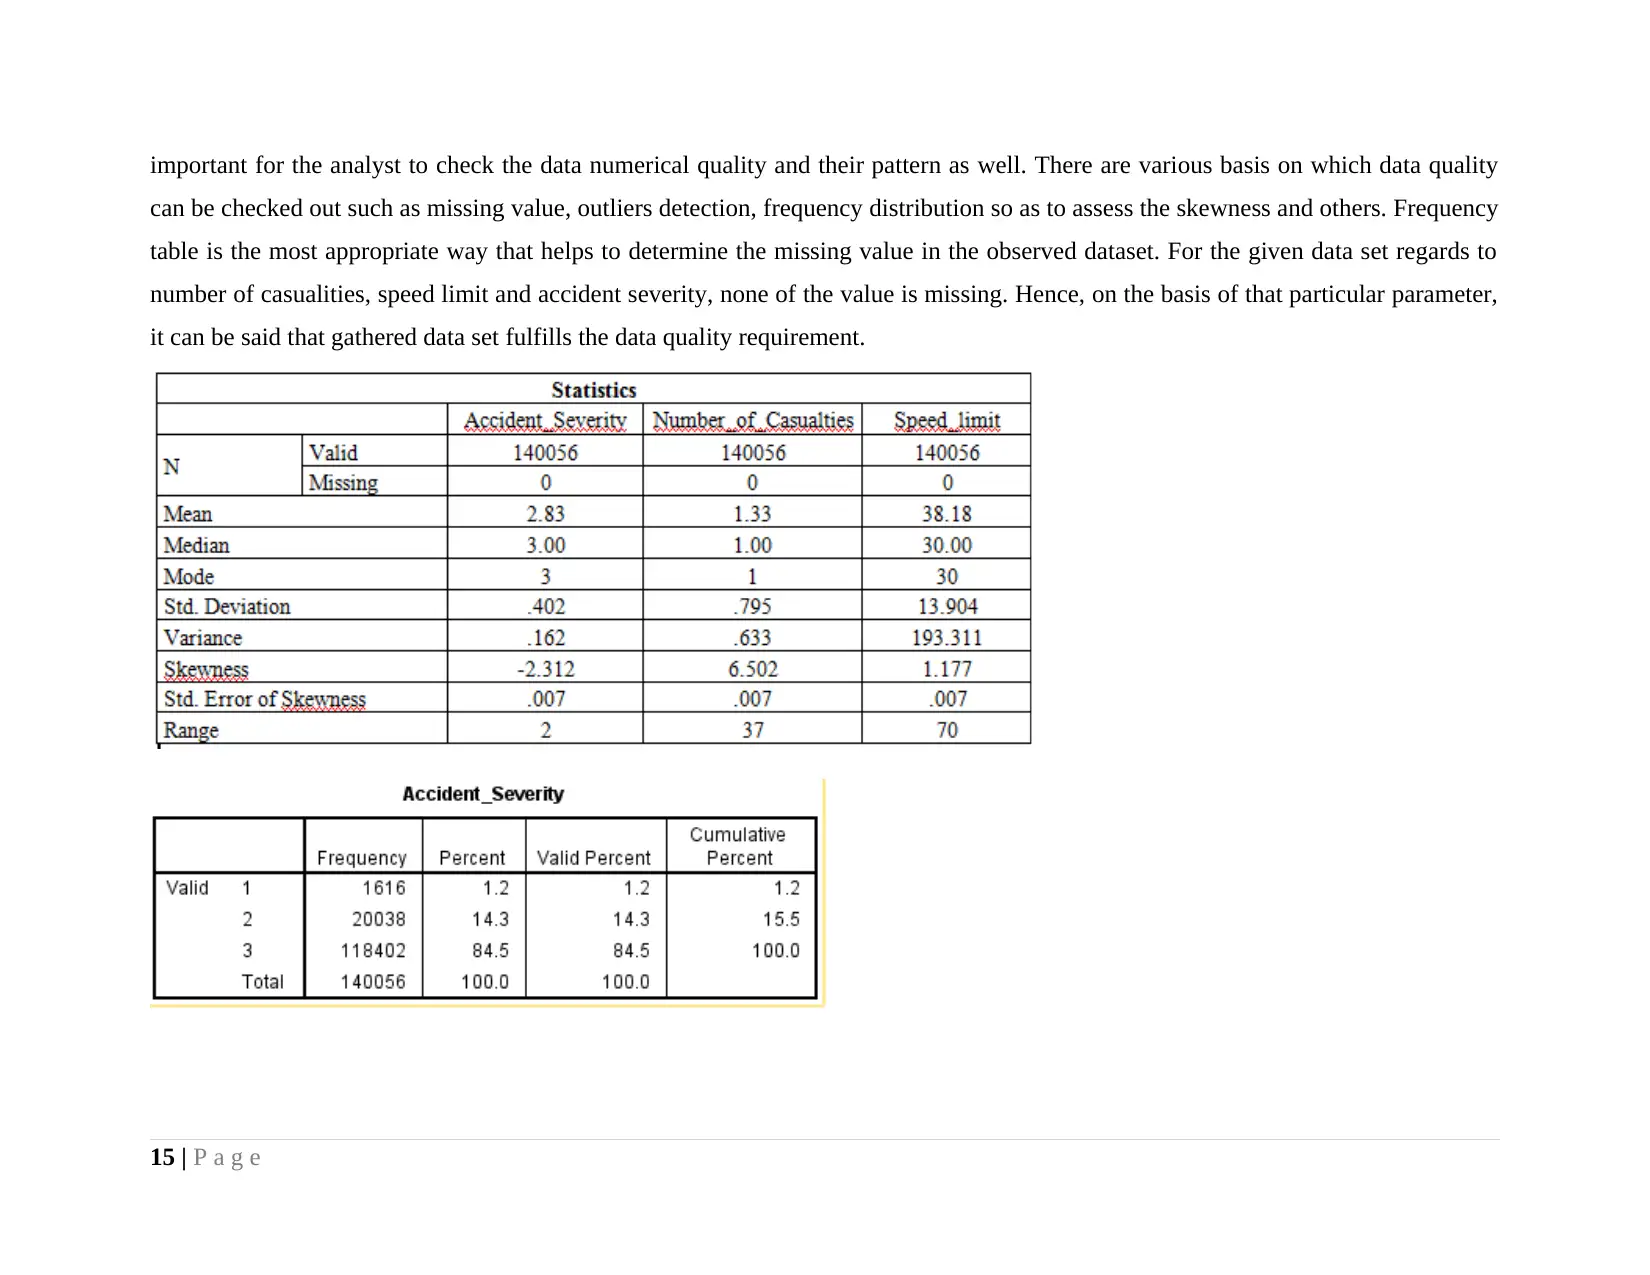
important for the analyst to check the data numerical quality and their pattern as well. There are various basis on which data quality
can be checked out such as missing value, outliers detection, frequency distribution so as to assess the skewness and others. Frequency
table is the most appropriate way that helps to determine the missing value in the observed dataset. For the given data set regards to
number of casualities, speed limit and accident severity, none of the value is missing. Hence, on the basis of that particular parameter,
it can be said that gathered data set fulfills the data quality requirement.
15 | P a g e
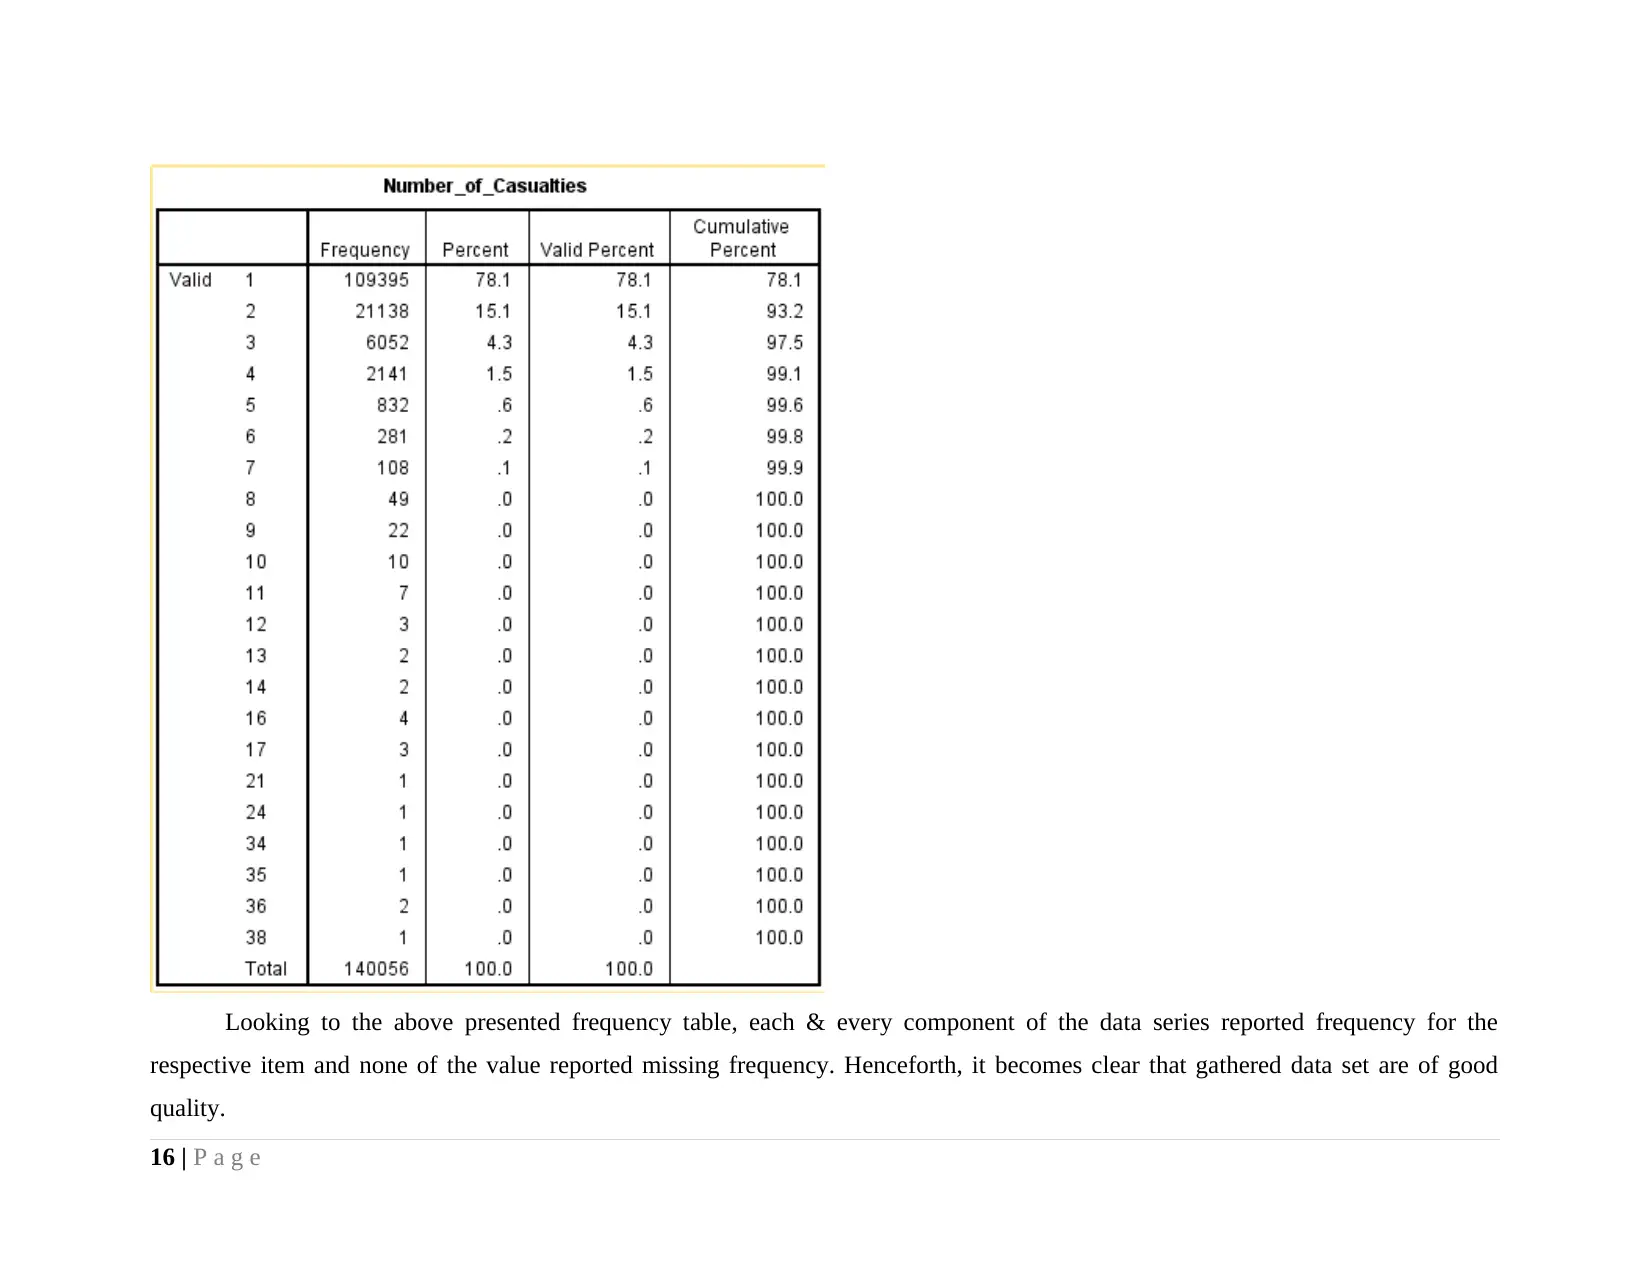
Looking to the above presented frequency table, each & every component of the data series reported frequency for the
respective item and none of the value reported missing frequency. Henceforth, it becomes clear that gathered data set are of good
quality.
16 | P a g e
respective item and none of the value reported missing frequency. Henceforth, it becomes clear that gathered data set are of good
quality.
16 | P a g e
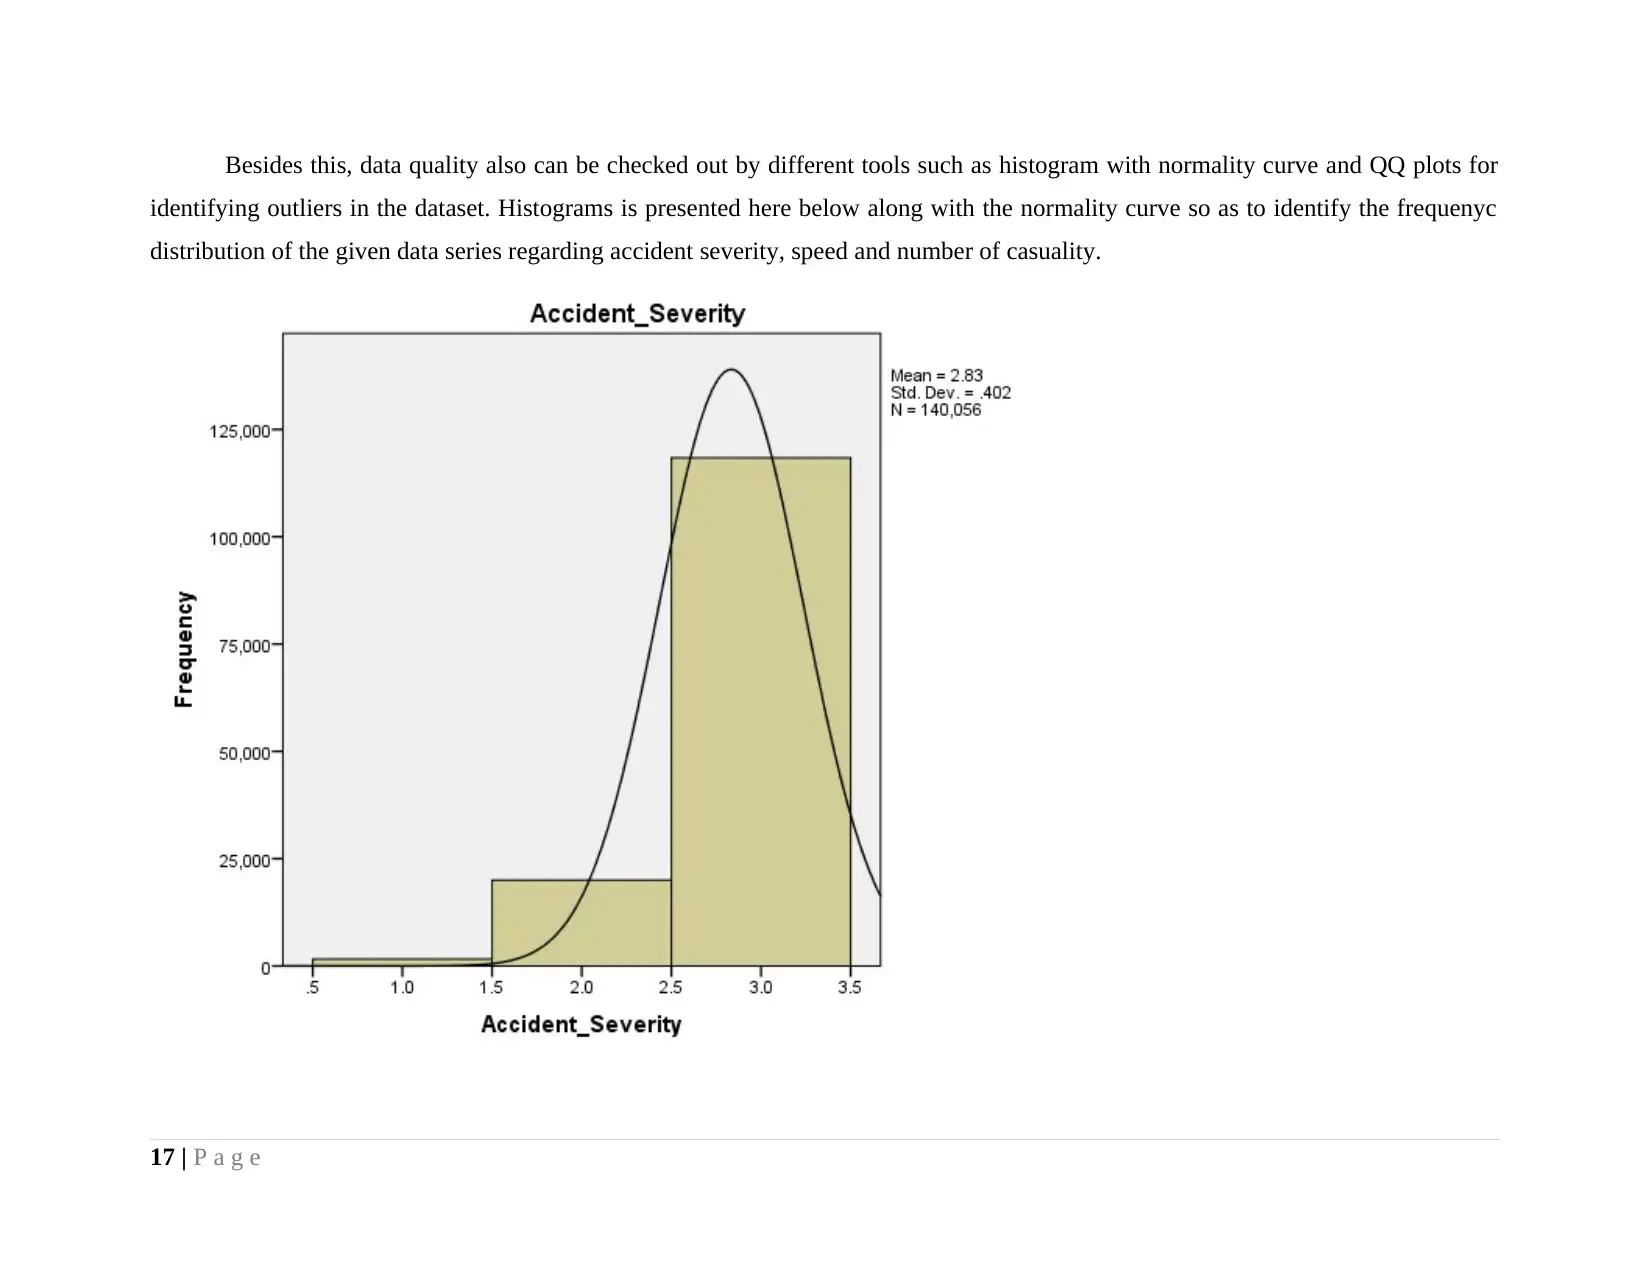
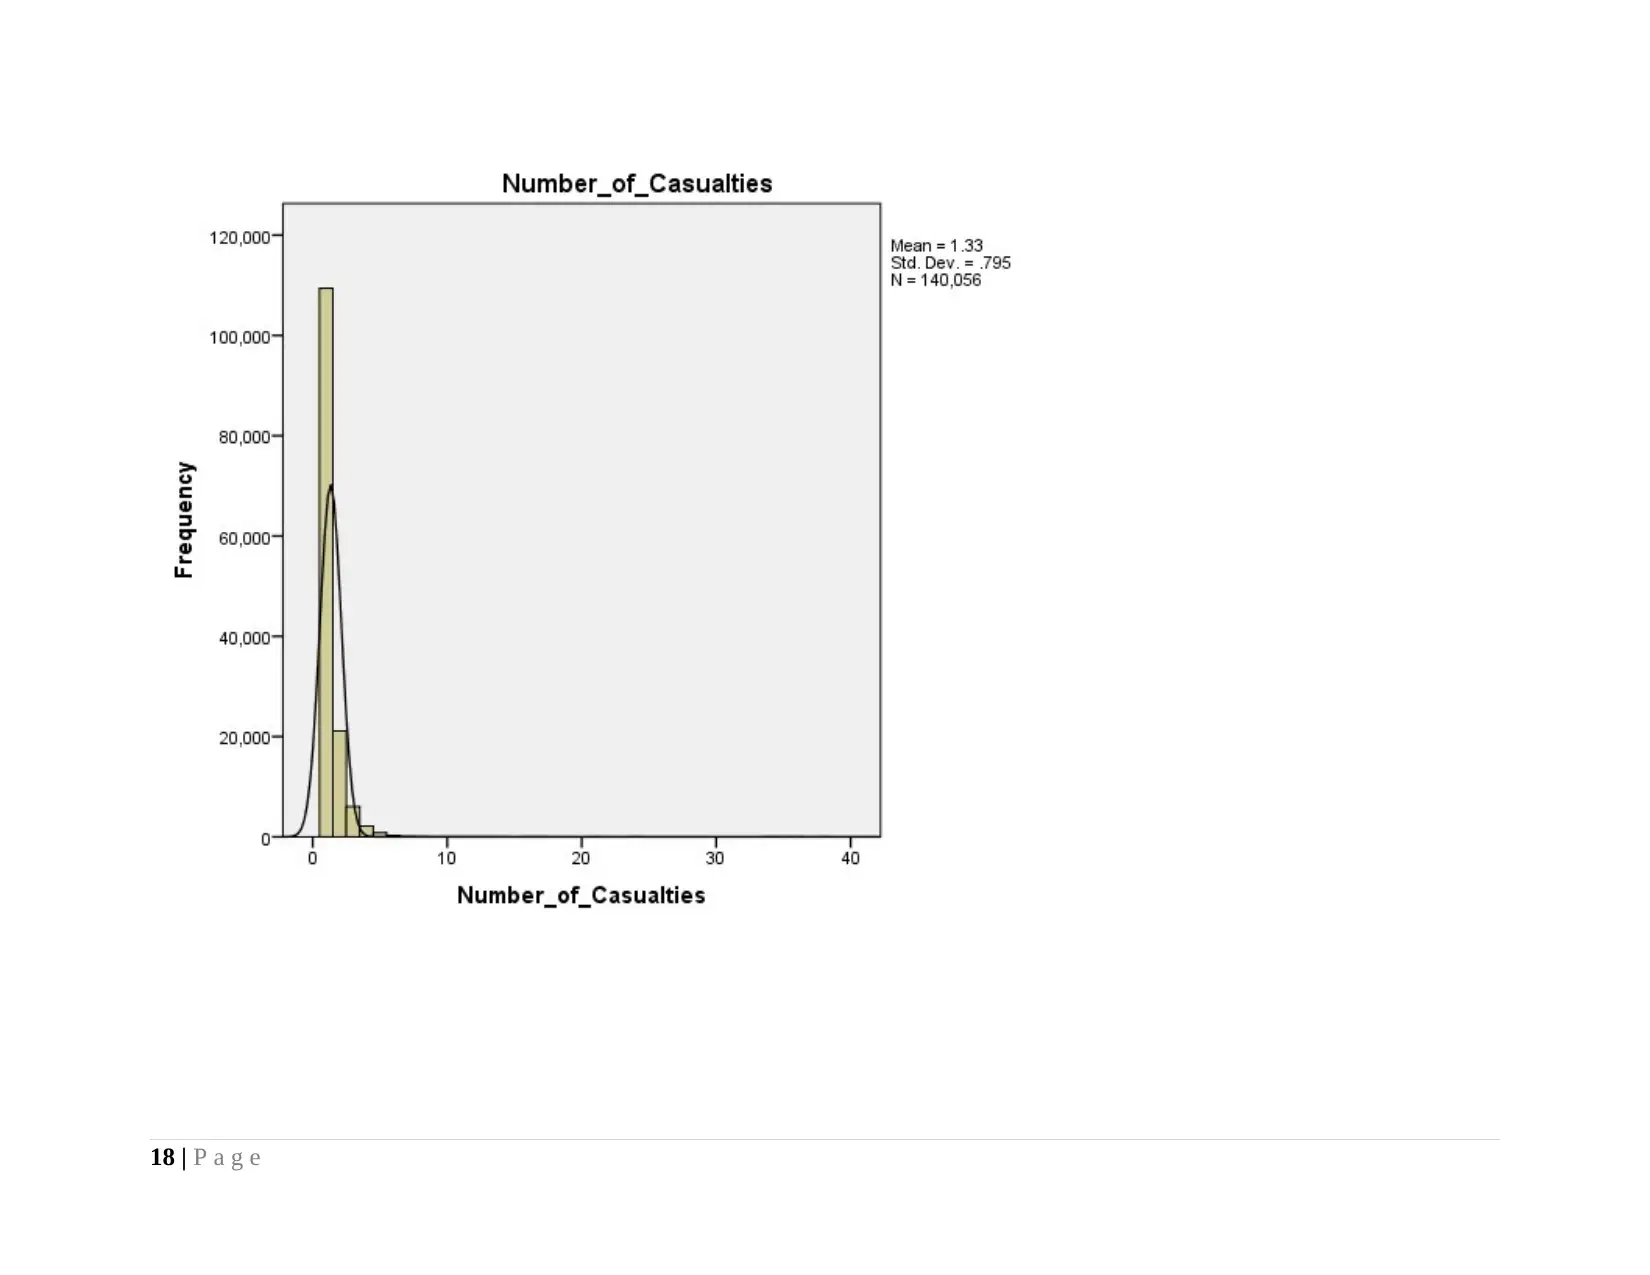
Besides this, data quality also can be checked out by different tools such as histogram with normality curve and QQ plots for
identifying outliers in the dataset. Histograms is presented here below along with the normality curve so as to identify the frequenyc
distribution of the given data series regarding accident severity, speed and number of casuality.
17 | P a g e
identifying outliers in the dataset. Histograms is presented here below along with the normality curve so as to identify the frequenyc
distribution of the given data series regarding accident severity, speed and number of casuality.
17 | P a g e
Paraphrase This Document
Need a fresh take? Get an instant paraphrase of this document with our AI Paraphraser
18 | P a g e
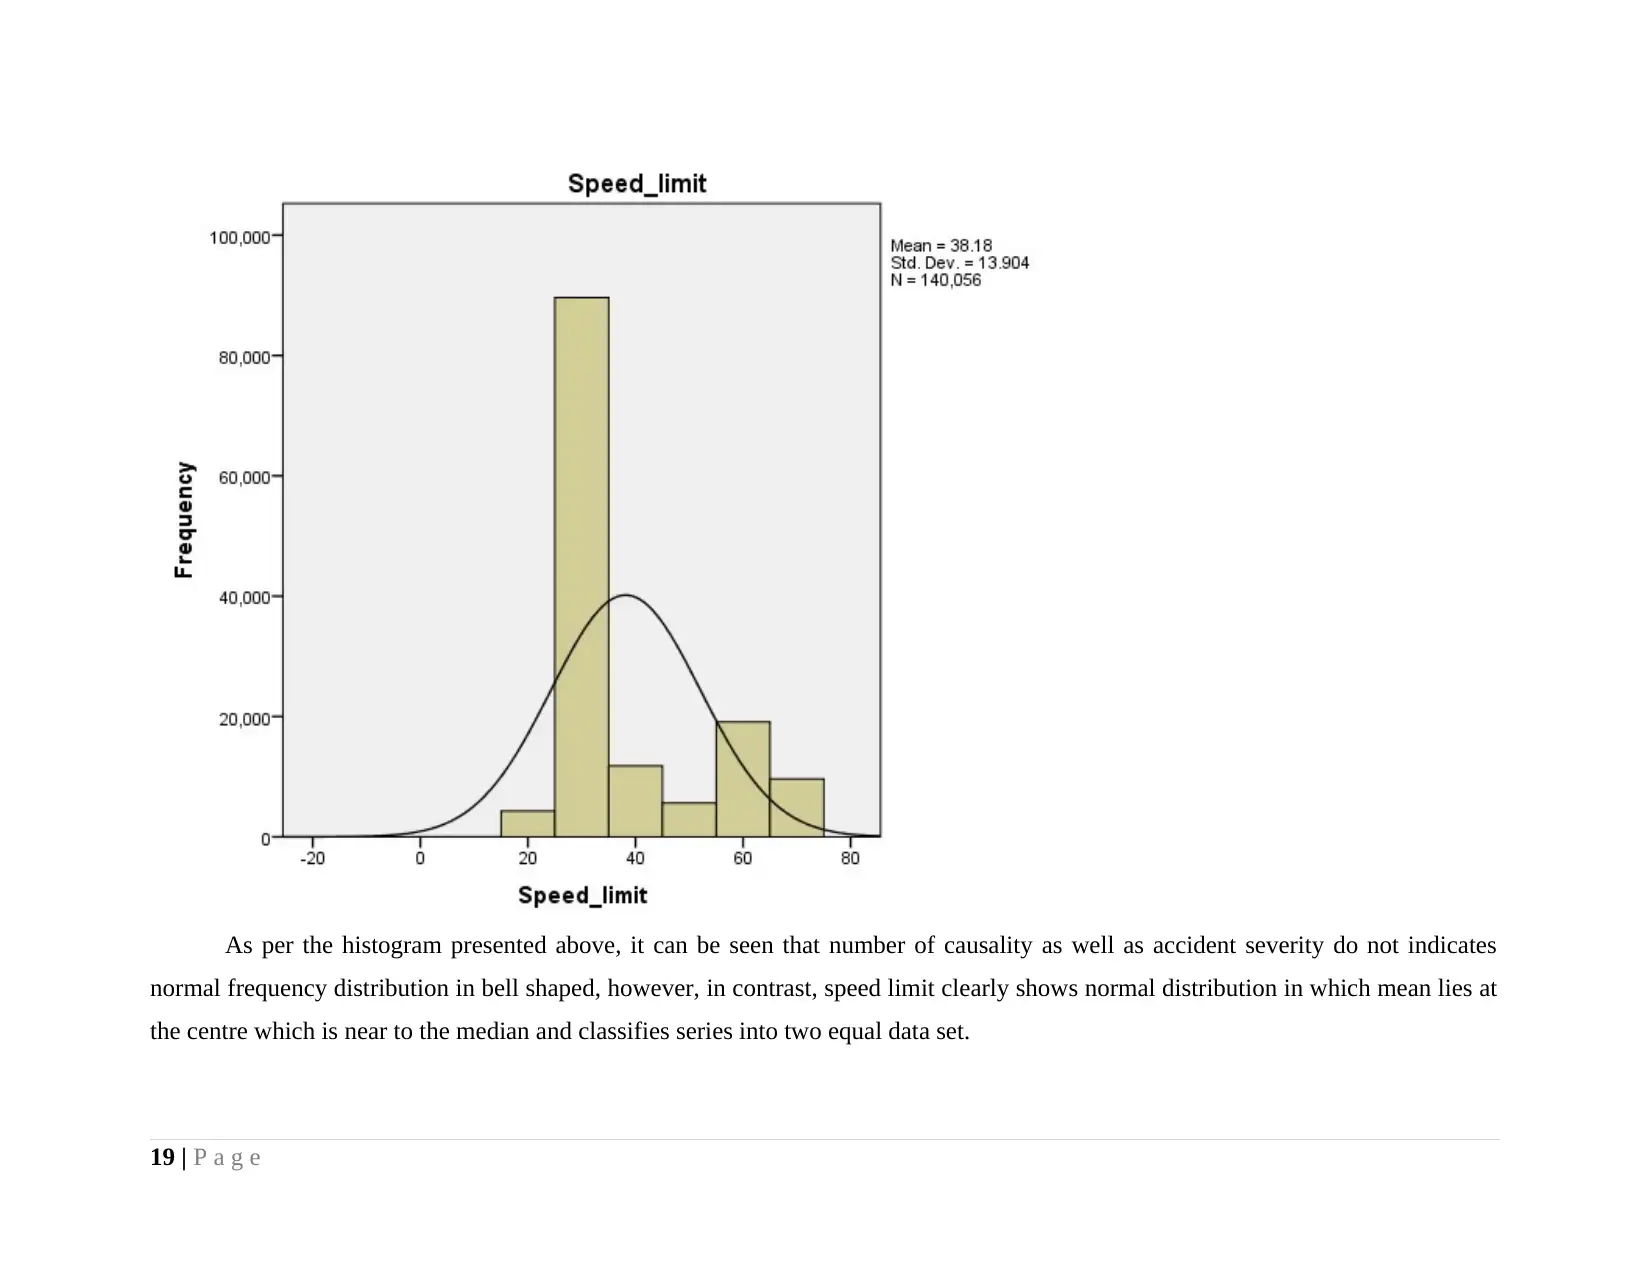
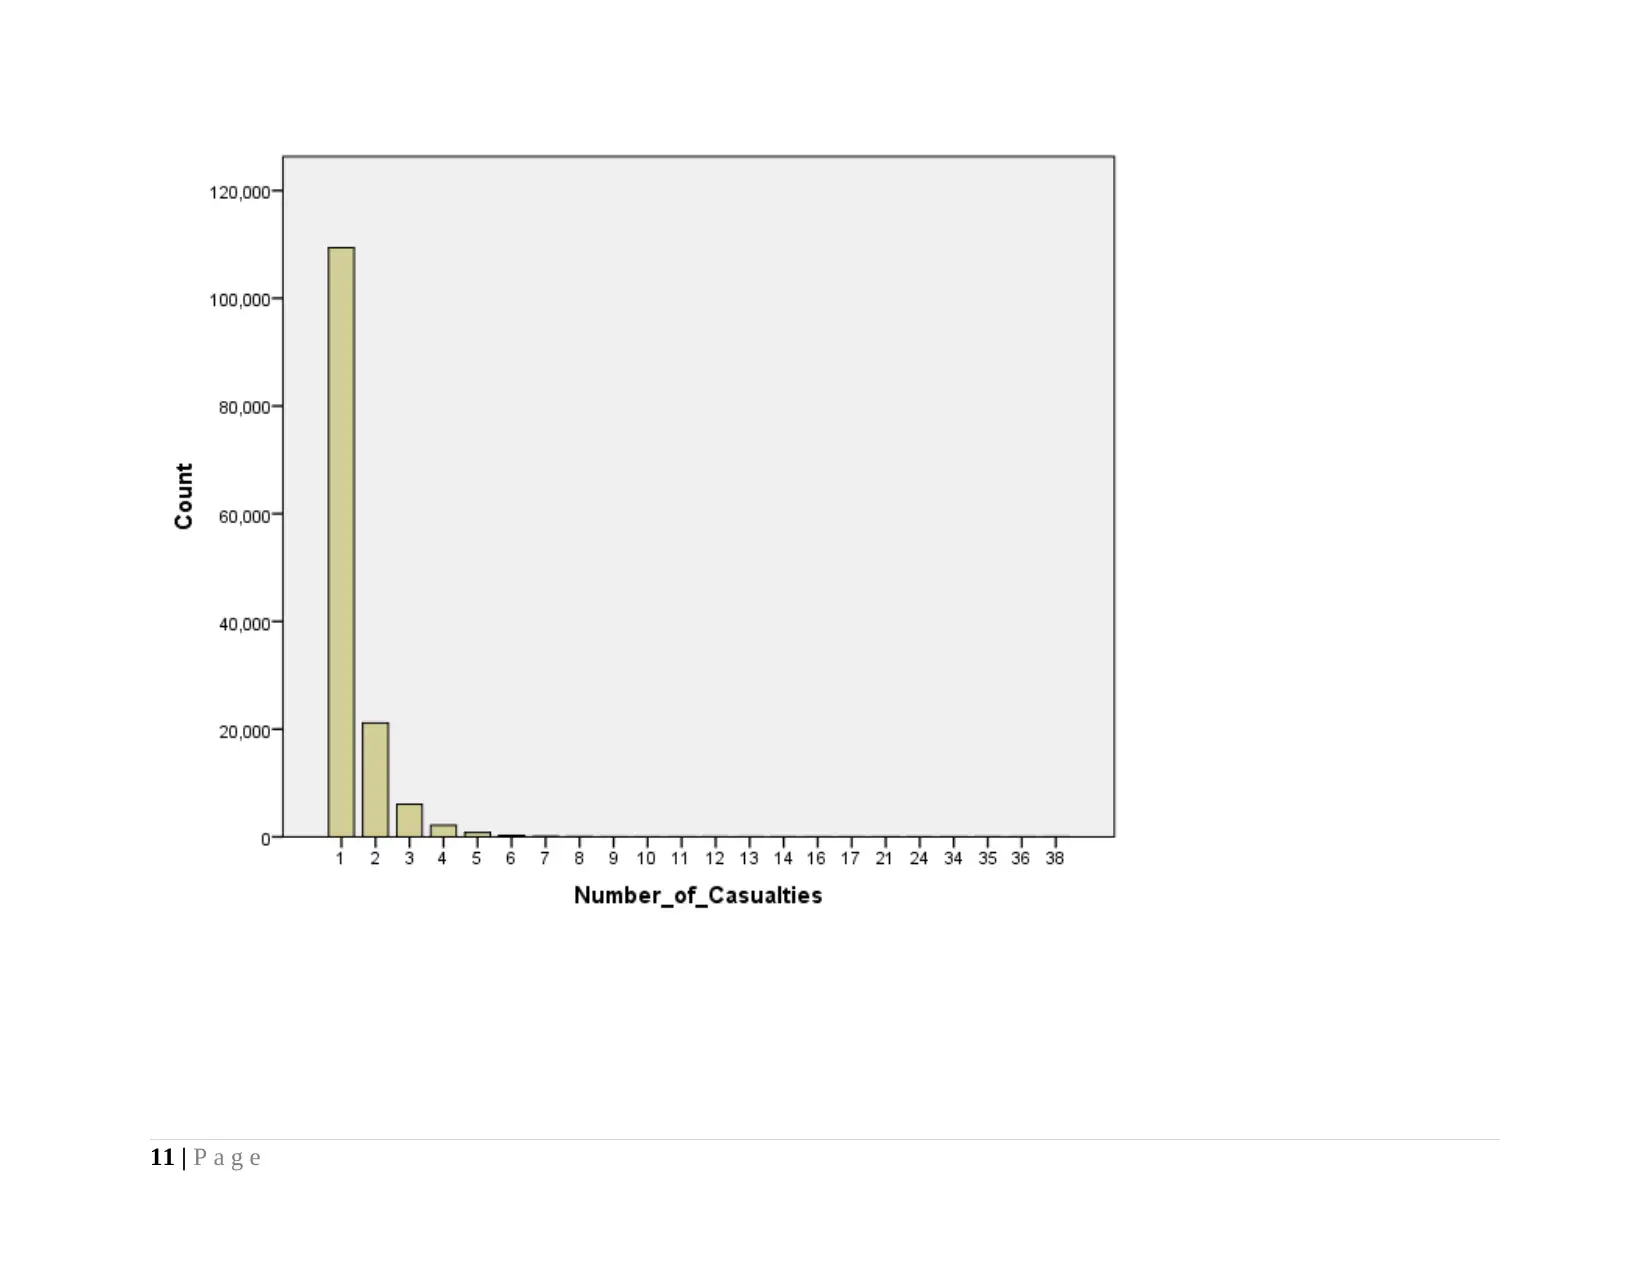
As per the histogram presented above, it can be seen that number of causality as well as accident severity do not indicates
normal frequency distribution in bell shaped, however, in contrast, speed limit clearly shows normal distribution in which mean lies at
the centre which is near to the median and classifies series into two equal data set.
19 | P a g e
normal frequency distribution in bell shaped, however, in contrast, speed limit clearly shows normal distribution in which mean lies at
the centre which is near to the median and classifies series into two equal data set.
19 | P a g e
4 Data mining methods and their application
Analysis of results
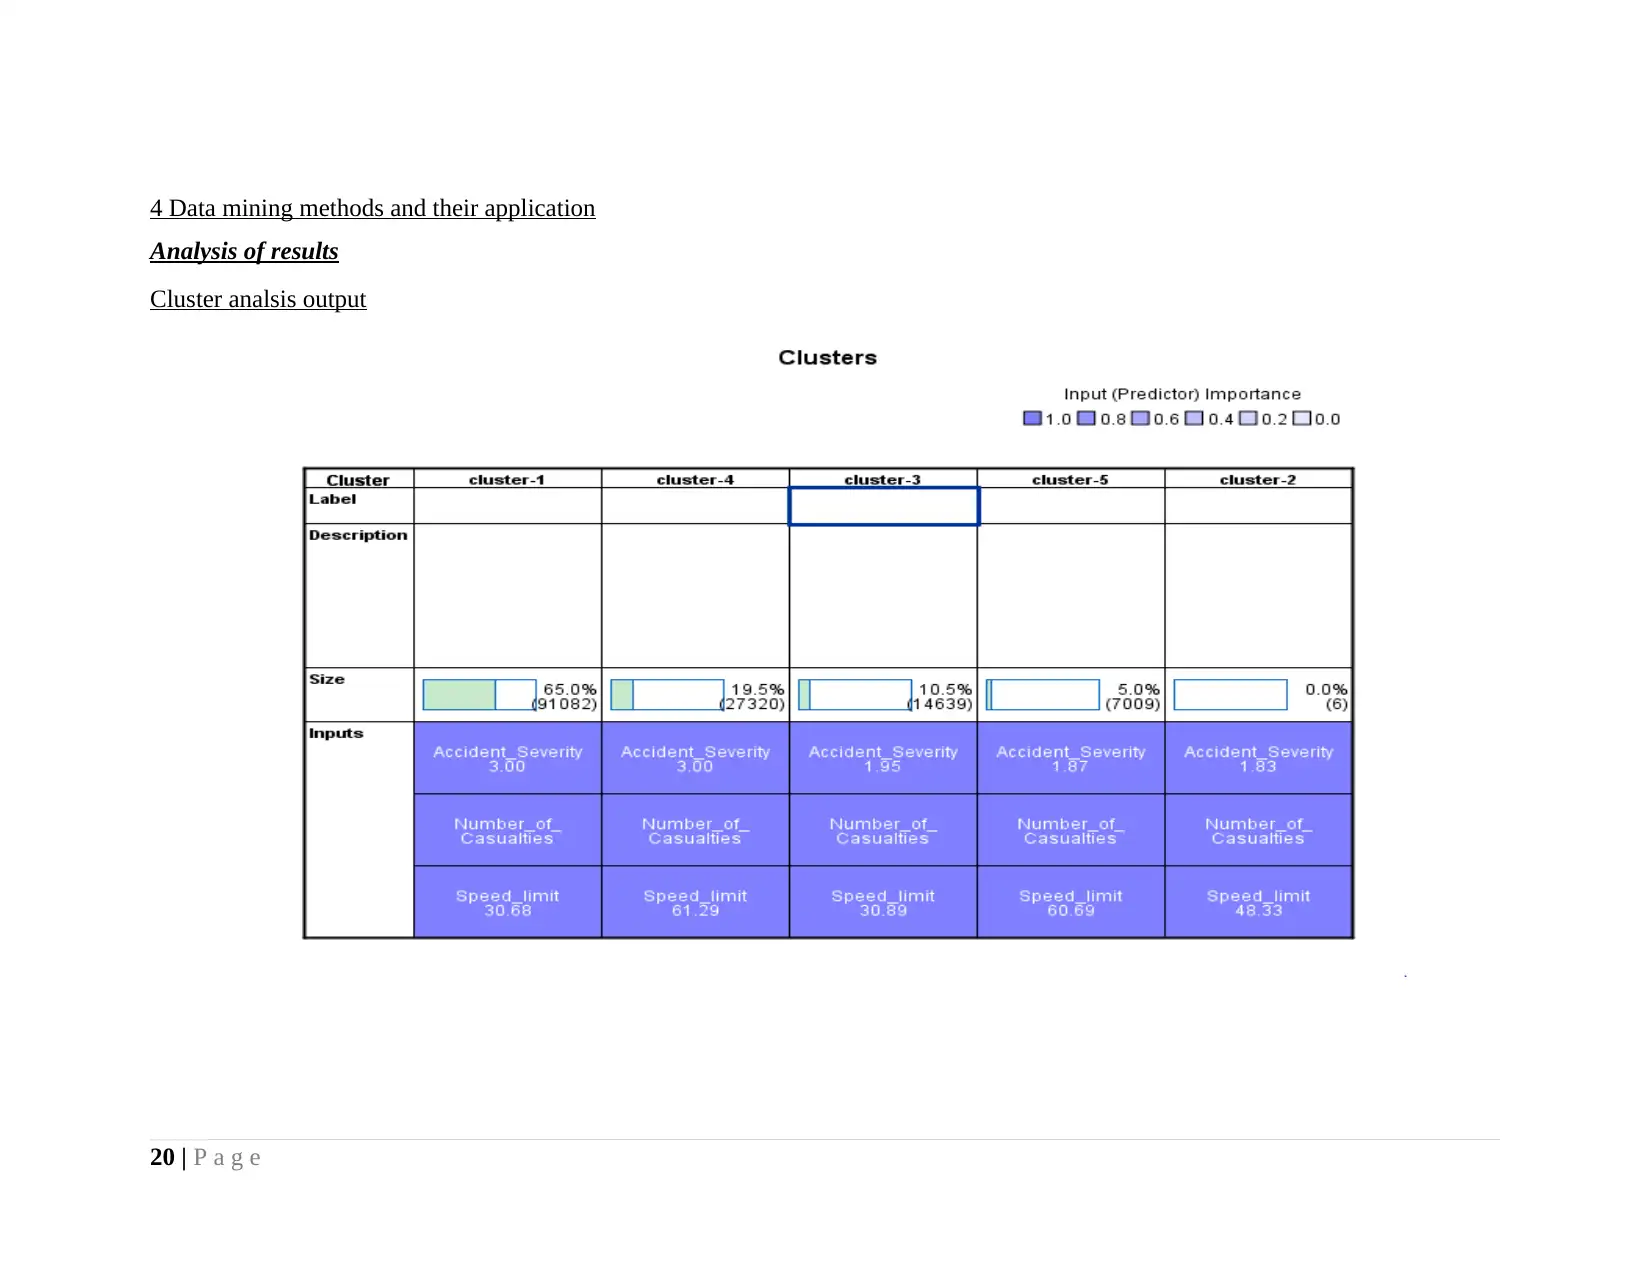
Cluster analsis output
20 | P a g e
Analysis of results
Cluster analsis output
20 | P a g e
Secure Best Marks with AI Grader
Need help grading? Try our AI Grader for instant feedback on your assignments.
Interpretation
21 | P a g e
21 | P a g e
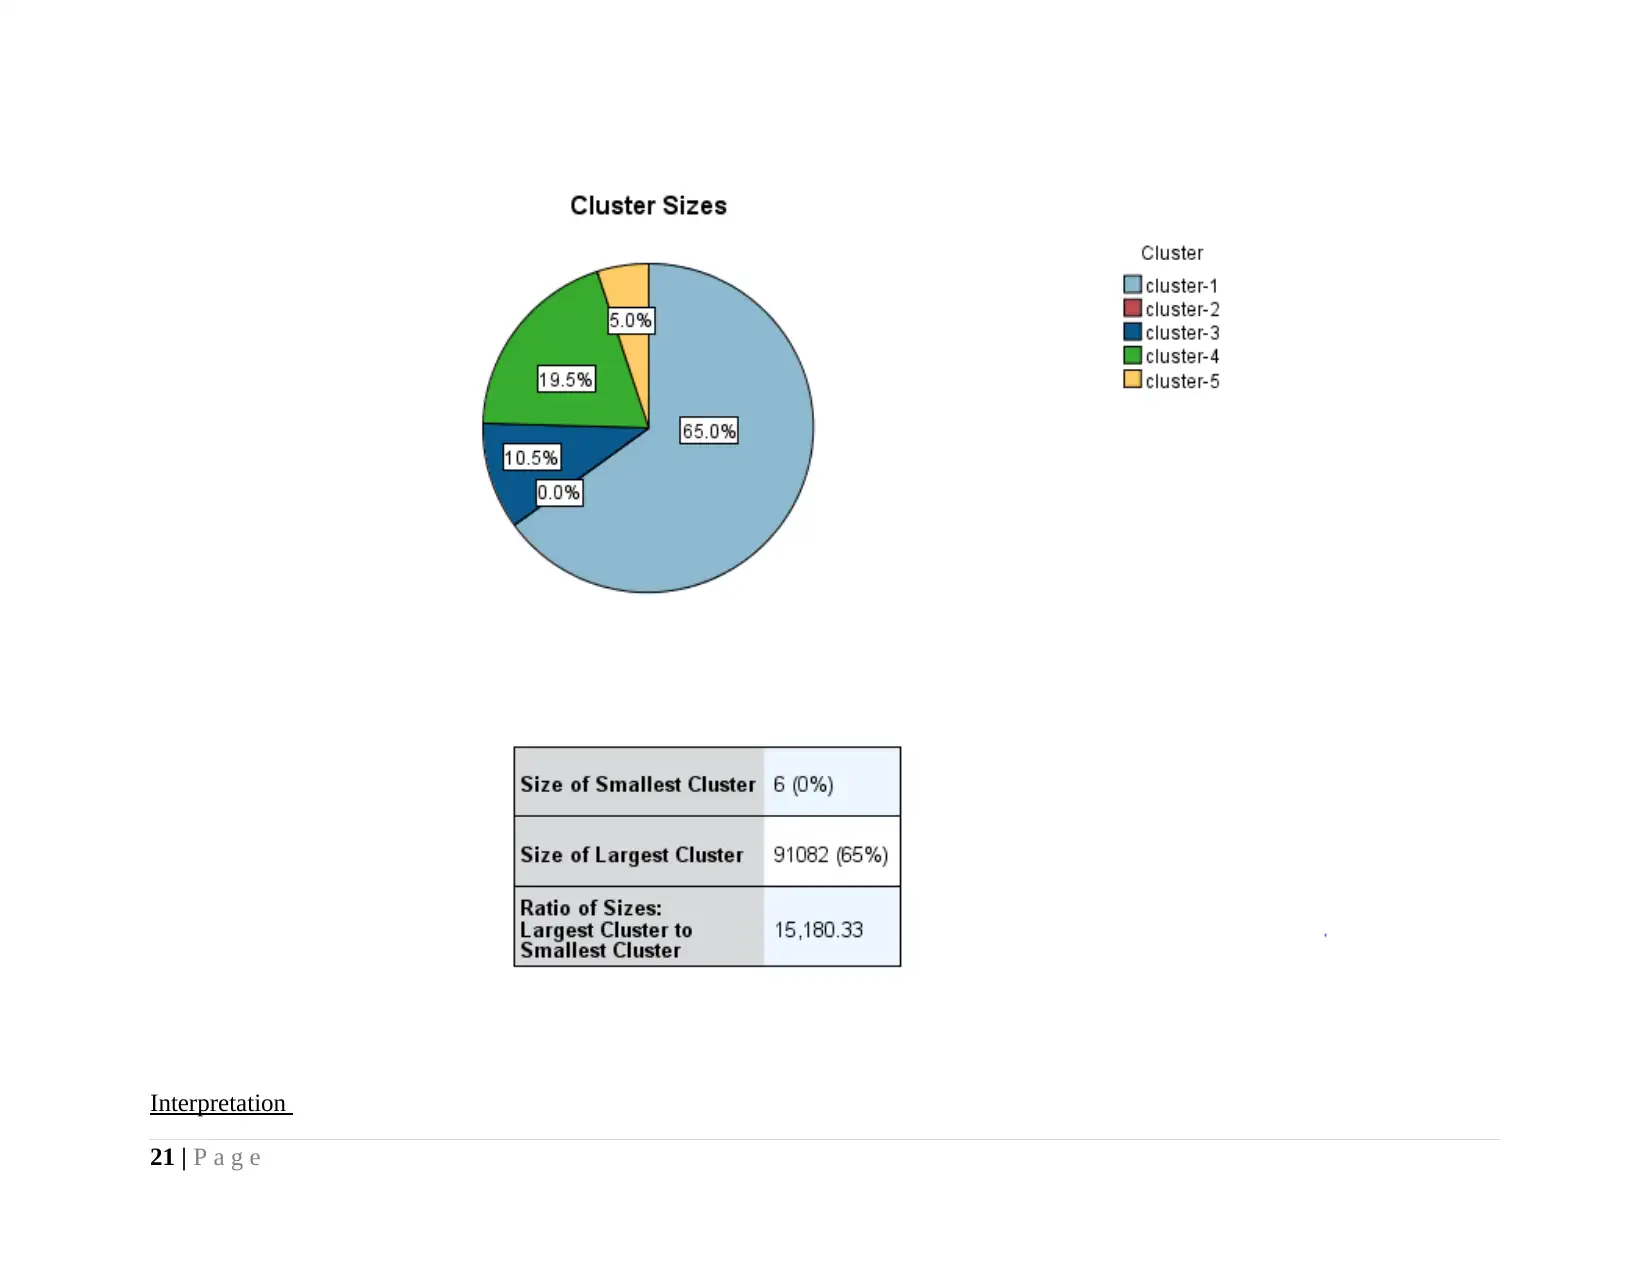
Main problem for which cluster analysis done is to identify different levels of accident severity when number of causality
happened and driver drive its vehicle at specific speed limit. In this regard cluster analysis is done. There is difference between initial
cluster and final cluster centers. Initial cluster is indicating centroid that were formed when cluster formation process initiate.
Whereas, final cluster reflect the ultimate classification or grouping of variables on the basis of similarity that is identified by
algorithm by using pattern and proximity matrix.
Five clusters are formed and under this variables accident severity, number of casualities and speed limit. It can be seen from
the table given above that in first cluster accident severity is at low level (3) and number of casualities are 25000 followed by speed
limit in range of 20-42. In fourth cluster severity level of accident is low and number of casualities reduced to 7000 and speed limit
increased 45 above. Further, in third cluster speed limit reduced and severity level become moderate to 1.95 approx 2 and number of
casualities reduced approximately to 4. In fifth cluster speed limit is nearby to 60 and accident severity level is moderate to 1.87
approx 2 and number of casualities reduced to 2000. In cluster 2 speed limit on average basis is 48.33 and accident severity level is
moderate as well as number of casualities are nearby to negligible which is very low. Intersting fact that is explored on conducting
cluster analysis is that speed increased to 63 but still number of casuality is low at 6000 which is less then casuality that happened at
speed of 30.68 and accident severity is low.
Speed limit of 63 is reflecting that at mentioned speed individuals drive their vehicle on high ways and due to this reason
causalities are very less in number and severity level is low as rods are wide. In case of other speeds like 43,30 and 20 accident
severity is moderare and low for later two class as roads are wide and due to this reason even accident takes place individuals comes
in position where they can handle situation and due to this reason accident severity is low.
Oveall cluster analysis is revealing that at speed of 30.68 higher number of casualities happened abut severity level is low
which means small injury happen to people due to accident but cases of people wounded is high. Accident severirty level is moderate
and low in case of speed of 60.69 and 61.29. casuality number is 1000 and 6000 at speed of 60.69 and 61.29. Hence, it can be said that
22 | P a g e
there is there is minor difference between both speeds but casuality level and accident severity level is quite different which is
surprising fact. Similar trends are observed in case of spped of 30.68 and 30.89. It can be said that there is no big difference in
accident severity level across all clusters because in all of them value always lie in range of 1.80 to 3. However, with increase in speed
casuality level reduced consistently.
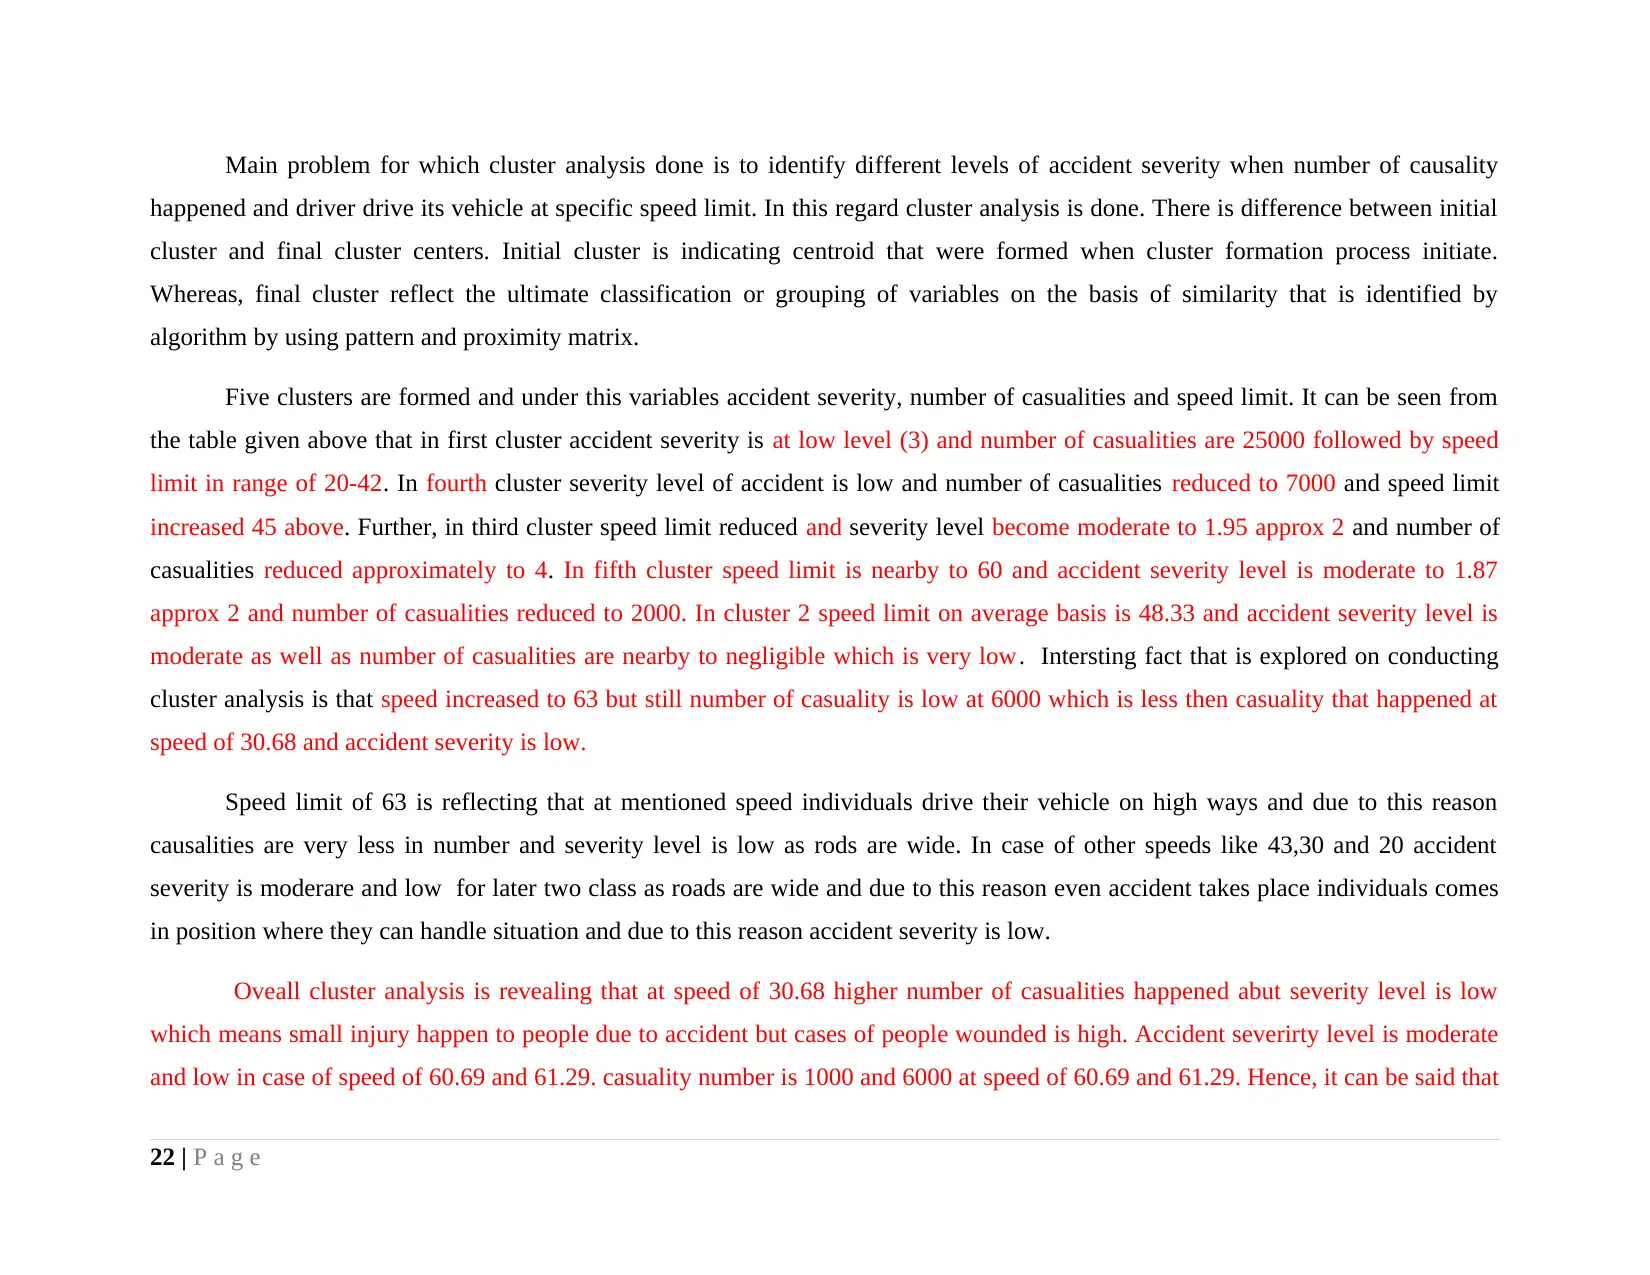
Decision tree
Interpretation
Decision tree first of all reflect accident severity level at different speed limit. It can be seen from the decision tree that is given
above that at high speed accident severity level incresed but at slow rate. At speed of 20 to 30 accident severity level is 2.86 which
23 | P a g e
surprising fact. Similar trends are observed in case of spped of 30.68 and 30.89. It can be said that there is no big difference in
accident severity level across all clusters because in all of them value always lie in range of 1.80 to 3. However, with increase in speed
casuality level reduced consistently.
Decision tree
Interpretation
Decision tree first of all reflect accident severity level at different speed limit. It can be seen from the decision tree that is given
above that at high speed accident severity level incresed but at slow rate. At speed of 20 to 30 accident severity level is 2.86 which
23 | P a g e
Paraphrase This Document
Need a fresh take? Get an instant paraphrase of this document with our AI Paraphraser
comes in low or moderate class as value is nerby to 3. Percentage of respondents comes in this category are 64%. On other hand at
speed of 30 to 50 predicted accident severity is 2.813 which again comes in moderate class. People riding vehcile is this speed are
small in number and cover only 12.44% of entire sample. Accident severity level is 2.731 in case of speed of 50 to 60. People
operating vehicle at this speed are similar to those who ride vehicle at speed of 30 to 50. Same percentage is very low as 6.87% at
speed level of greater then 60. It can be said that accident severity level is low and almost moderate at all speed level.
It must be noted that with increase in speed not doubt accident severity level is stable. Higher number of people run vehicle at
speed of 20-30. Second variable that is taken in to account is number of causalities and on that basis accident severity level is
measured. It can be seen that in speed limit of 30 majority of observations of are included in terms of number of causalities.
Casualities happened at different speed level but interesting fact is that accident sverity level is moderate across all groups.
All these facts reflect that at speed of 30 higher number of accident takes place. Interesting fact is that at speed limit of 60 like
30 varied classifications are done where number of casualities are low relative to speed of 30. So, decision tree is reflecting that at
speed of 60 and 70 less number of casuality happened but severity level of accident is moderate.
Usefulness of output for making decisions and proposed suggestion to solve problem
Output of cluster analysis and decision tree which are part of data mining techniques prove very useful and it is suggested that
rule must be formed in UK that no one can run vehicle above limit of 30. By doing so chances of number of casuality can be bring
down substaintially and severiry level can be kept constant. Awareness can increased among people and in this regard programs can
be organized where these facts can be placed in front of people and can be motivated to maintain speed within range below 30.
CONCLUSION
On the basis of above discussion it is concluded that there is huge importance of data mining methods which are cluster
analysis and deision tree. By using alorithms which include confusion matrix, proximity and pattern matrix as well as k means
centroid similarity among data points of multiple variables is identified and patterns are explored. It is concluded that less number of
24 | P a g e
people run their vehicle above 30.68 and accident severity level is moderate across all speed level but causalities are high at speed
level of 30.68 relative speed above mentioned value which is 50-70. At speed of 30 percentage of casuality rise suddenly by huge
percentage which is matter of concern. There is need to take some strict steps by using which people can be motivated to control speed
at which they operate their vehicle.
25 | P a g e
REFERENCES
Books and Journals
Decision tree, 2017. [Online]. Available through:< http://whatis.techtarget.com/definition/decision-tree>. [Acessed on 18th August
2017].
How To Group Objects Into Similar Categories, Cluster Analysis, 2017. [Online]. Available through:<
http://www.statsoft.com/Textbook/Cluster-Analysis>. [Acessed on 18th August 2017].
26 | P a g e
1 out of 28
Related Documents


Your All-in-One AI-Powered Toolkit for Academic Success.
+13062052269
info@desklib.com
Available 24*7 on WhatsApp / Email
![[object Object]](/_next/static/media/star-bottom.7253800d.svg)
Unlock your academic potential
© 2024 | Zucol Services PVT LTD | All rights reserved.