Comprehensive Statistical Analysis Report for Managerial Decisions
VerifiedAdded on 2020/12/18
|19
|2775
|200
Report
AI Summary
This report presents a comprehensive statistical analysis aimed at aiding managerial decisions. It begins with an introduction to statistics and its applications in various business contexts. The report then delves into specific statistical techniques, starting with data visualization methods like stem and leaf plots, relative frequency histograms, and bar charts to analyze quarterly opening prices of stocks. Further analysis includes calculating descriptive statistics such as mean, median, standard deviation, and constructing box-whisker plots for price comparisons. Probability concepts are explored through scenarios involving water sources and rainfall patterns. The report also covers hypothesis testing, constructing confidence intervals, and assessing normal probability plots for different variables, providing a detailed examination of statistical tools for informed decision-making.

STATISTICS FOR
MANAGERIAL DECISIONS
MANAGERIAL DECISIONS
Paraphrase This Document
Need a fresh take? Get an instant paraphrase of this document with our AI Paraphraser
TABLE OF CONTENTS
INTRODUCTION...........................................................................................................................1
QUESTION 1...................................................................................................................................1
(a) Listing quarterly opening price (2003-2015) of WPL and WOR with stem and leaf display
.....................................................................................................................................................1
(b) Constructing relative frequency histogram for WPL and frequency polygon for WOR .....2
(c) Drawing bar chart of market capital in 2015 of WPL, WOR, ORG, STO, CTX and SOL...5
(d) Proportion of stock price above $40 for each of WPL and WOR.........................................6
QUESTION 2...................................................................................................................................6
(a) Computation mean, median, first quartile and third quartile of price...................................6
(b) Computation of standard deviation, range and coefficient of variation of every publisher. .6
(c) Drawing box whisker plot for price of each publisher..........................................................7
QUESTION 3...................................................................................................................................9
(a) Probability it gets water from on farm dams or tanks...........................................................9
(b) Probability it gets water from groundwater and is located in Queensland............................9
(c) Probability it gets water from water from rivers, creeks or lakes..........................................9
(d) In New south Wales, which proportion of farm does not take water from either channels of
irrigation or pipelines or river, creeks or lakes.........................................................................10
QUESTION 4.................................................................................................................................10
(a.i) Probability that on any given week in a year would be no rainfall...................................10
(a.ii) Probability that there would be 3 on more days of rainfall in a week..............................10
(b.i) Probability in given week there would be among 6 mm and 12 mm of rainfall...............10
(b.ii) Amount of rainfall if 20% of the weeks have amount of rainfall or higher.....................10
QUESTION 5.................................................................................................................................11
(a) Normal Probability Plots.....................................................................................................11
(b) Constructing 95% confidence interval for every variable...................................................12
(c) Testing hypothesis that more areas in forest burn when temperature is above 25 degree C
than below 25 degree c with 1% level of significance..............................................................14
CONCLUSION..............................................................................................................................15

⊘ This is a preview!⊘
Do you want full access?
Subscribe today to unlock all pages.
Trusted by 1+ million students worldwide
INTRODUCTION
Statistics is considered as science of good decision making in uncertainty and used in
multiple disciplines like financial analysis, auditing, econometrics, operations and production
which comprises services improvement and marketing research. The present report will provide
interpretation and application of statistical techniques and scenarios. In the same series, it will
imply statistical techniques as tool for decision making in business environment.
QUESTION 1
(a) Listing quarterly opening price (2003-2015) of WPL and WOR with stem and leaf display
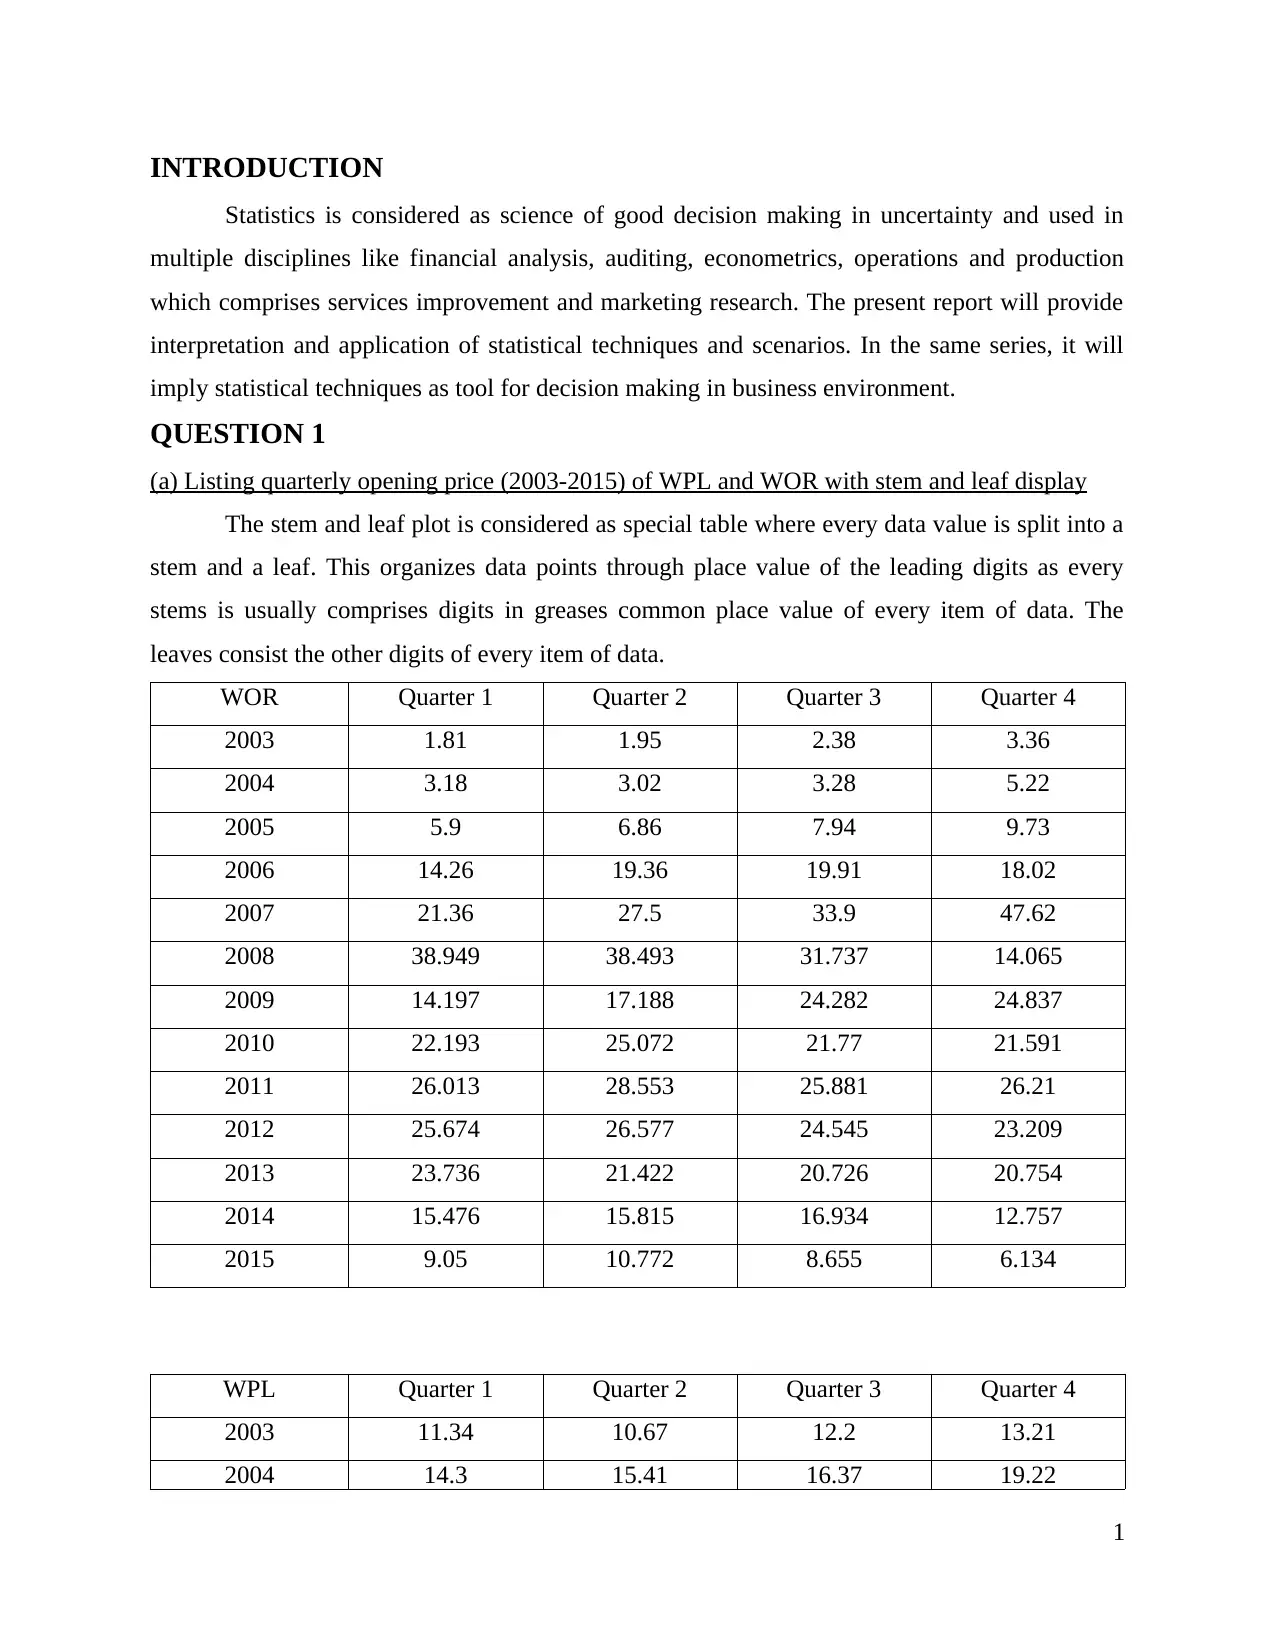
The stem and leaf plot is considered as special table where every data value is split into a
stem and a leaf. This organizes data points through place value of the leading digits as every
stems is usually comprises digits in greases common place value of every item of data. The
leaves consist the other digits of every item of data.
WOR Quarter 1 Quarter 2 Quarter 3 Quarter 4
2003 1.81 1.95 2.38 3.36
2004 3.18 3.02 3.28 5.22
2005 5.9 6.86 7.94 9.73
2006 14.26 19.36 19.91 18.02
2007 21.36 27.5 33.9 47.62
2008 38.949 38.493 31.737 14.065
2009 14.197 17.188 24.282 24.837
2010 22.193 25.072 21.77 21.591
2011 26.013 28.553 25.881 26.21
2012 25.674 26.577 24.545 23.209
2013 23.736 21.422 20.726 20.754
2014 15.476 15.815 16.934 12.757
2015 9.05 10.772 8.655 6.134
WPL Quarter 1 Quarter 2 Quarter 3 Quarter 4
2003 11.34 10.67 12.2 13.21
2004 14.3 15.41 16.37 19.22
1
Statistics is considered as science of good decision making in uncertainty and used in
multiple disciplines like financial analysis, auditing, econometrics, operations and production
which comprises services improvement and marketing research. The present report will provide
interpretation and application of statistical techniques and scenarios. In the same series, it will
imply statistical techniques as tool for decision making in business environment.
QUESTION 1
(a) Listing quarterly opening price (2003-2015) of WPL and WOR with stem and leaf display
The stem and leaf plot is considered as special table where every data value is split into a
stem and a leaf. This organizes data points through place value of the leading digits as every
stems is usually comprises digits in greases common place value of every item of data. The
leaves consist the other digits of every item of data.
WOR Quarter 1 Quarter 2 Quarter 3 Quarter 4
2003 1.81 1.95 2.38 3.36
2004 3.18 3.02 3.28 5.22
2005 5.9 6.86 7.94 9.73
2006 14.26 19.36 19.91 18.02
2007 21.36 27.5 33.9 47.62
2008 38.949 38.493 31.737 14.065
2009 14.197 17.188 24.282 24.837
2010 22.193 25.072 21.77 21.591
2011 26.013 28.553 25.881 26.21
2012 25.674 26.577 24.545 23.209
2013 23.736 21.422 20.726 20.754
2014 15.476 15.815 16.934 12.757
2015 9.05 10.772 8.655 6.134
WPL Quarter 1 Quarter 2 Quarter 3 Quarter 4
2003 11.34 10.67 12.2 13.21
2004 14.3 15.41 16.37 19.22
1
Paraphrase This Document
Need a fresh take? Get an instant paraphrase of this document with our AI Paraphraser
2005 20.42 24.29 28.16 34.76
2006 44.26 45.67 41.76 36.65
2007 36.45 38.47 42.25 50.75
2008 44.73 53.95 51.92 40.42
2009 34.15 37.04 44.11 46.04
2010 41.19 44.18 40.48 42.33
2011 40.52 45.54 37.32 35.58
2012 33.29 33.98 32.84 33.48
2013 34.52 37.14 37.17 38.39
2014 36.97 40.35 42.05 39.68
2015 33.9 34.66 35.25 29.28
The stem and leaf plot shows that open price of WOR is low as compared with WPL
shares of open prices. With the aggregate, distribution of both WOR and WPL distribution has
longer tail which is facing towards left side of normality curve and signifies that distribution of
WOR and WPL is skewed at left.
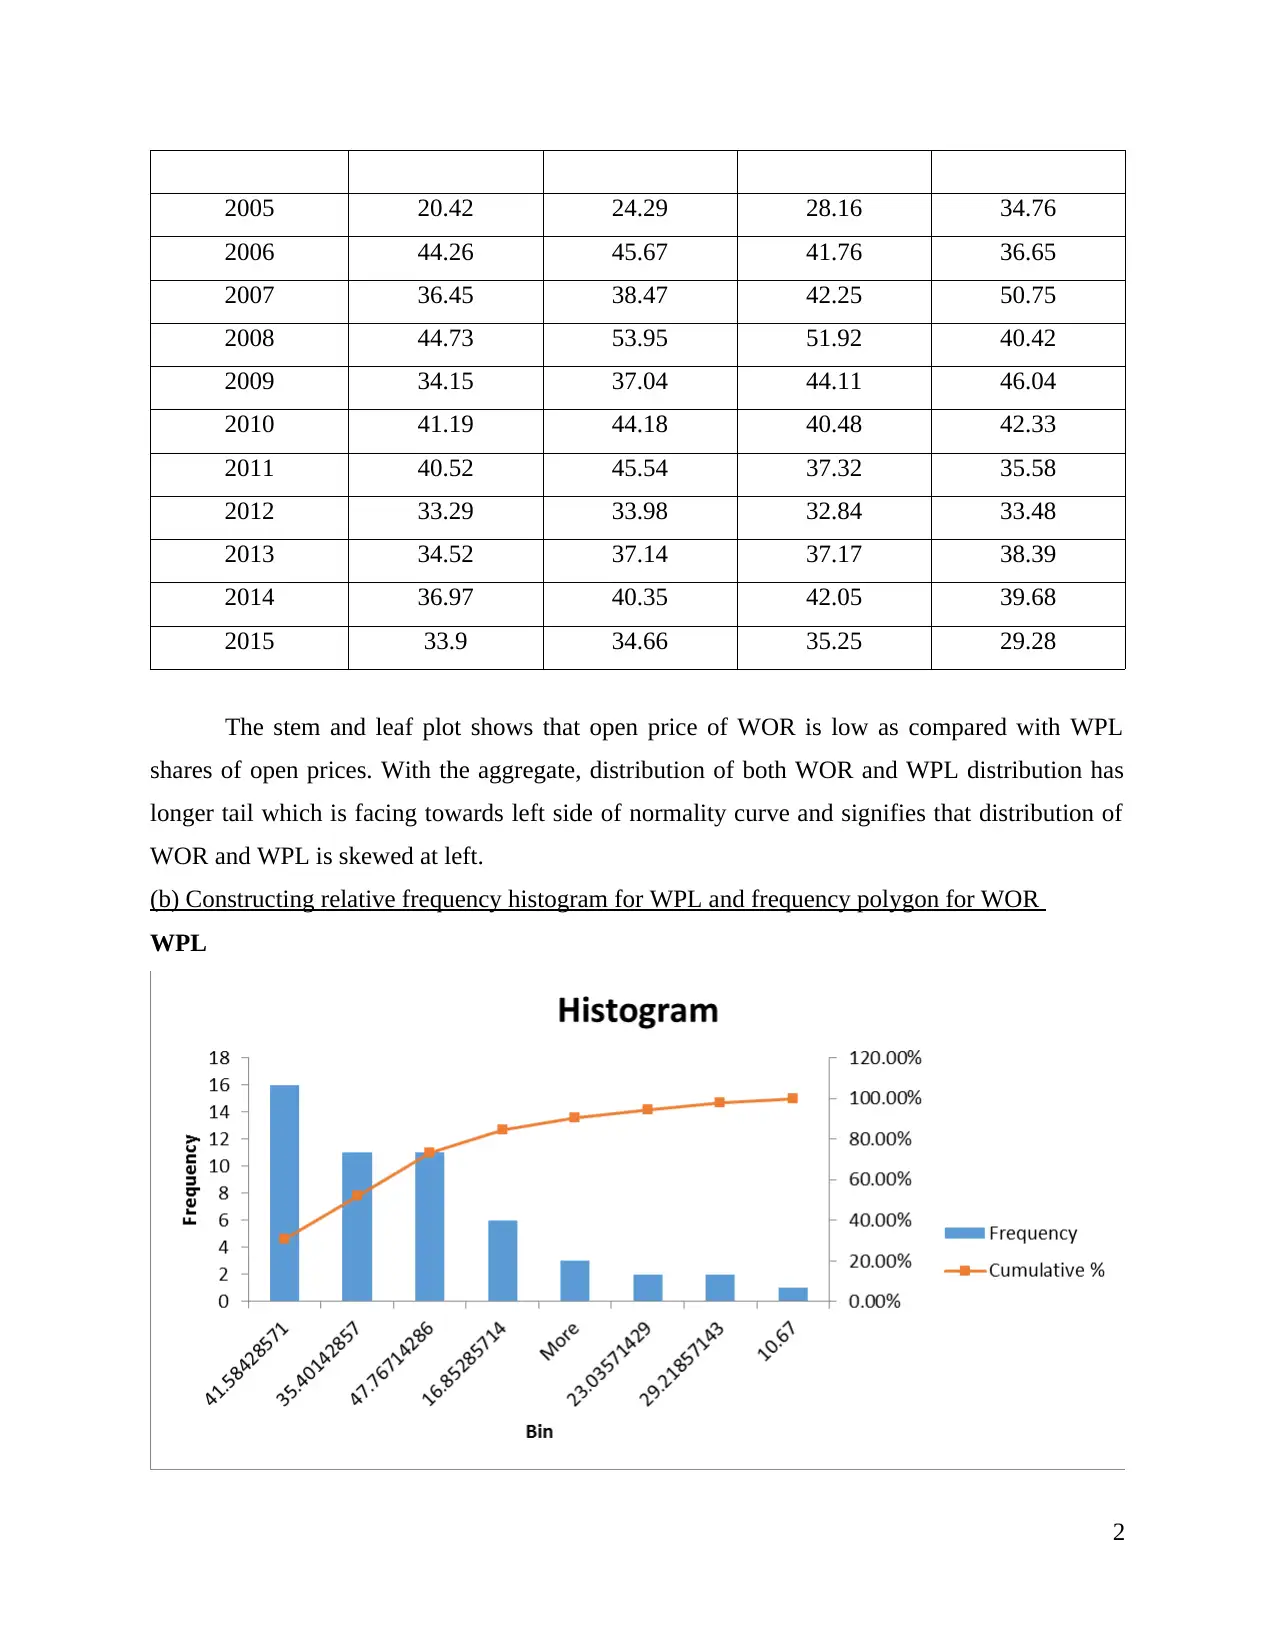
(b) Constructing relative frequency histogram for WPL and frequency polygon for WOR
WPL
2
2006 44.26 45.67 41.76 36.65
2007 36.45 38.47 42.25 50.75
2008 44.73 53.95 51.92 40.42
2009 34.15 37.04 44.11 46.04
2010 41.19 44.18 40.48 42.33
2011 40.52 45.54 37.32 35.58
2012 33.29 33.98 32.84 33.48
2013 34.52 37.14 37.17 38.39
2014 36.97 40.35 42.05 39.68
2015 33.9 34.66 35.25 29.28
The stem and leaf plot shows that open price of WOR is low as compared with WPL
shares of open prices. With the aggregate, distribution of both WOR and WPL distribution has
longer tail which is facing towards left side of normality curve and signifies that distribution of
WOR and WPL is skewed at left.
(b) Constructing relative frequency histogram for WPL and frequency polygon for WOR
WPL
2
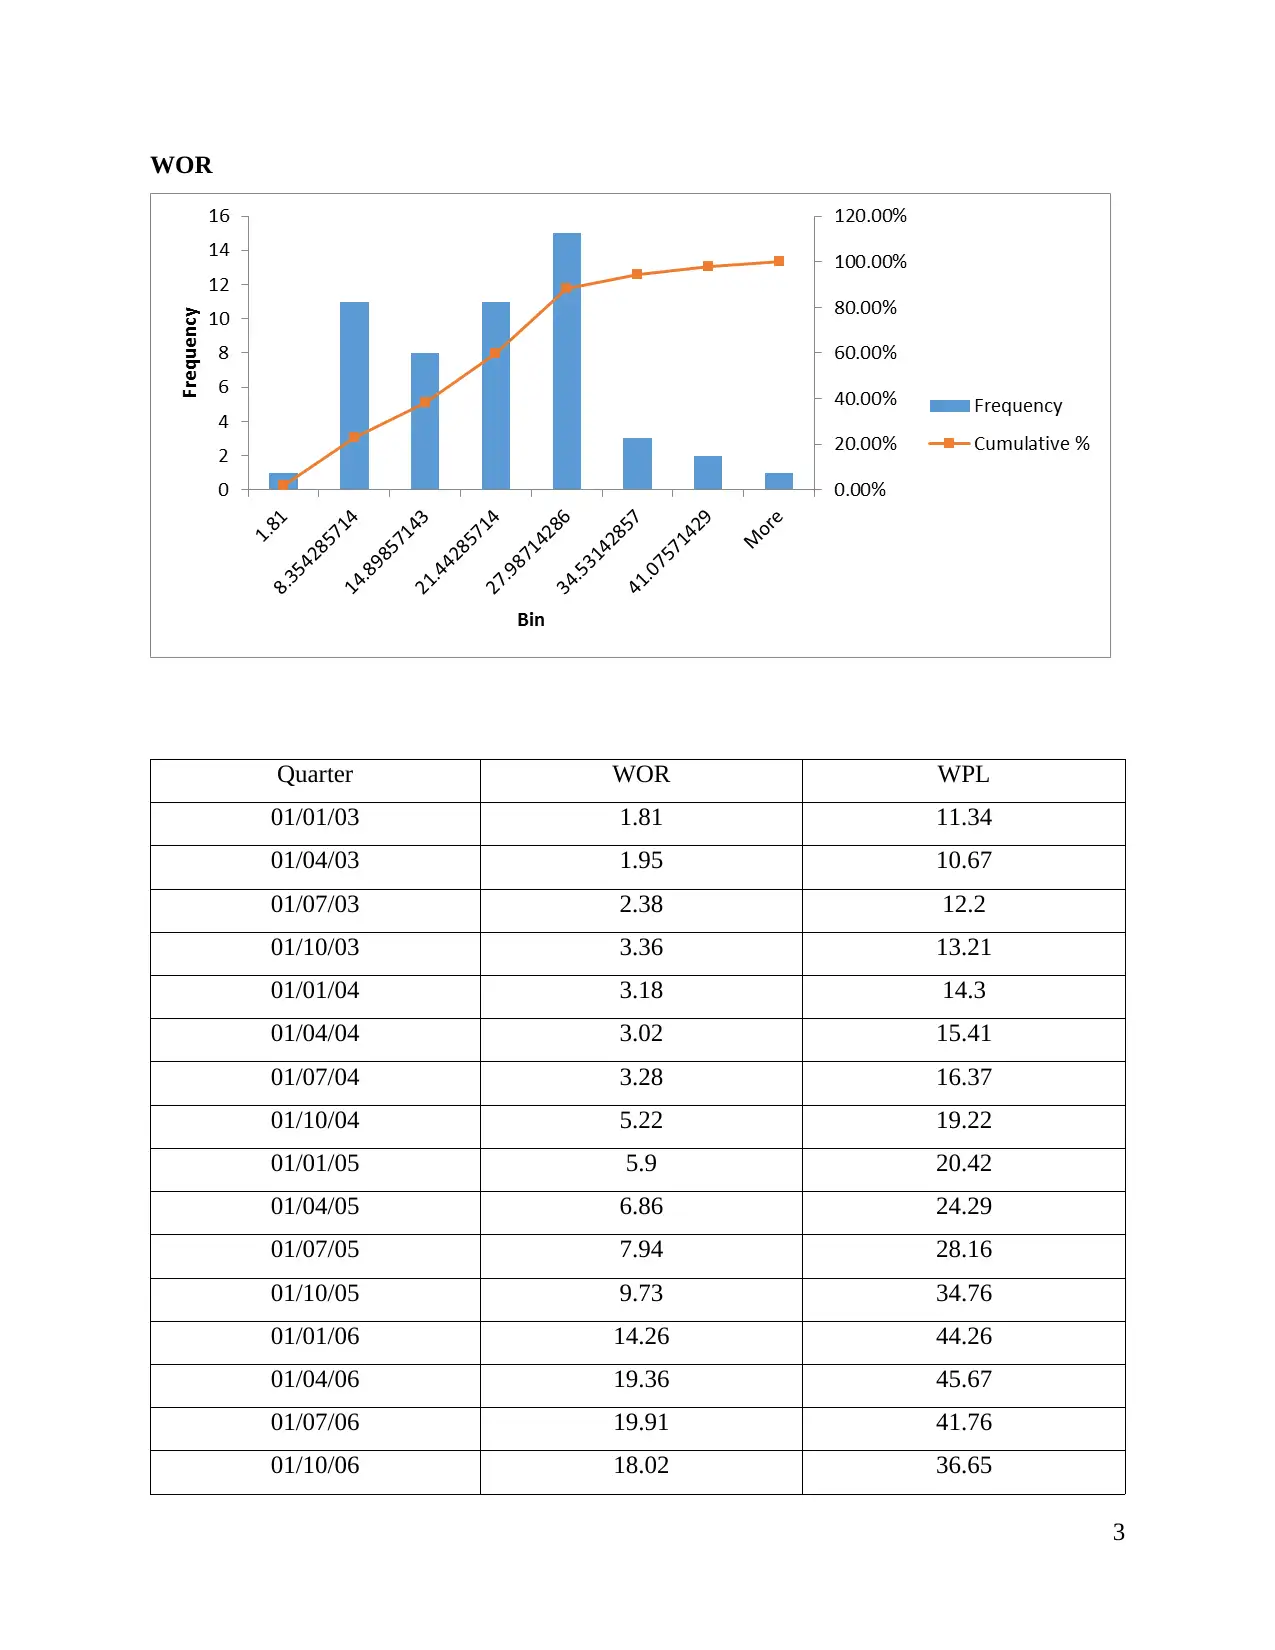
WOR
Quarter WOR WPL
01/01/03 1.81 11.34
01/04/03 1.95 10.67
01/07/03 2.38 12.2
01/10/03 3.36 13.21
01/01/04 3.18 14.3
01/04/04 3.02 15.41
01/07/04 3.28 16.37
01/10/04 5.22 19.22
01/01/05 5.9 20.42
01/04/05 6.86 24.29
01/07/05 7.94 28.16
01/10/05 9.73 34.76
01/01/06 14.26 44.26
01/04/06 19.36 45.67
01/07/06 19.91 41.76
01/10/06 18.02 36.65
3
⊘ This is a preview!⊘
Do you want full access?
Subscribe today to unlock all pages.
Trusted by 1+ million students worldwide
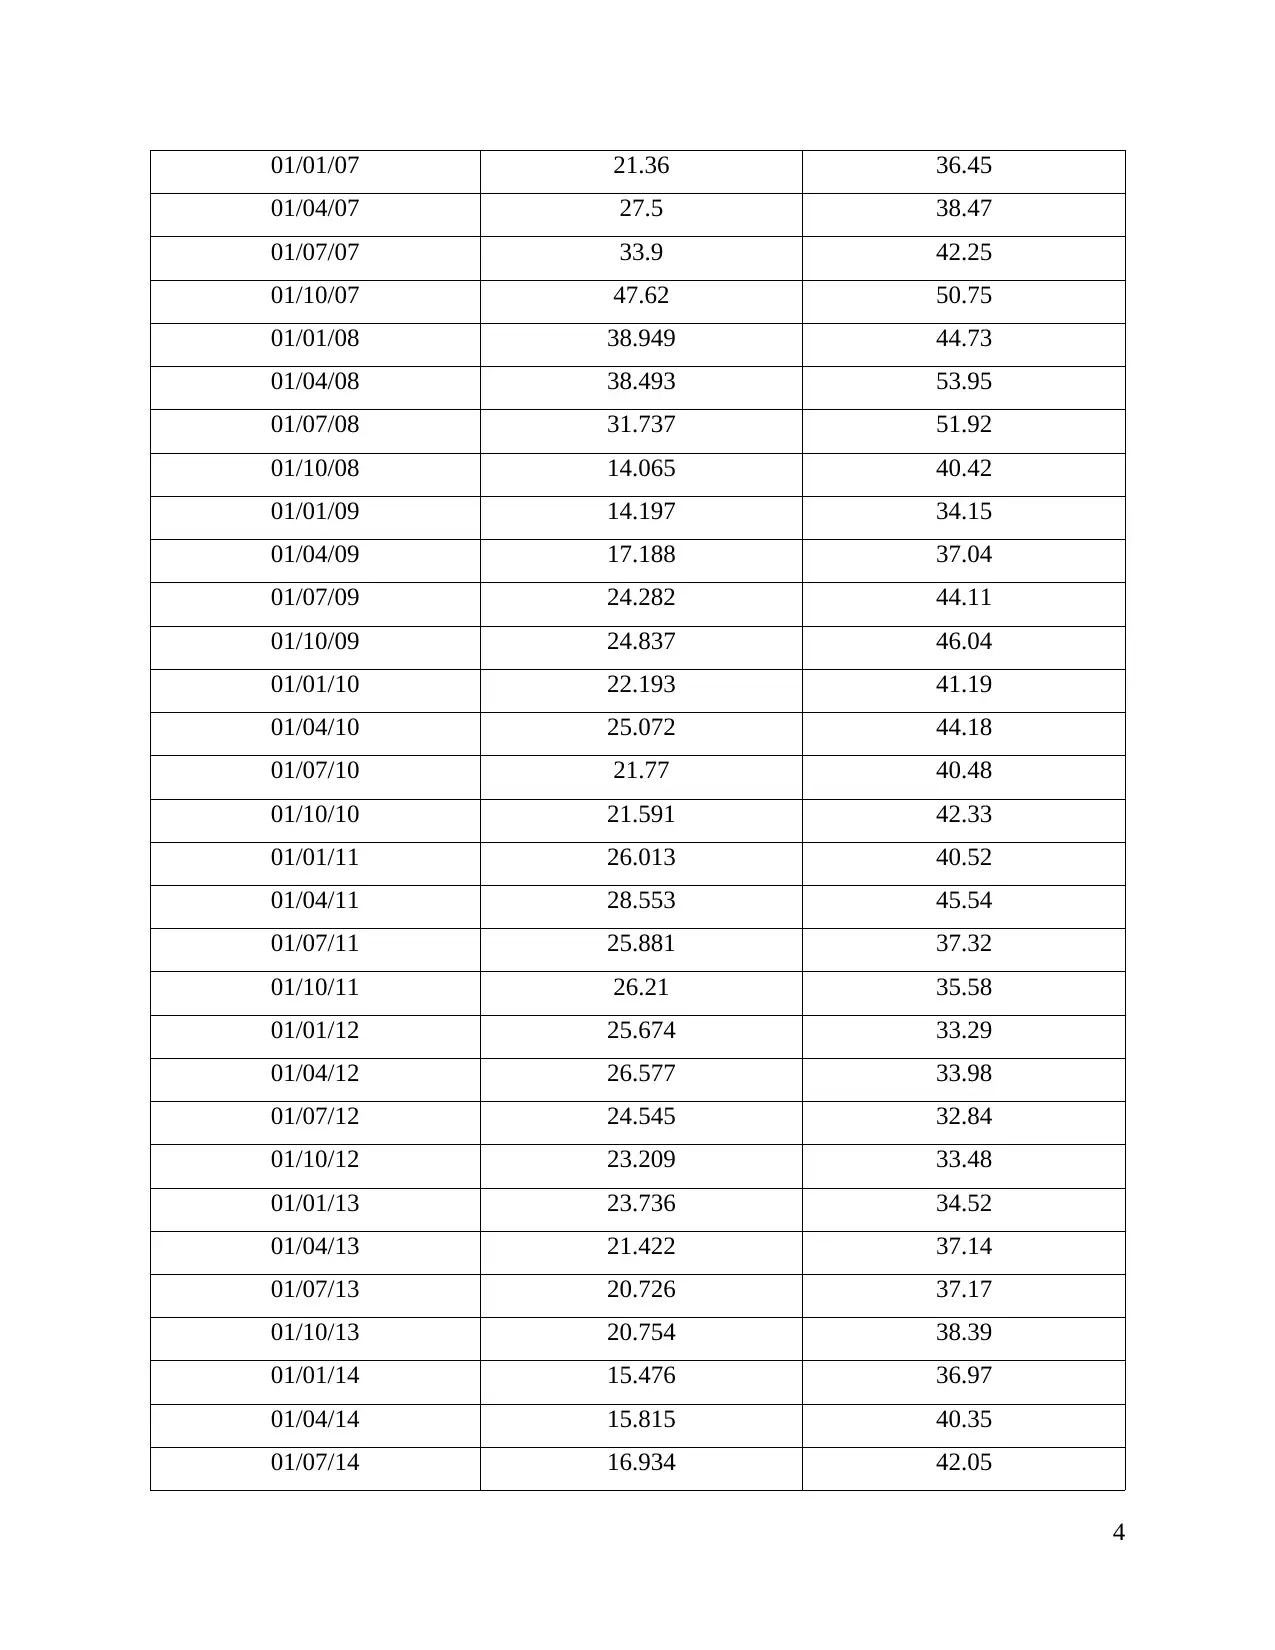
01/01/07 21.36 36.45
01/04/07 27.5 38.47
01/07/07 33.9 42.25
01/10/07 47.62 50.75
01/01/08 38.949 44.73
01/04/08 38.493 53.95
01/07/08 31.737 51.92
01/10/08 14.065 40.42
01/01/09 14.197 34.15
01/04/09 17.188 37.04
01/07/09 24.282 44.11
01/10/09 24.837 46.04
01/01/10 22.193 41.19
01/04/10 25.072 44.18
01/07/10 21.77 40.48
01/10/10 21.591 42.33
01/01/11 26.013 40.52
01/04/11 28.553 45.54
01/07/11 25.881 37.32
01/10/11 26.21 35.58
01/01/12 25.674 33.29
01/04/12 26.577 33.98
01/07/12 24.545 32.84
01/10/12 23.209 33.48
01/01/13 23.736 34.52
01/04/13 21.422 37.14
01/07/13 20.726 37.17
01/10/13 20.754 38.39
01/01/14 15.476 36.97
01/04/14 15.815 40.35
01/07/14 16.934 42.05
4
Paraphrase This Document
Need a fresh take? Get an instant paraphrase of this document with our AI Paraphraser
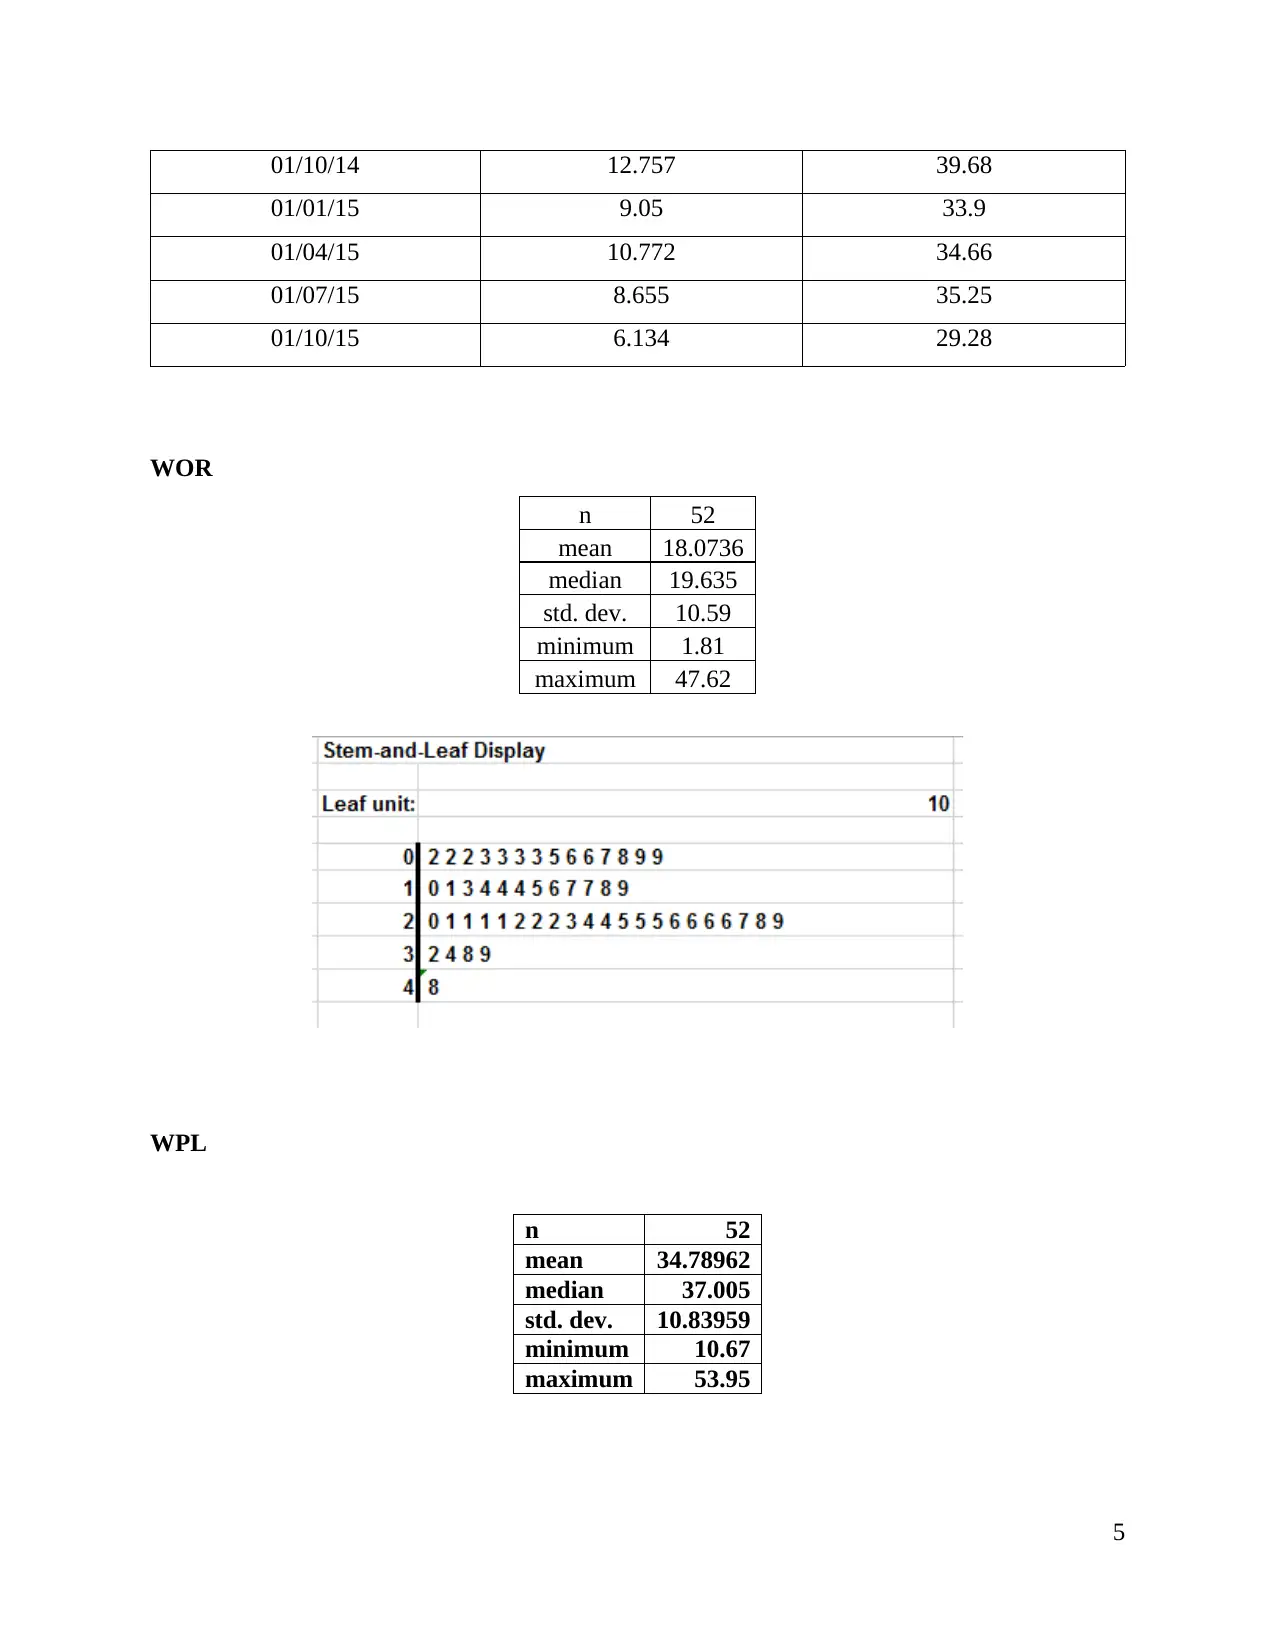
01/10/14 12.757 39.68
01/01/15 9.05 33.9
01/04/15 10.772 34.66
01/07/15 8.655 35.25
01/10/15 6.134 29.28
WOR
n 52
mean 18.0736
median 19.635
std. dev. 10.59
minimum 1.81
maximum 47.62
WPL
n 52
mean 34.78962
median 37.005
std. dev. 10.83959
minimum 10.67
maximum 53.95
5
01/01/15 9.05 33.9
01/04/15 10.772 34.66
01/07/15 8.655 35.25
01/10/15 6.134 29.28
WOR
n 52
mean 18.0736
median 19.635
std. dev. 10.59
minimum 1.81
maximum 47.62
WPL
n 52
mean 34.78962
median 37.005
std. dev. 10.83959
minimum 10.67
maximum 53.95
5
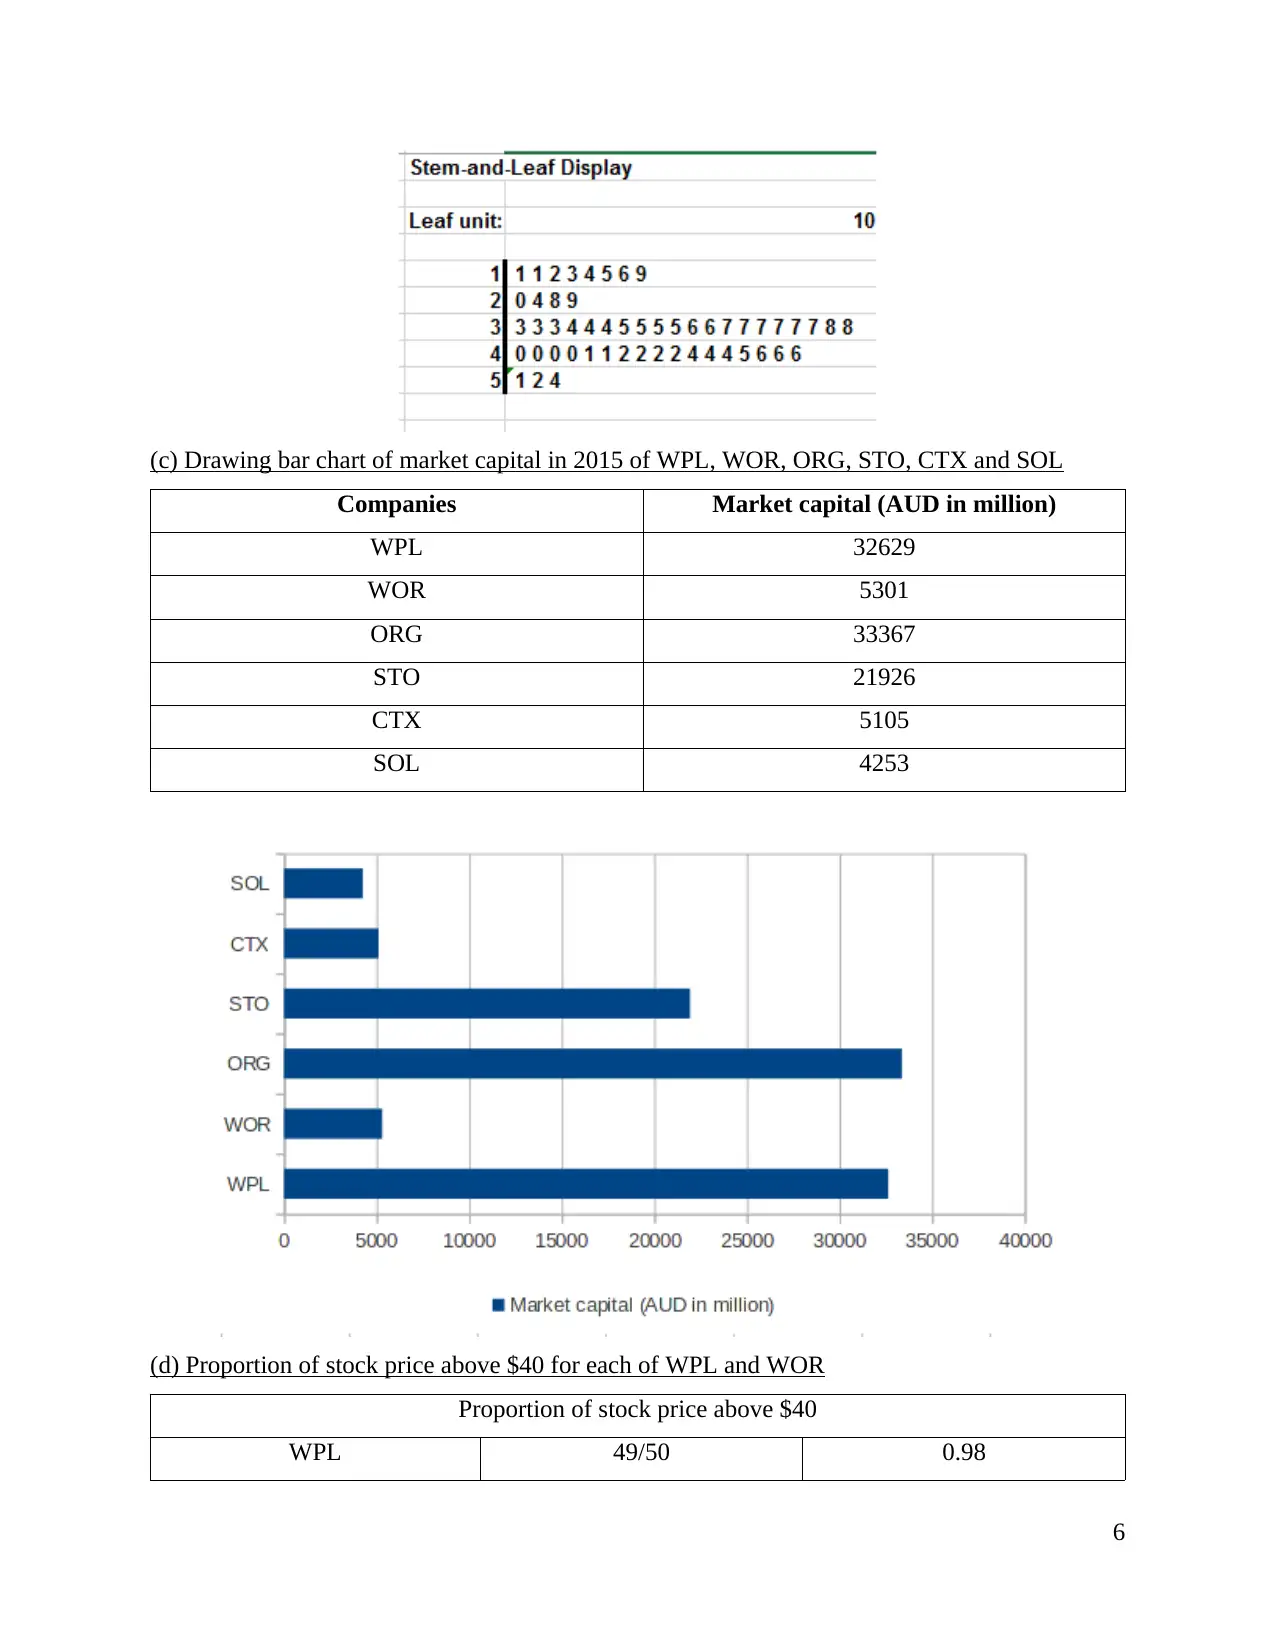
(c) Drawing bar chart of market capital in 2015 of WPL, WOR, ORG, STO, CTX and SOL
Companies Market capital (AUD in million)
WPL 32629
WOR 5301
ORG 33367
STO 21926
CTX 5105
SOL 4253
(d) Proportion of stock price above $40 for each of WPL and WOR
Proportion of stock price above $40
WPL 49/50 0.98
6
Companies Market capital (AUD in million)
WPL 32629
WOR 5301
ORG 33367
STO 21926
CTX 5105
SOL 4253
(d) Proportion of stock price above $40 for each of WPL and WOR
Proportion of stock price above $40
WPL 49/50 0.98
6
⊘ This is a preview!⊘
Do you want full access?
Subscribe today to unlock all pages.
Trusted by 1+ million students worldwide
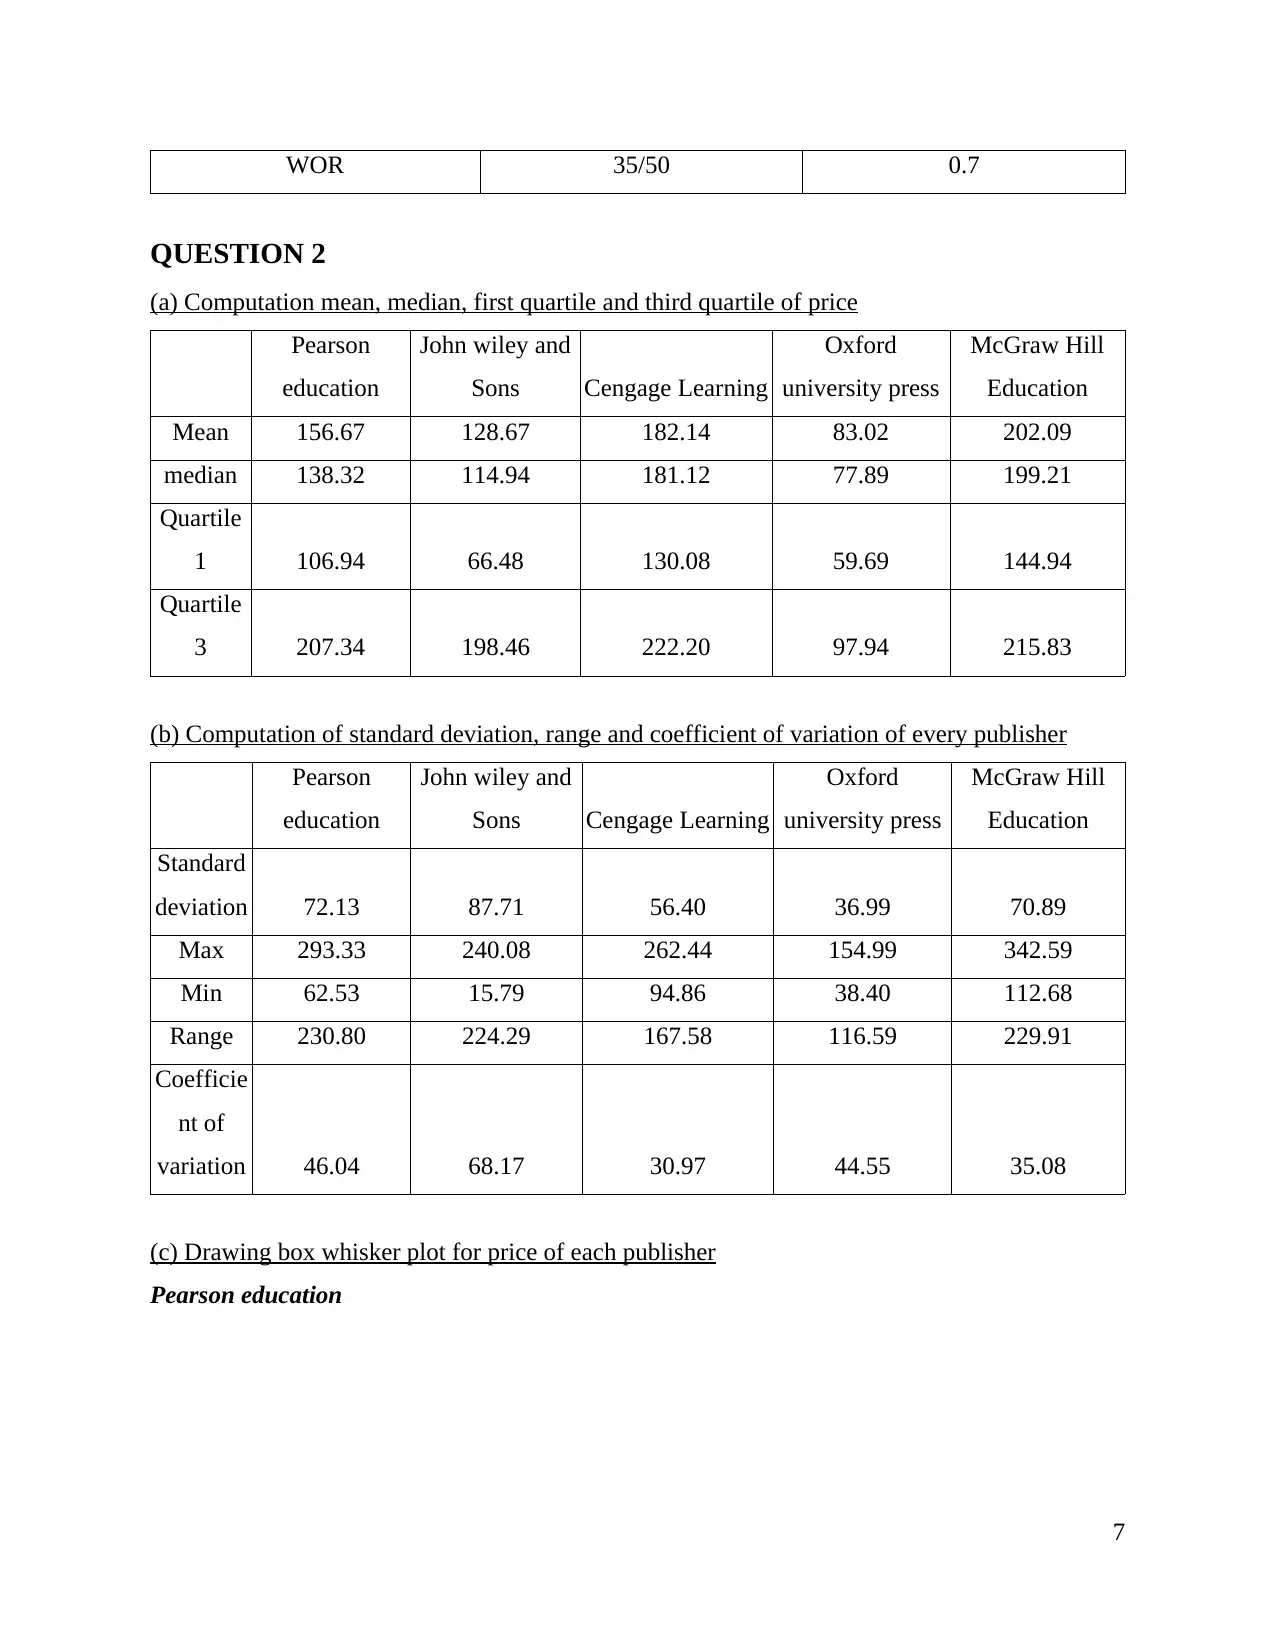
WOR 35/50 0.7
QUESTION 2
(a) Computation mean, median, first quartile and third quartile of price
Pearson
education
John wiley and
Sons Cengage Learning
Oxford
university press
McGraw Hill
Education
Mean 156.67 128.67 182.14 83.02 202.09
median 138.32 114.94 181.12 77.89 199.21
Quartile
1 106.94 66.48 130.08 59.69 144.94
Quartile
3 207.34 198.46 222.20 97.94 215.83
(b) Computation of standard deviation, range and coefficient of variation of every publisher
Pearson
education
John wiley and
Sons Cengage Learning
Oxford
university press
McGraw Hill
Education
Standard
deviation 72.13 87.71 56.40 36.99 70.89
Max 293.33 240.08 262.44 154.99 342.59
Min 62.53 15.79 94.86 38.40 112.68
Range 230.80 224.29 167.58 116.59 229.91
Coefficie
nt of
variation 46.04 68.17 30.97 44.55 35.08
(c) Drawing box whisker plot for price of each publisher
Pearson education
7
Paraphrase This Document
Need a fresh take? Get an instant paraphrase of this document with our AI Paraphraser
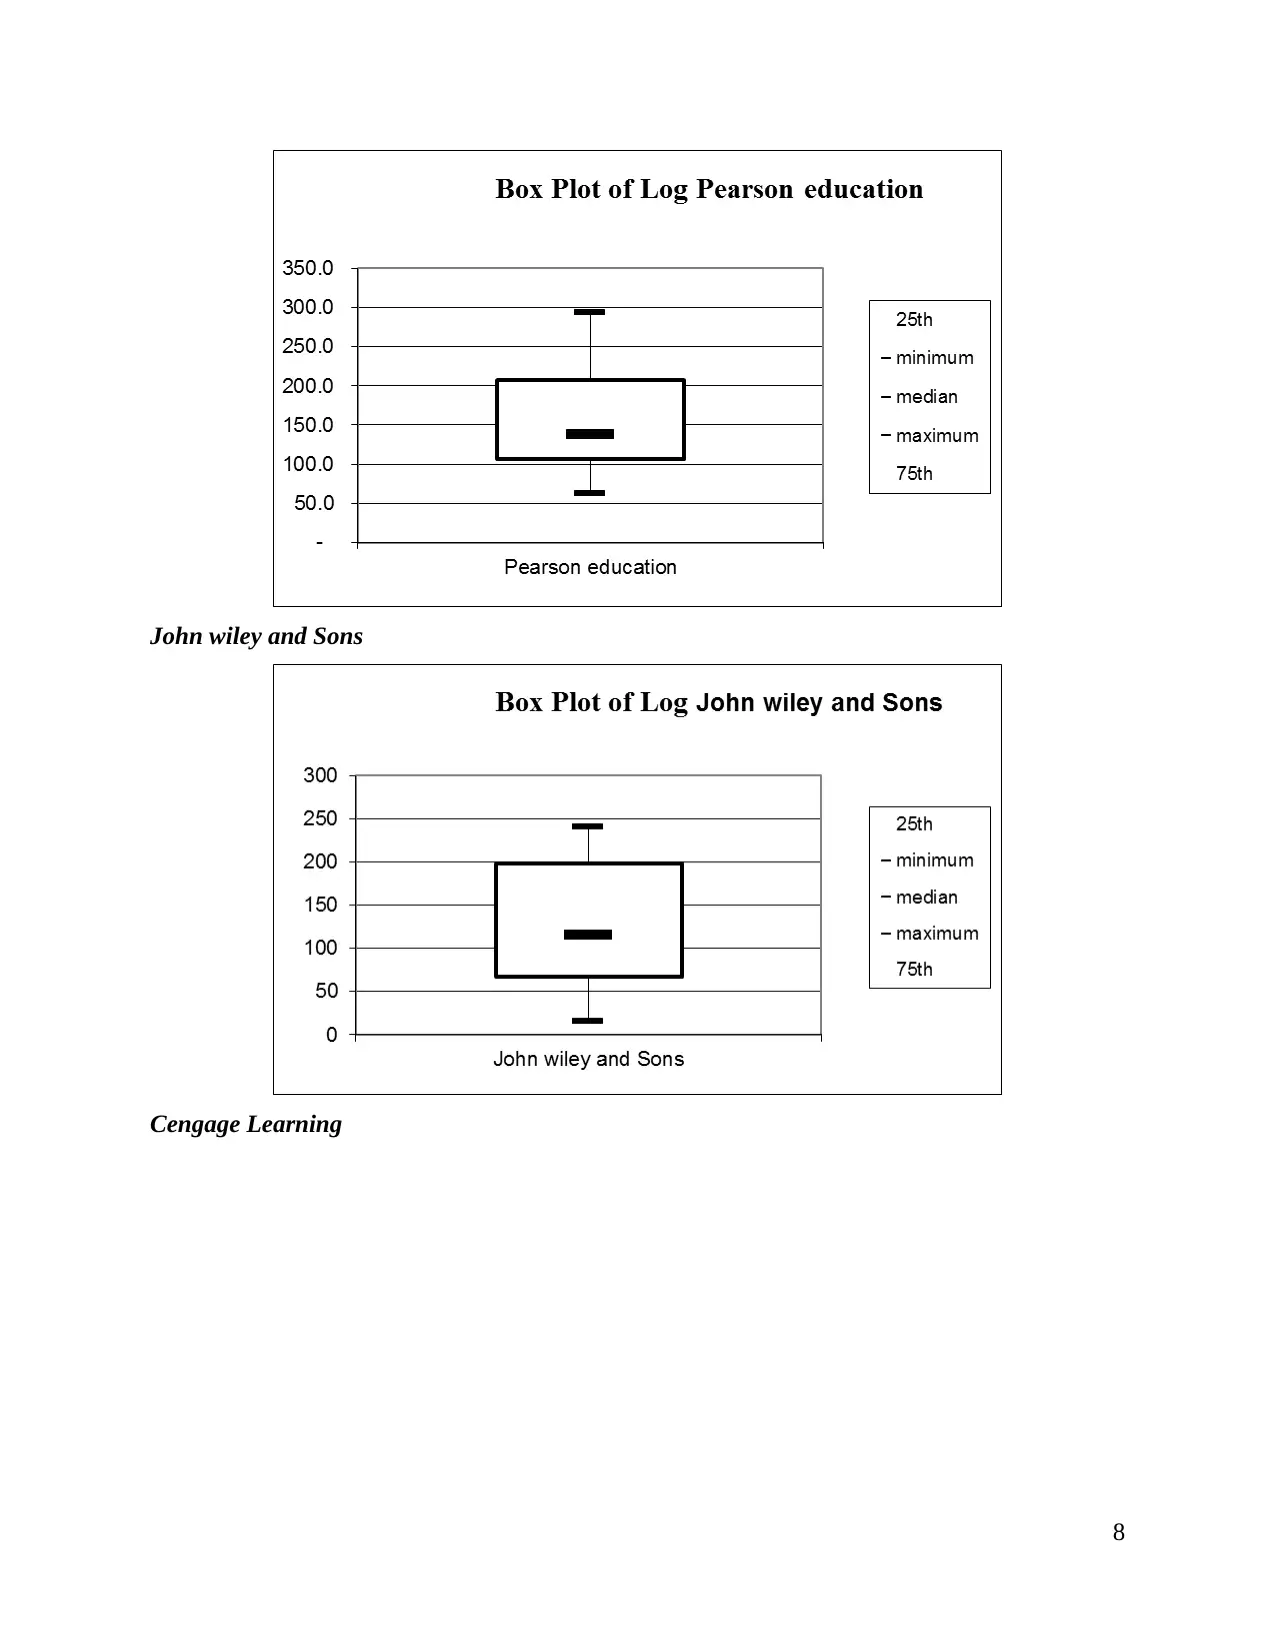
John wiley and Sons
Cengage Learning
8
Cengage Learning
8
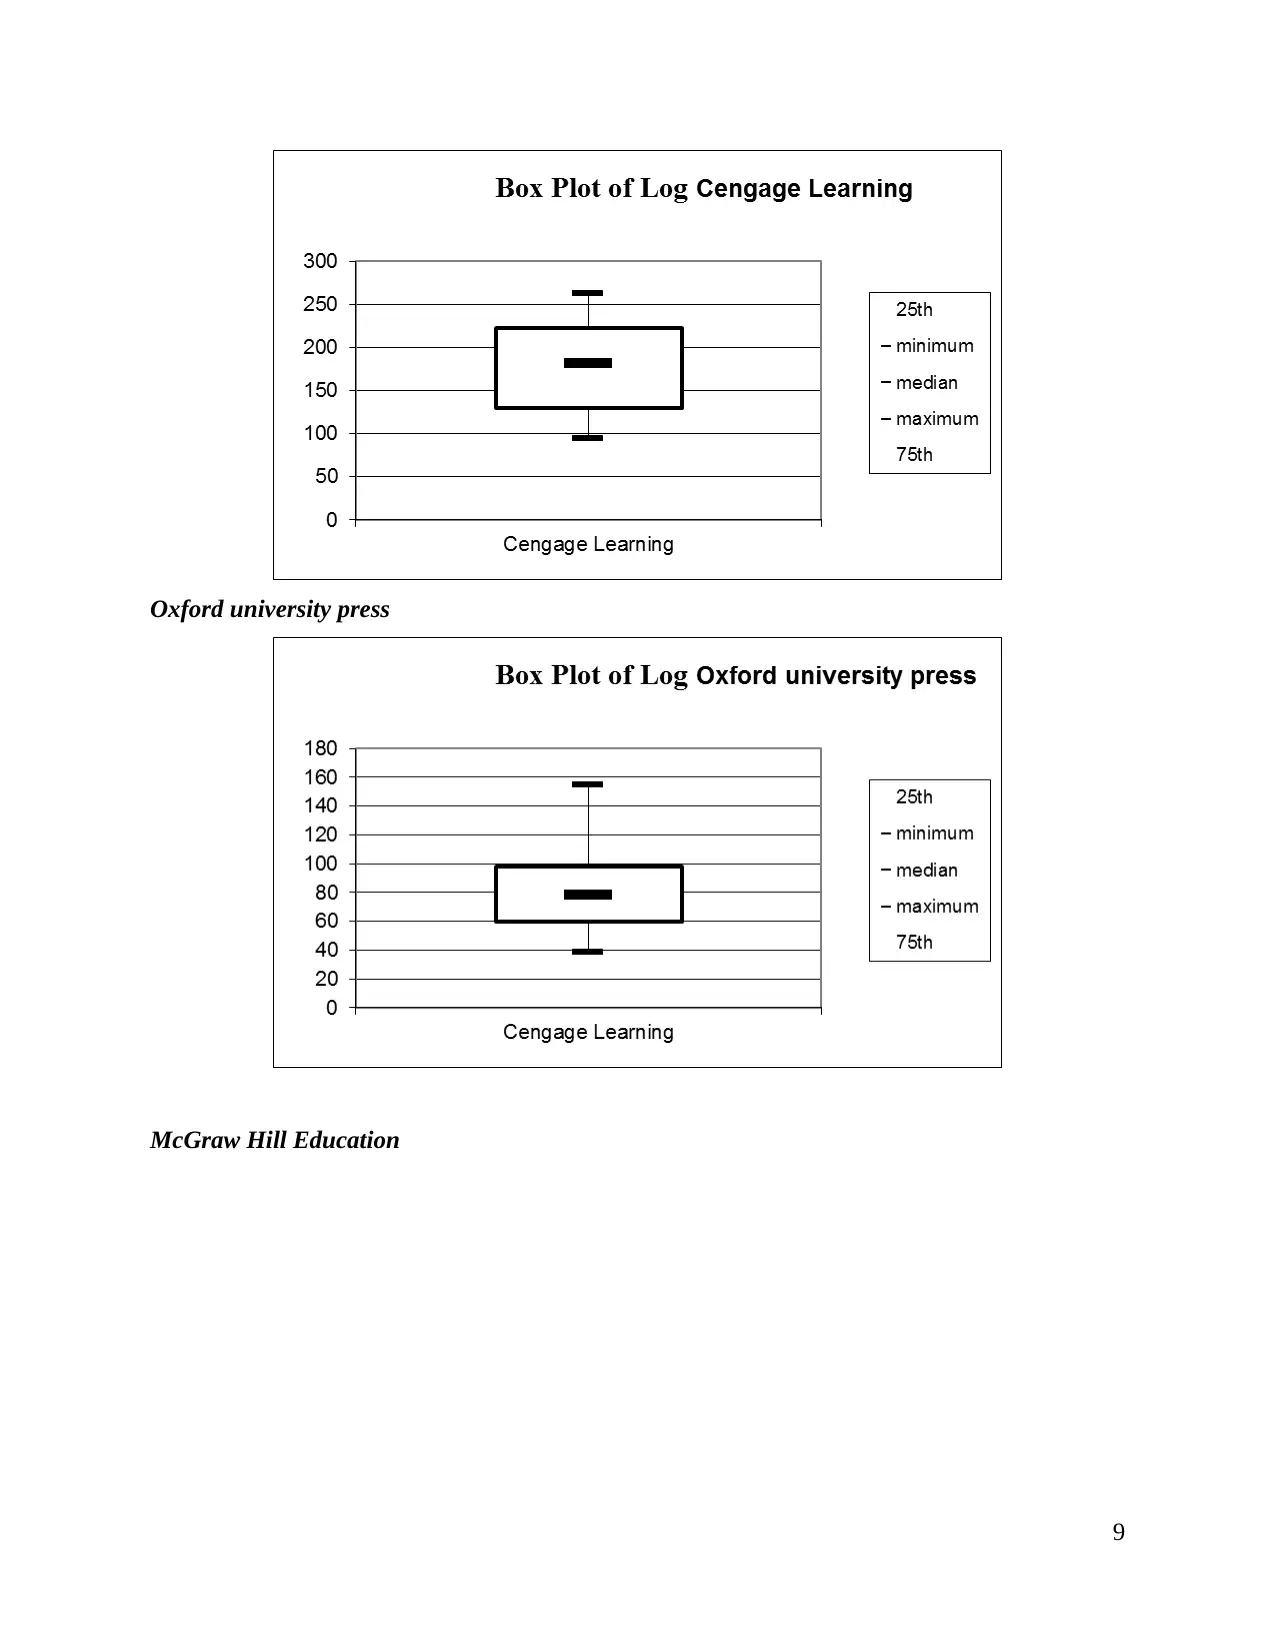
Oxford university press
McGraw Hill Education
9
McGraw Hill Education
9
⊘ This is a preview!⊘
Do you want full access?
Subscribe today to unlock all pages.
Trusted by 1+ million students worldwide
1 out of 19