Applied Quantitative Methods Solutions
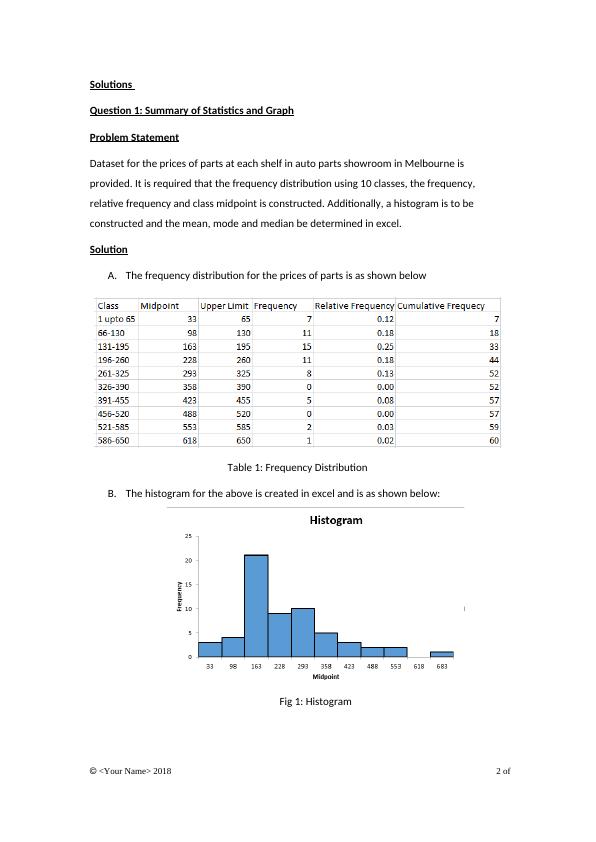
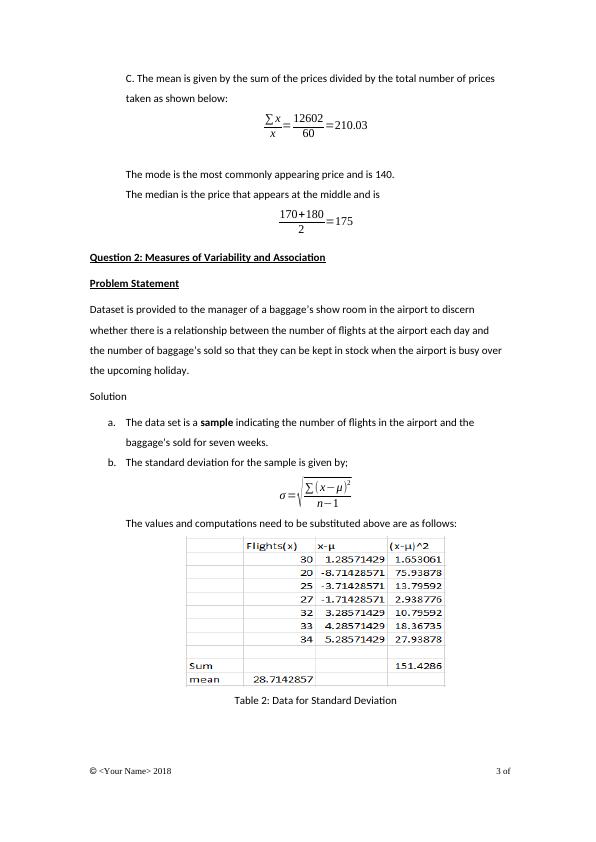
This is a group assignment for the Applied Quantitative Methods course at Holmes Institute. The assignment involves analyzing data on the prices of parts at an auto parts showroom in Melbourne using summary statistics and graphs.
12 Pages2070 Words487 Views
Added on 2023-06-04
About This Document
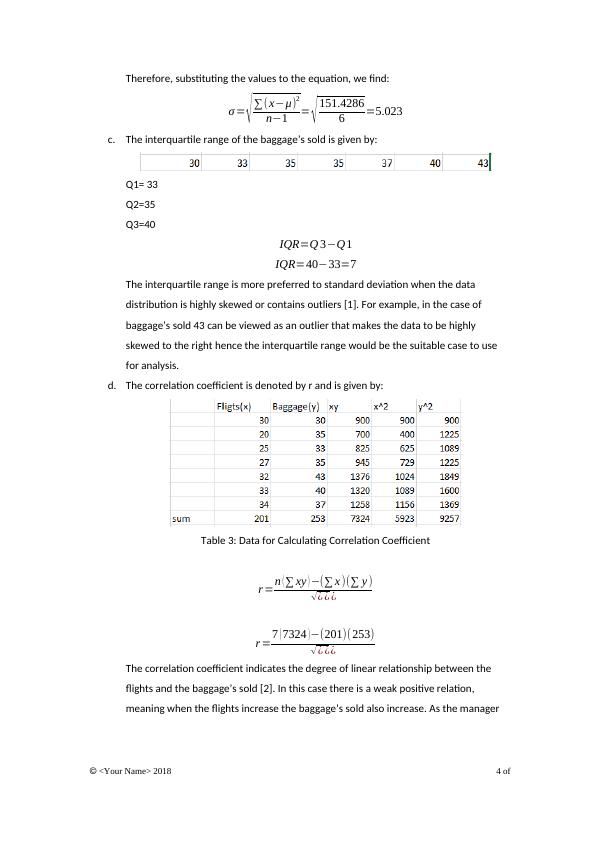
This document contains detailed solutions for problems related to statistics, probability, linear regression and more for the subject Applied Quantitative Methods. It includes tables, graphs and formulas for better understanding. The solutions are provided by an expert and can be accessed on Desklib along with other study material.
Applied Quantitative Methods Solutions
This is a group assignment for the Applied Quantitative Methods course at Holmes Institute. The assignment involves analyzing data on the prices of parts at an auto parts showroom in Melbourne using summary statistics and graphs.
Added on 2023-06-04
ShareRelated Documents

End of preview
Want to access all the pages? Upload your documents or become a member.
Applied Quantitative Methods: Analysis of Relationship between Flights and Baggage Sales, Contingency Table Probability
|9
|1746
|197
Applied Quantitative Methods - Frequency Distribution, Regression Equation, Probability
|10
|1114
|70
Applied Quantitative Methods - Desklib
|14
|1060
|341
Applied Quantitative Methods Assignment 2
|19
|1391
|74
SEO Title: Desklib - Online Library for Study Material with Solved Assignments
|12
|2196
|152
Applied Quantitative Methods - Solved Assignments and Essays
|14
|721
|155