HA1011 Applied Quantitative Methods: Detailed Assignment Solution
VerifiedAdded on 2021/06/18
|13
|838
|88
Homework Assignment
AI Summary
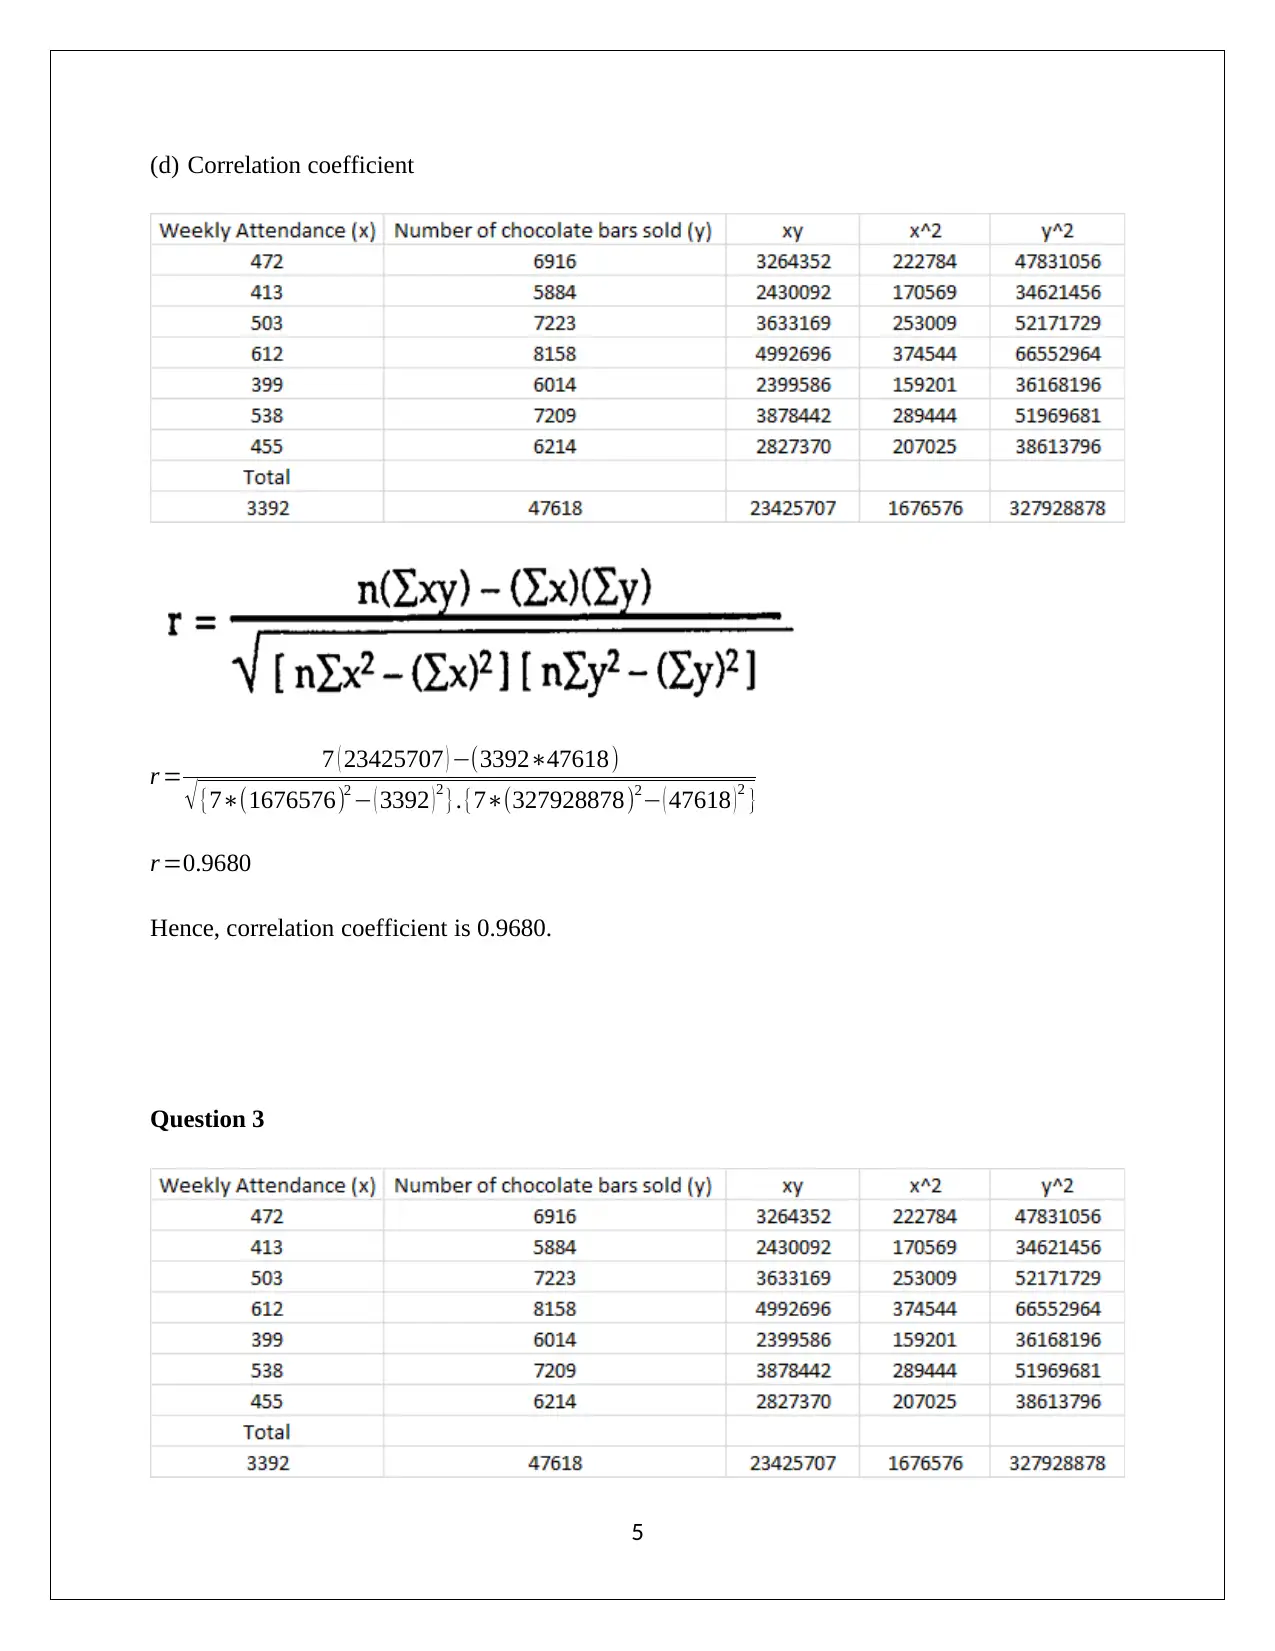
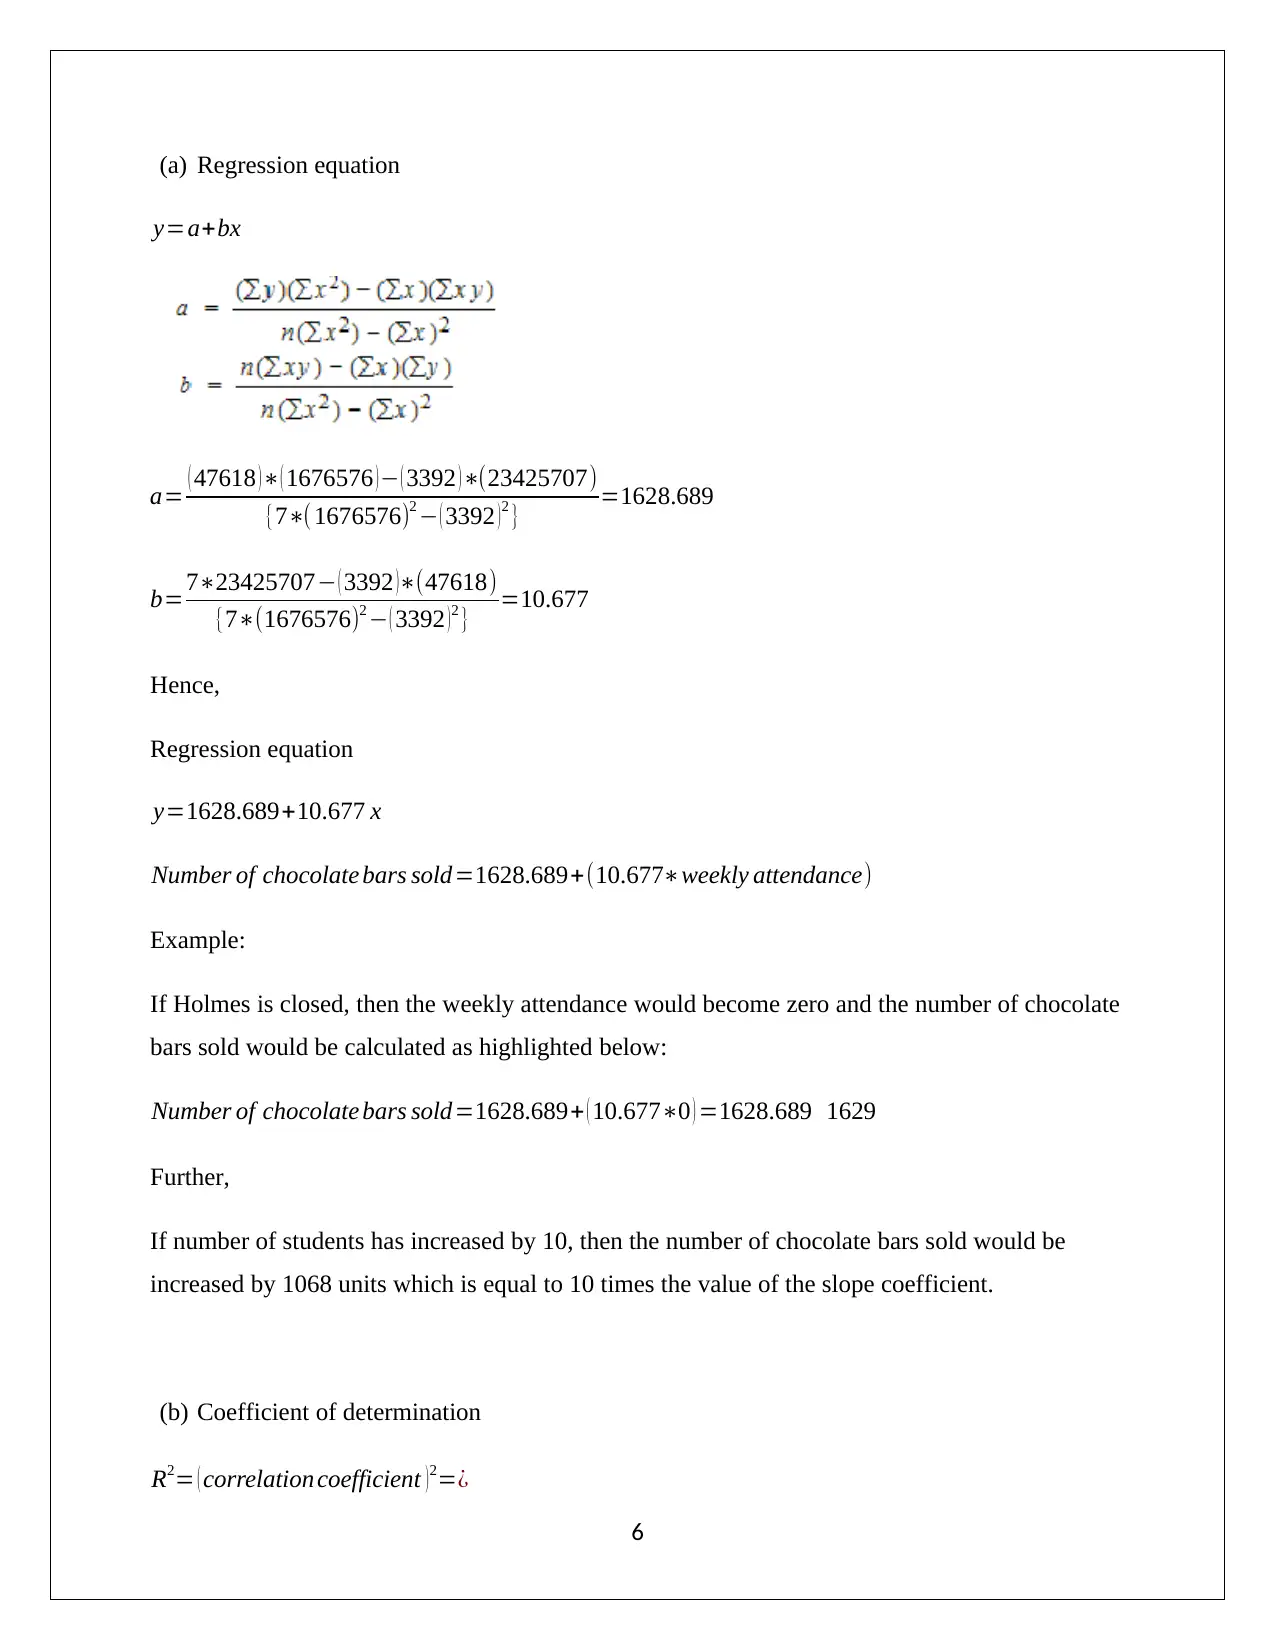
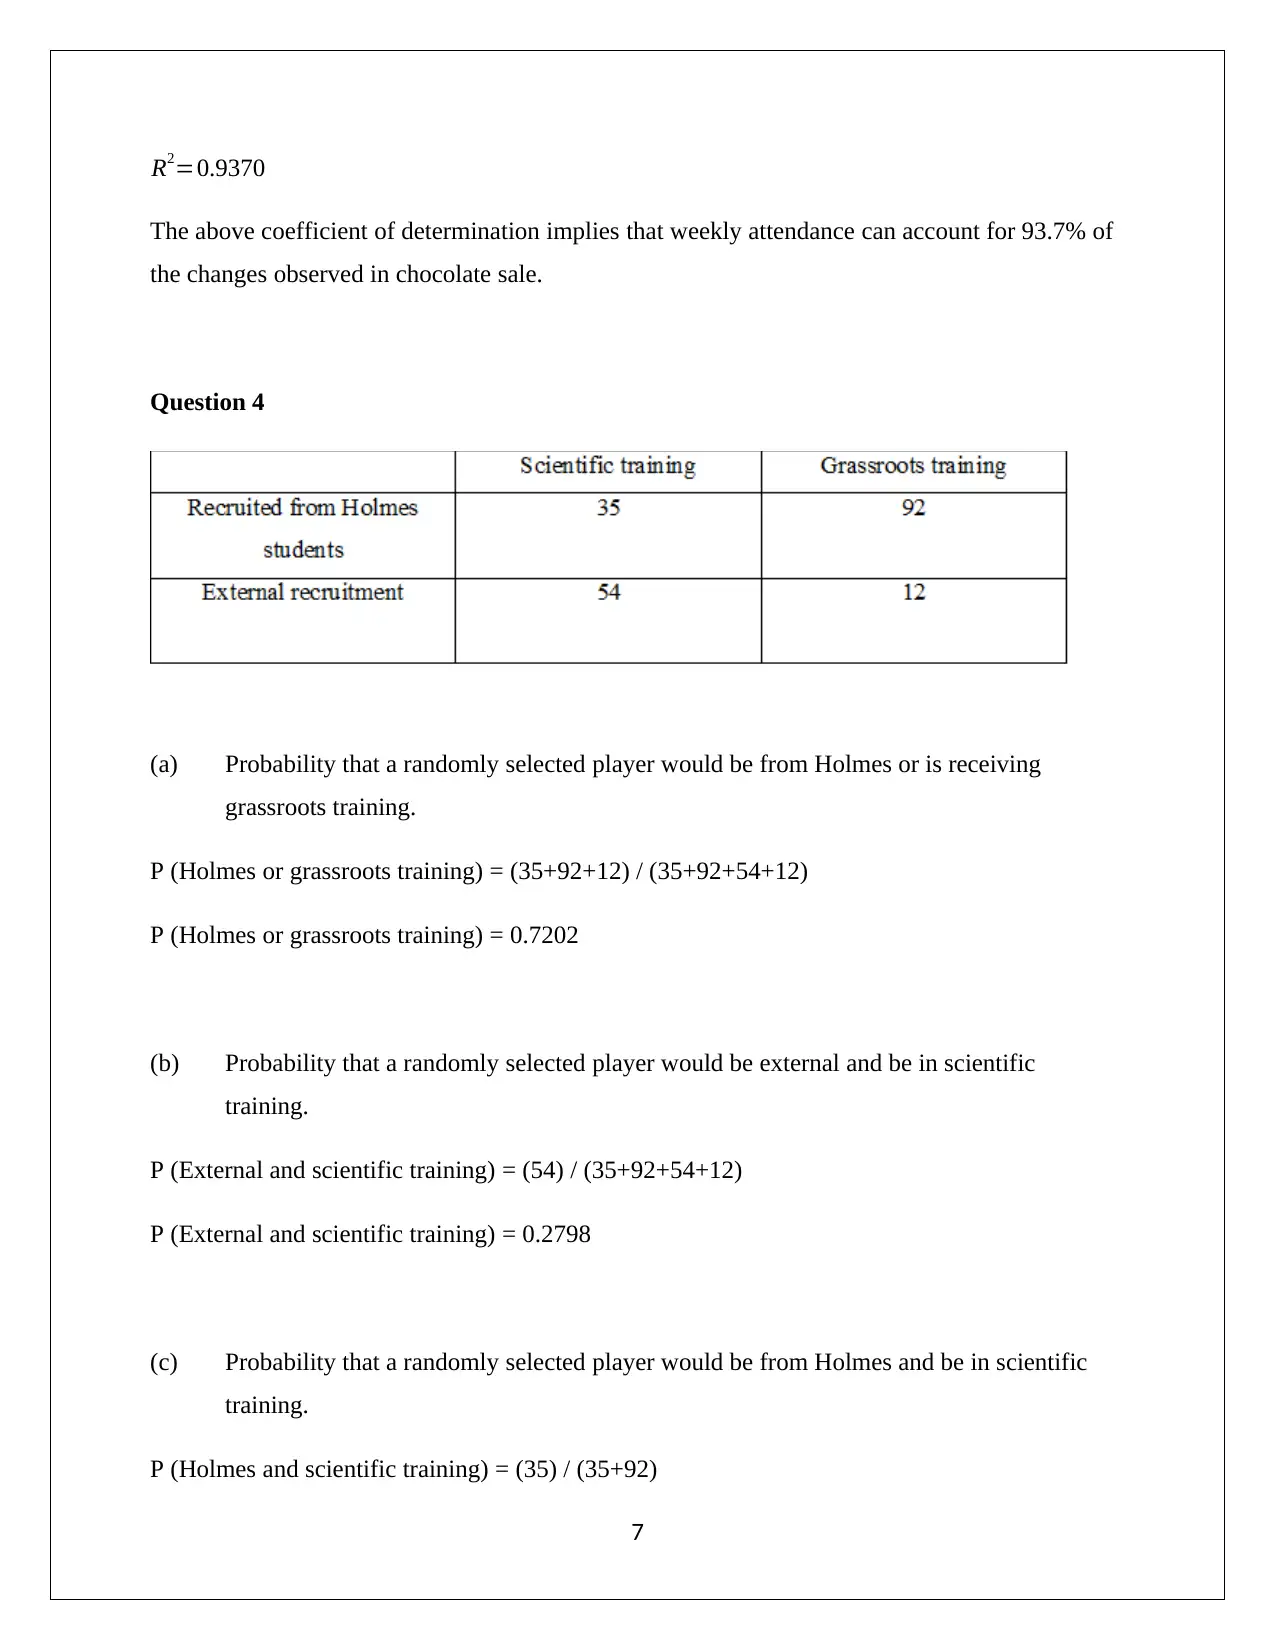
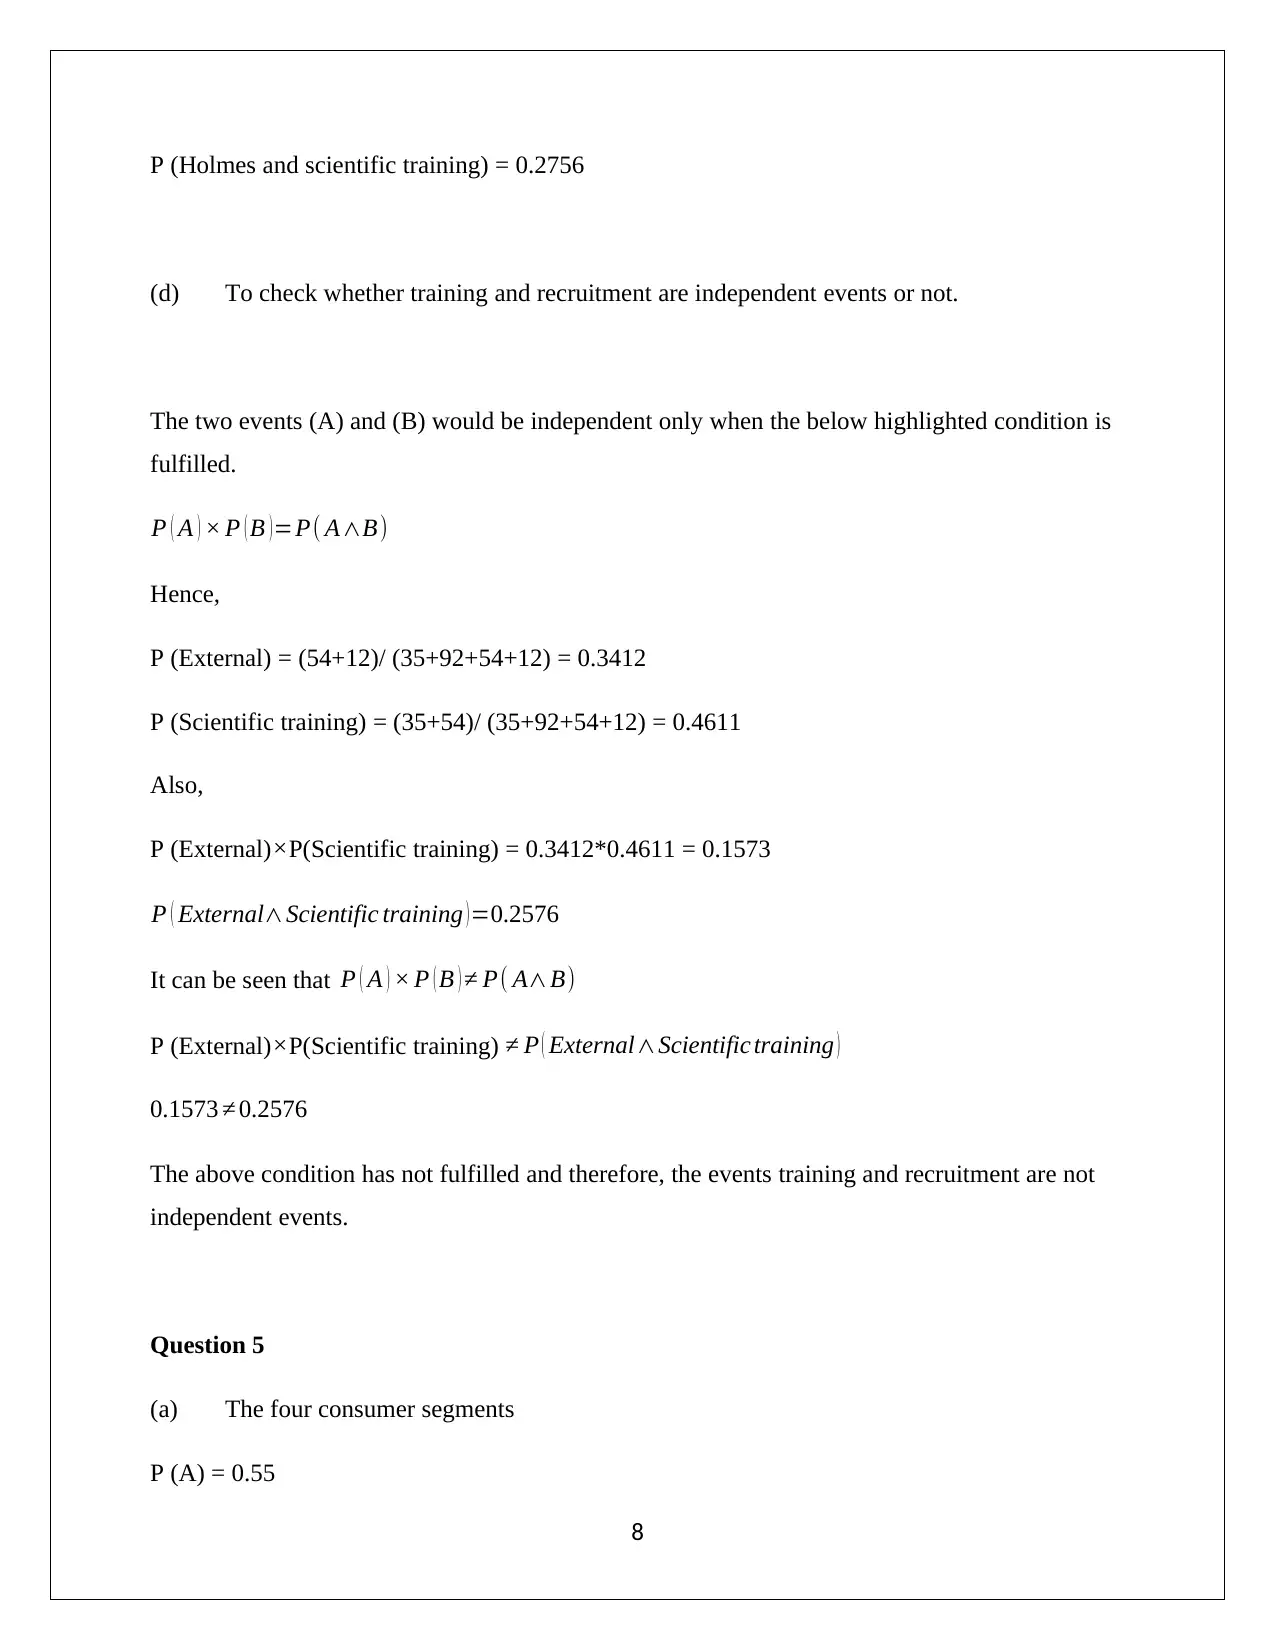
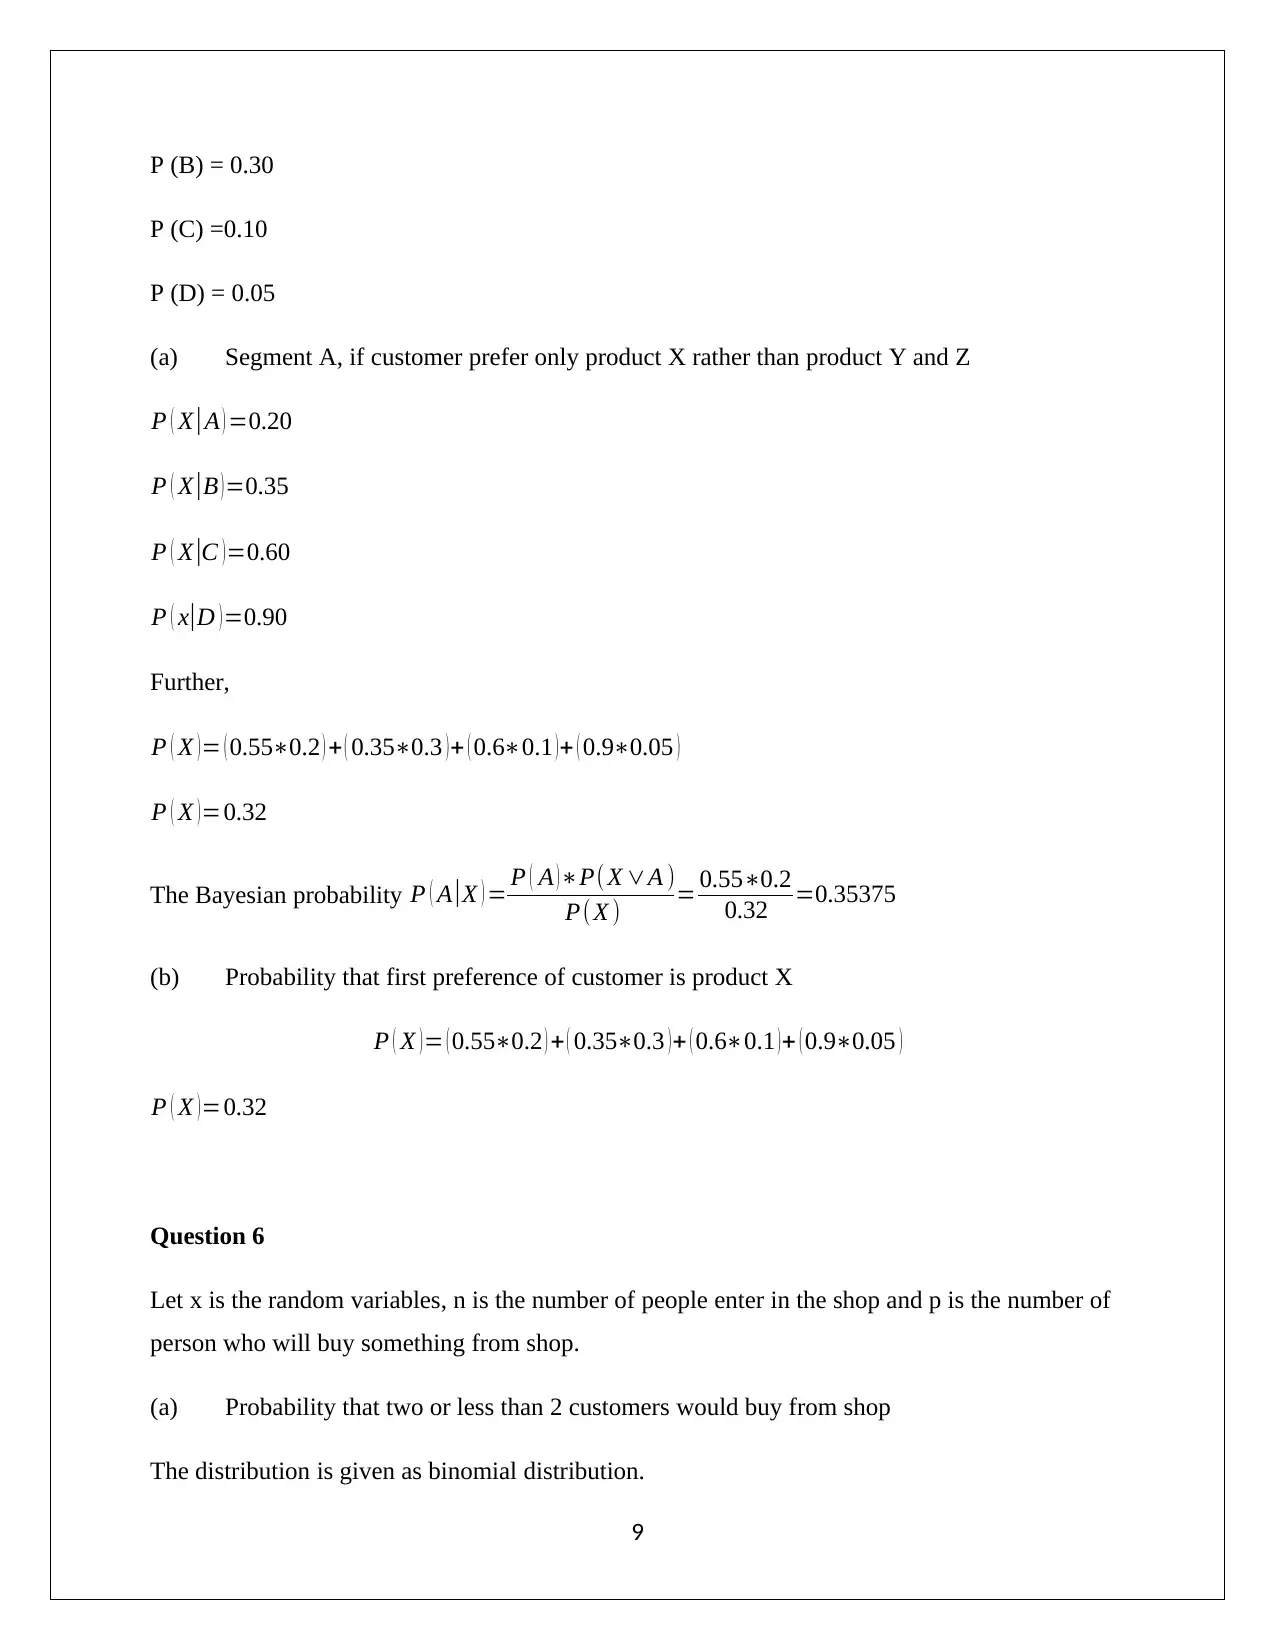
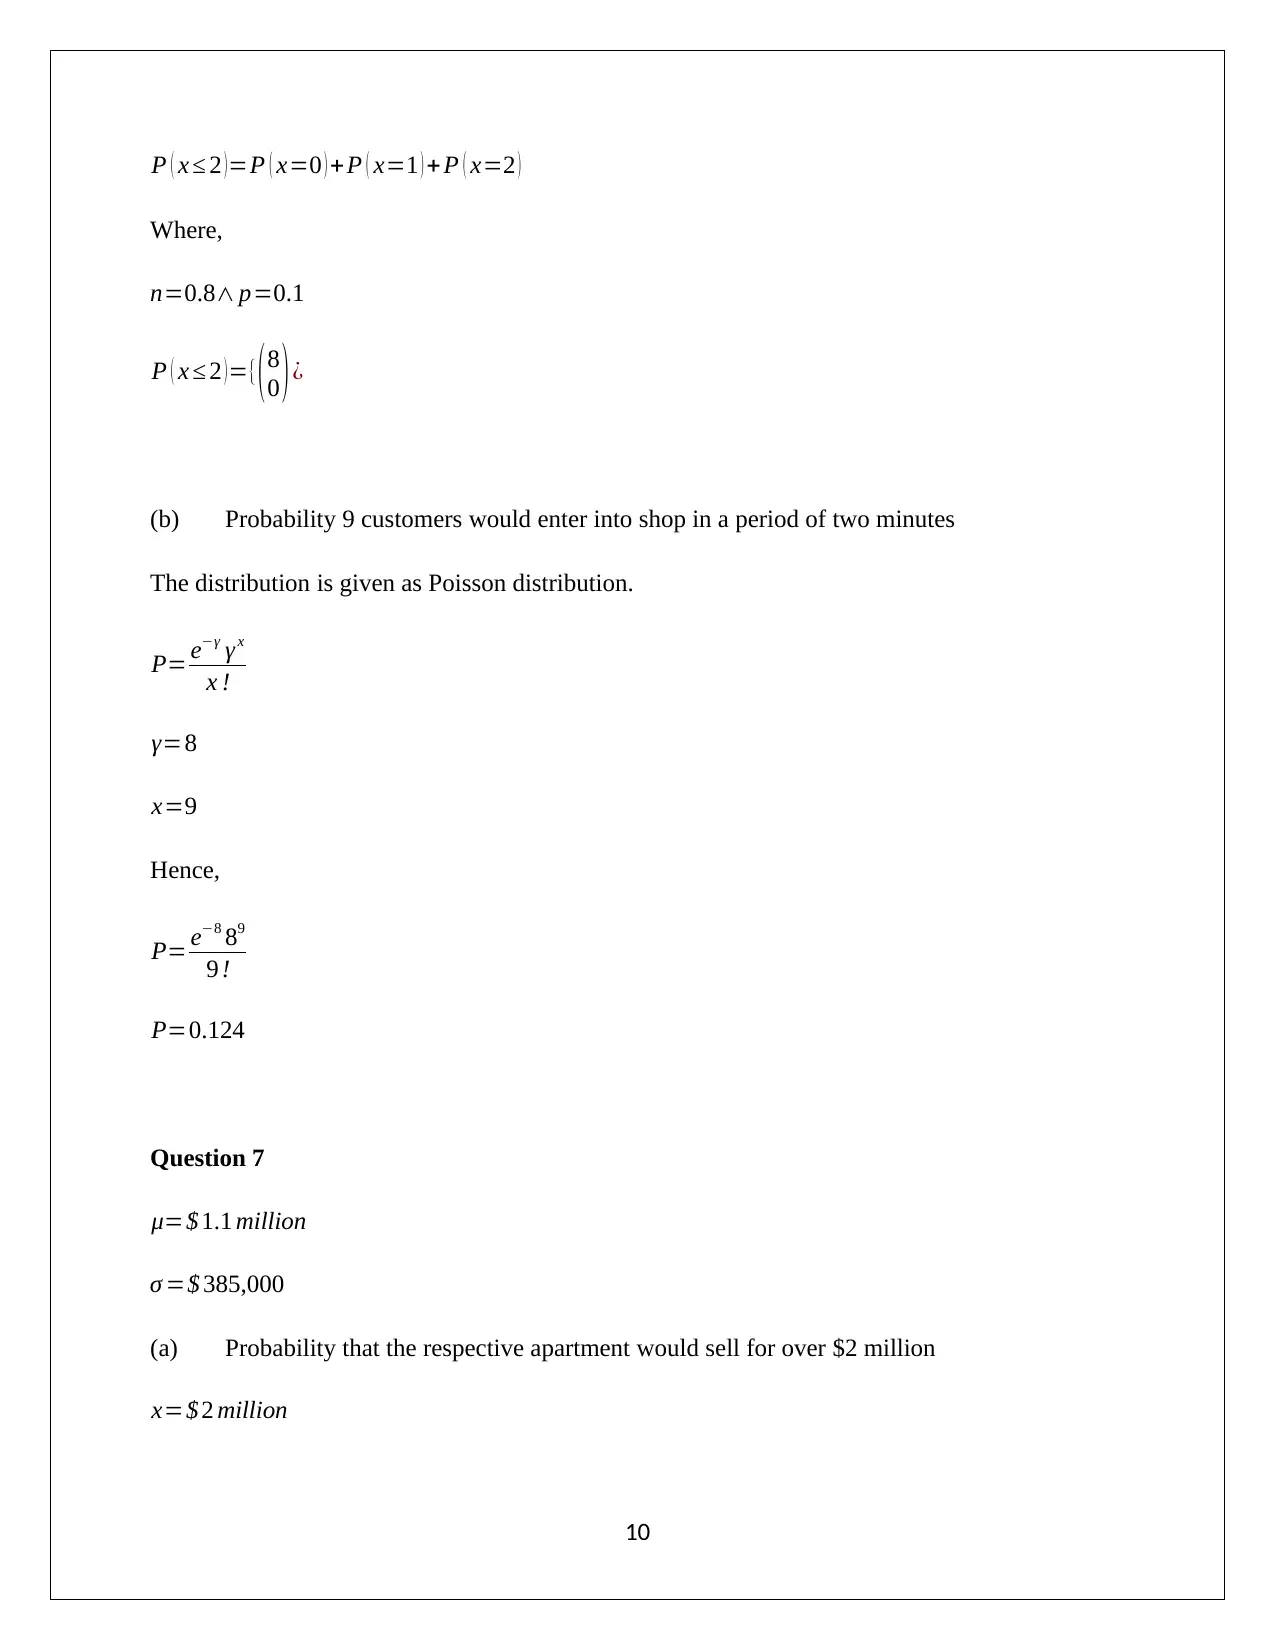
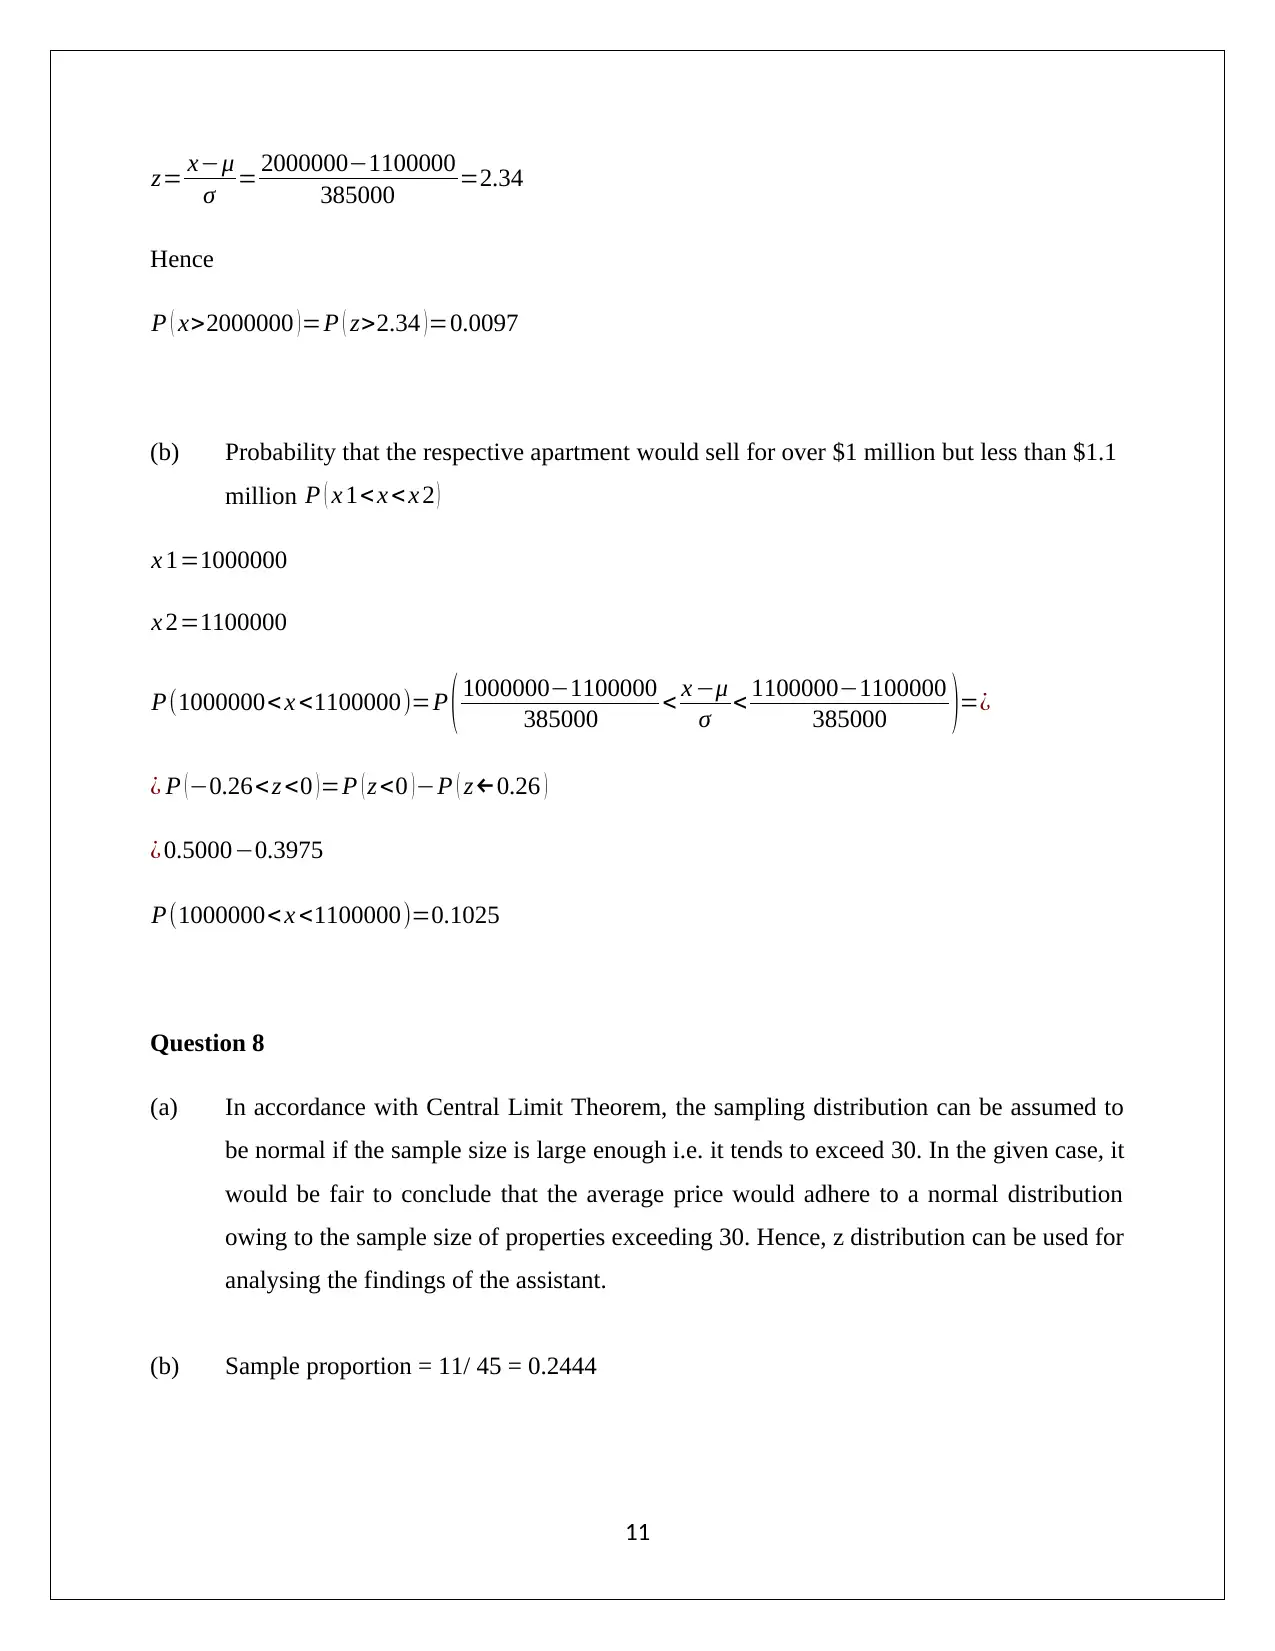
This document provides a detailed solution to an assignment on Applied Quantitative Methods, covering topics such as frequency distribution, histograms, mean, median, mode, standard deviation, interquartile range, correlation coefficient, regression analysis, probability, Bayesian probability, binomial and Poisson distributions, and hypothesis testing. The solution includes calculations and interpretations for various statistical problems, such as analyzing weekly attendance and chocolate bar sales, determining probabilities related to player recruitment and training, and assessing consumer preferences for different products. Furthermore, the assignment applies statistical concepts to real-world scenarios, including property sales and customer behavior, demonstrating the practical application of quantitative methods. Desklib offers a wide range of study resources, including past papers and solved assignments, to support students in their academic endeavors.

1 out of 13
Related Documents


Your All-in-One AI-Powered Toolkit for Academic Success.
+13062052269
info@desklib.com
Available 24*7 on WhatsApp / Email
![[object Object]](/_next/static/media/star-bottom.7253800d.svg)
Copyright © 2020–2026 A2Z Services. All Rights Reserved. Developed and managed by ZUCOL.