Healthy Life Style Data Analysis
Added on 2022-12-23
21 Pages4018 Words78 Views
Running head: APPLIED STATISTICS SUMMATIVE ASSIGNMENT
1
Healthy Life Style Data Analysis
Student’s Name
Institutional Affiliation
1
Healthy Life Style Data Analysis
Student’s Name
Institutional Affiliation
APPLIED STATISTICS SUMMATIVE ASSIGNMENT 2
Healthy Life Style Data Analysis
Background
Statistics is a branch of mathematics that deals with data collection, data classification,
data analysis, and its interpretation to make viable conclusions. It is divided into descriptive and
inferential statistics. Descriptive statistics gives the general summaries and patterns in a dataset
while inferential statistics is concerned with in-depth analysis of data (Gupta & Kapoor, 2019).
Statistics is highly used in many sectors in any economy for planning and decision making. One
of the many sectors it is used is public health. It is necessarily used in as an assessment function.
The government through the ministry of health is able to identify risks, threats, prepare budgets
and make the planning of programs to be carried out. One of the central parts of public health is
the population. Statistics, therefore, will give incites on how to study the population and interpret
data. This involves numbers that describe the population and the science of analyzing concepts
from the population. In general, statistics form part of the vital signs in the field of public health.
The government needs to collect data of its population from birth (birth certificate issued) to
dying of a citizen. A periodic census is also carried out. In health statistics, this information can
be used to compute birth rate, death rates, the fertility rate among others. Health statistics are
vital in providing insight for health policies, identification of problems in the population,
administrative decision making (Bailey,1977).Program planning among others. This will
eventually lead to the provision of better health.
In this study, a random sample of individuals was taken and included in the collection of
data for public health analysis and report. The sample consisted of 81 individuals. The
individuals were informed of the purpose of the survey and encouraged to sign a consent form
before participating in the survey. Details of their age, gender, height, smoking status, location,
APPLIED STATISTICS SUMMATIVE ASSIGNMENT 3
health literacy, diabetes status, asthma status and weight before and after intervention were taken
and recorded for analysis. A fraction of the sample was exposed to intervention while the other
group had no treatment. This was important in showing the effect of treatment given to the
intervention group. This study is aimed at ensuring that healthy lifestyles are adopted by
university students. This will be achieved through the improvement in the health literacy levels
and reduction of weights to ensure students remain fit.
Data analysis was done using Statistical Package for Social Sciences software. Both
descriptive and inferential statistics were incorporated into the analysis. Descriptive summaries
were used to show the patterns and summaries of the data such as measures of central tendency
(King'oriah, 2012). Inferential statistics were important in carrying of an in-depth analysis of the
data points. This ranges from the t-test, regression analysis and analysis of the variance.
Scale Reliability
The reliability and validity of the scale are important aspects of ensuring that any research is free
from the random. Reliability is the nature of research portraying similar outputs when recurring
tests are carried out on a set of questions and analyzed statements. This can be done through the
test-retest reliability technique.
According to Tavakol & Dennick (2011), internal consistency is defined as the extent to
which items that make up the scale tend to measure similar underlying characteristics. The SPSS
software uses Cronbach’s coefficient to measure internal consistency. According to Cooper &
Sun (2012), the Cronbach’s coefficient alpha shows the average correlation that all the variables
that contribute to the scale have on a range of 0 to 1.Avalue that is close to 1 shows greater
reliability level while a value close to 0 depicts a low-reliability value.
APPLIED STATISTICS SUMMATIVE ASSIGNMENT 4
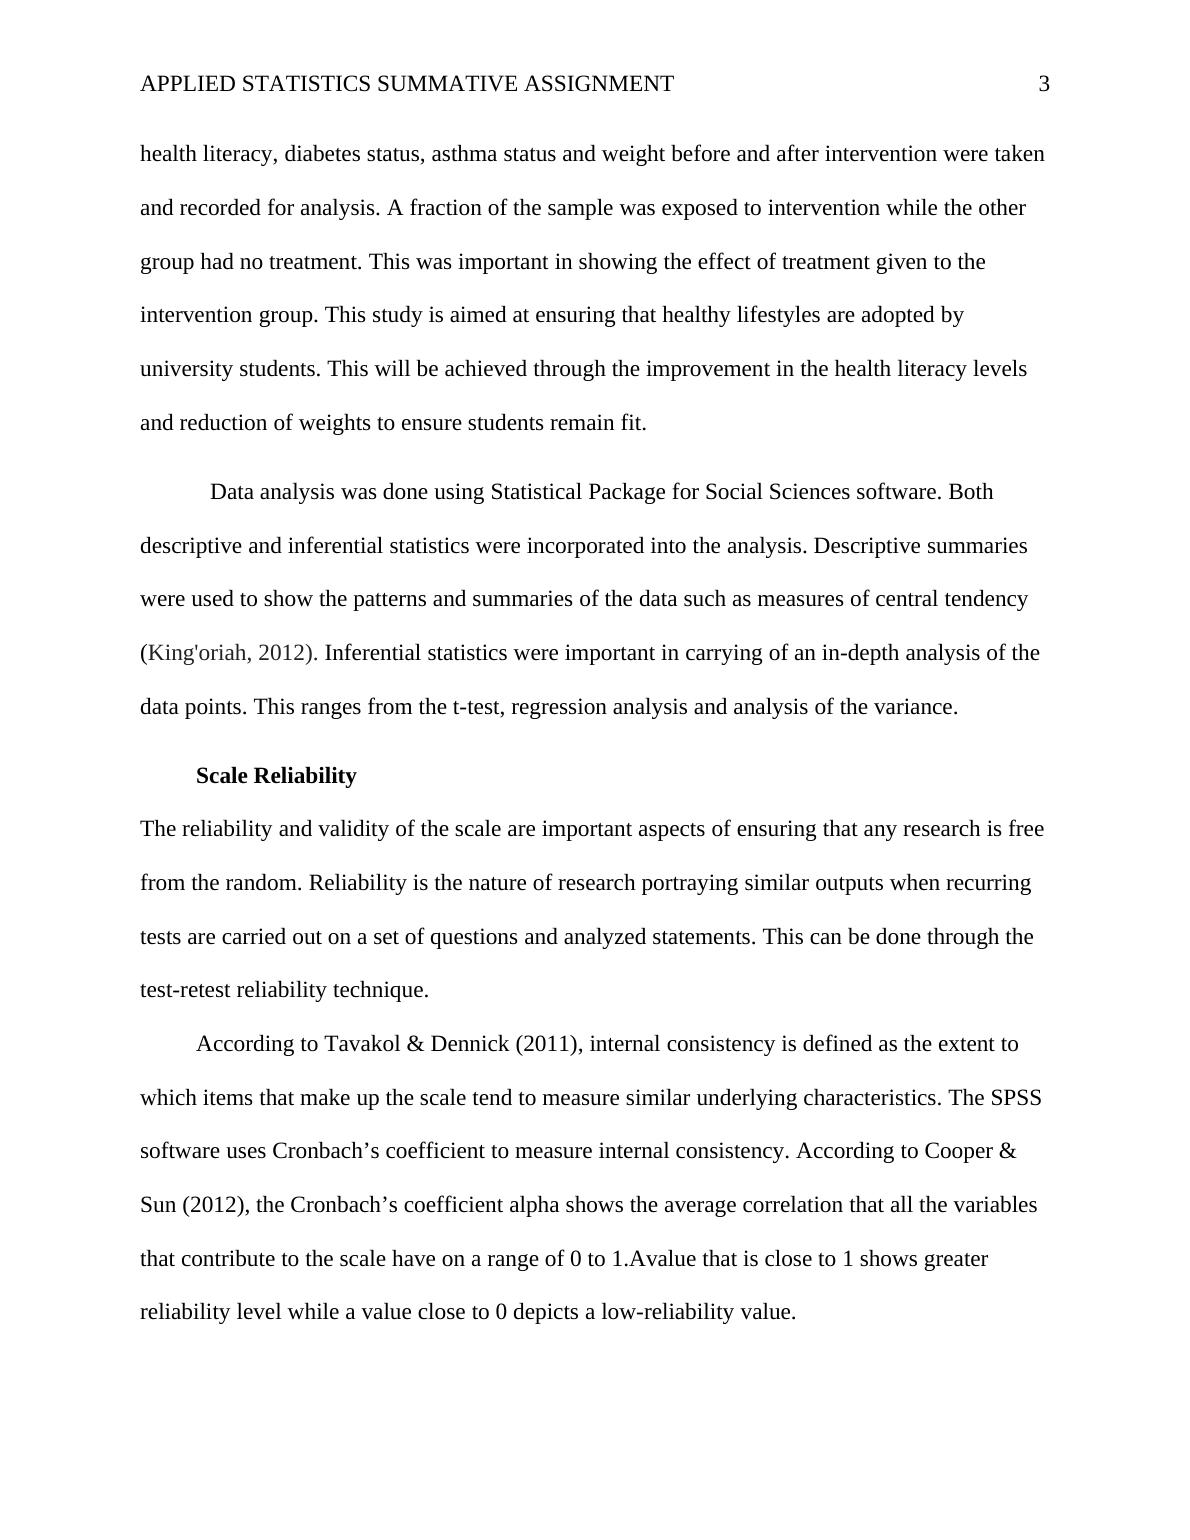
Field (2013) outlines that alpha values of 0.7 and higher implies that the scale is reliable.
From the table below, the Cronbach's Alpha coefficient value is 0.994, which suggests high
reliability.
Table 1: Reliability Statistics
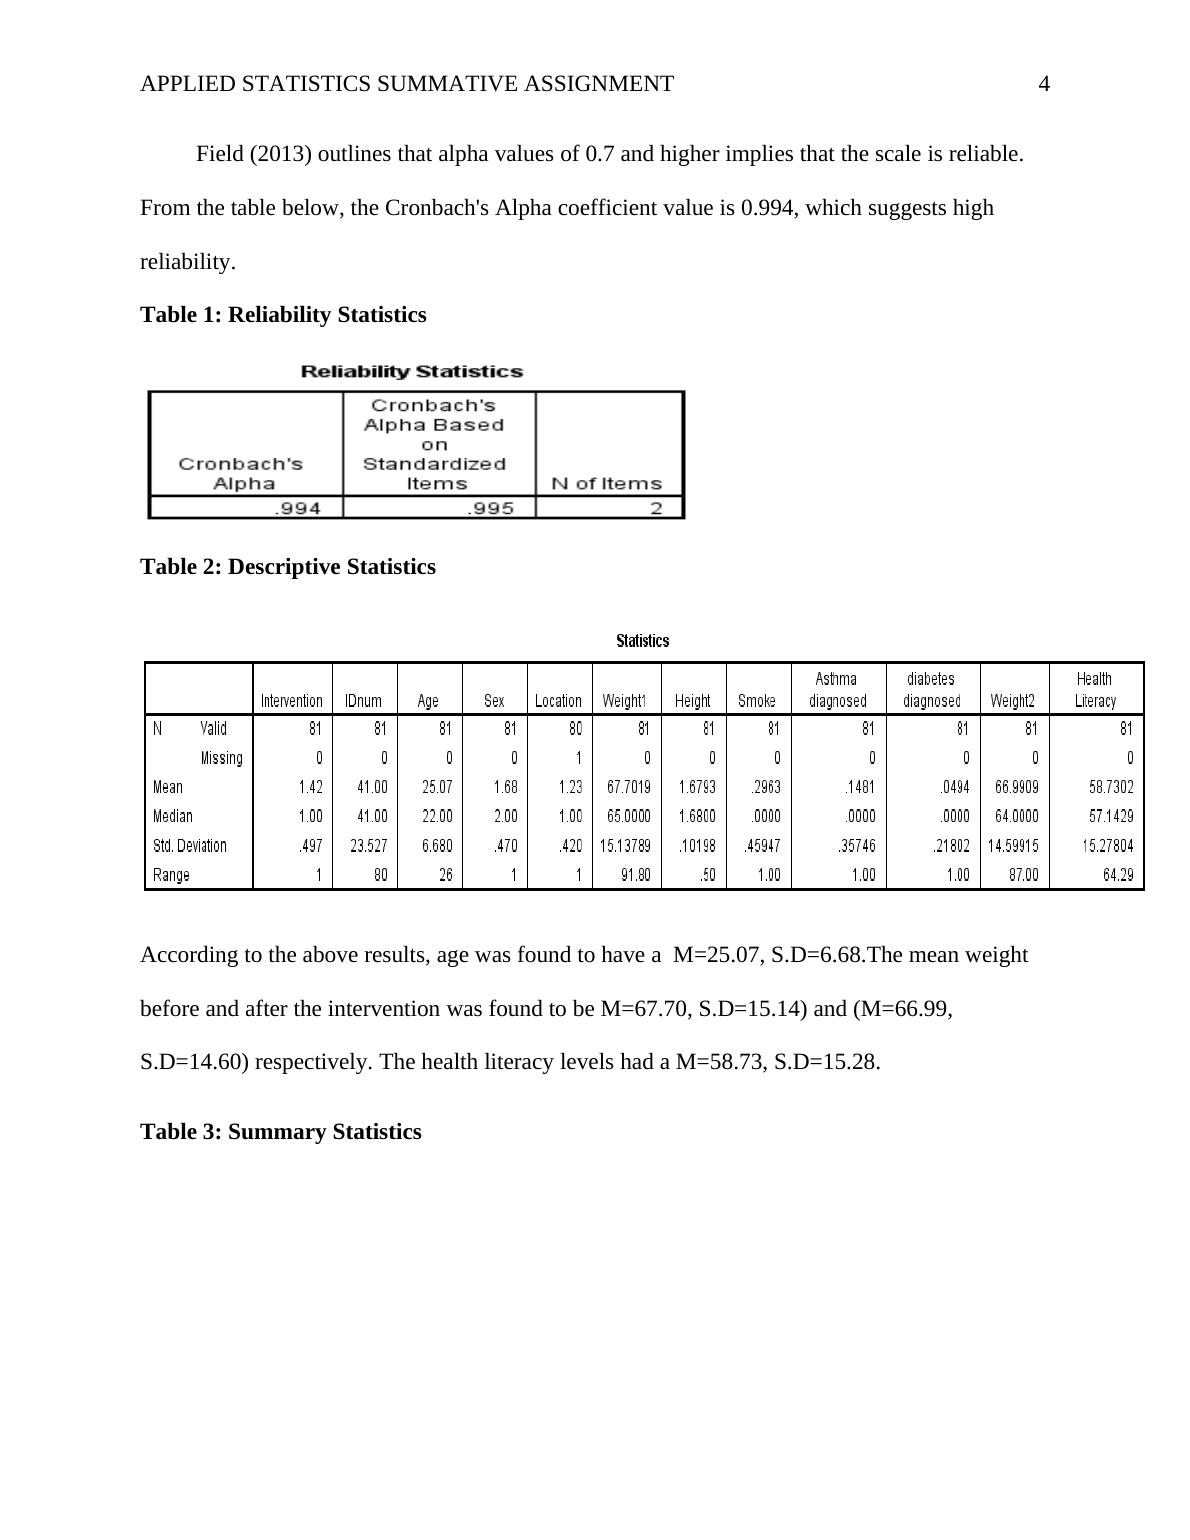
Table 2: Descriptive Statistics
According to the above results, age was found to have a M=25.07, S.D=6.68.The mean weight
before and after the intervention was found to be M=67.70, S.D=15.14) and (M=66.99,
S.D=14.60) respectively. The health literacy levels had a M=58.73, S.D=15.28.
Table 3: Summary Statistics
Field (2013) outlines that alpha values of 0.7 and higher implies that the scale is reliable.
From the table below, the Cronbach's Alpha coefficient value is 0.994, which suggests high
reliability.
Table 1: Reliability Statistics
Table 2: Descriptive Statistics
According to the above results, age was found to have a M=25.07, S.D=6.68.The mean weight
before and after the intervention was found to be M=67.70, S.D=15.14) and (M=66.99,
S.D=14.60) respectively. The health literacy levels had a M=58.73, S.D=15.28.
Table 3: Summary Statistics
APPLIED STATISTICS SUMMATIVE ASSIGNMENT 5
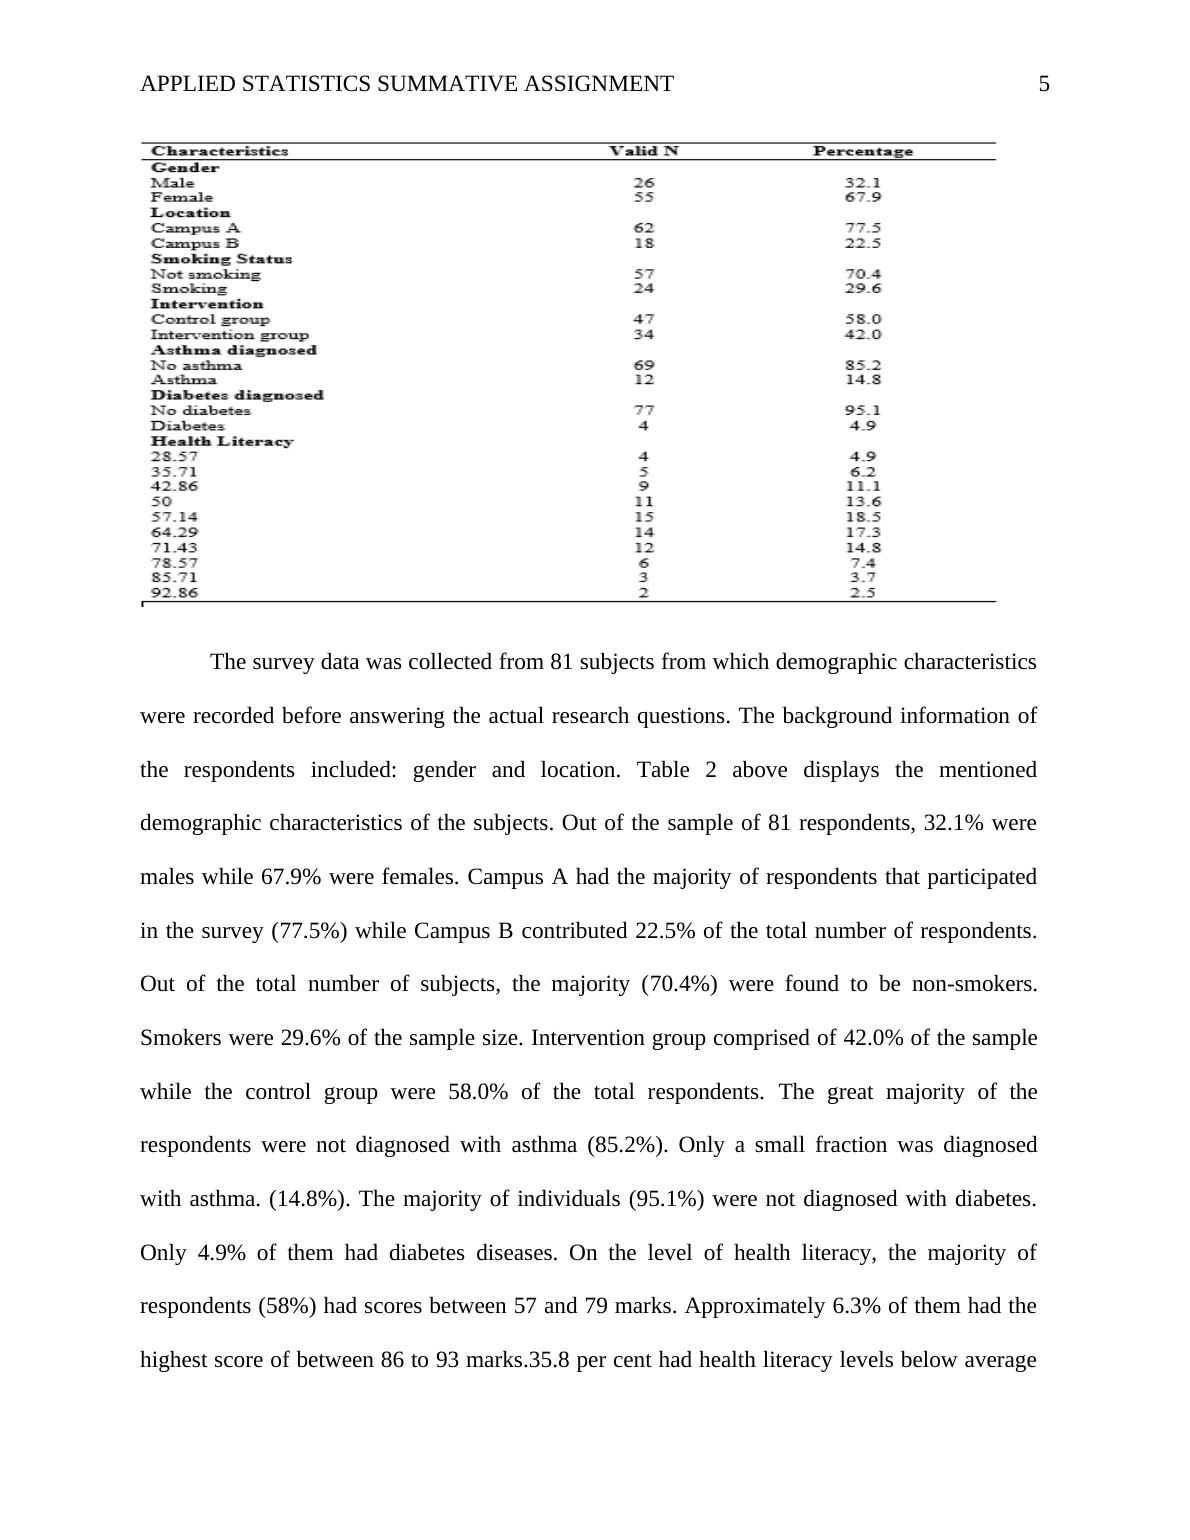
The survey data was collected from 81 subjects from which demographic characteristics
were recorded before answering the actual research questions. The background information of
the respondents included: gender and location. Table 2 above displays the mentioned
demographic characteristics of the subjects. Out of the sample of 81 respondents, 32.1% were
males while 67.9% were females. Campus A had the majority of respondents that participated
in the survey (77.5%) while Campus B contributed 22.5% of the total number of respondents.
Out of the total number of subjects, the majority (70.4%) were found to be non-smokers.
Smokers were 29.6% of the sample size. Intervention group comprised of 42.0% of the sample
while the control group were 58.0% of the total respondents. The great majority of the
respondents were not diagnosed with asthma (85.2%). Only a small fraction was diagnosed
with asthma. (14.8%). The majority of individuals (95.1%) were not diagnosed with diabetes.
Only 4.9% of them had diabetes diseases. On the level of health literacy, the majority of
respondents (58%) had scores between 57 and 79 marks. Approximately 6.3% of them had the
highest score of between 86 to 93 marks.35.8 per cent had health literacy levels below average
APPLIED STATISTICS SUMMATIVE ASSIGNMENT 6
(50).
Question 1: Difference in Healthy literacy between intervention and control
groups.
To find out the differences in health literacy levels across the intervention and control
groups, the Independent sample t-test. This is one type of t-test that is important in making a
comparison of different groups of conditions or people that are being investigated. This is
necessary for finding out if there was a significant difference in health literacy across the two
groups; intervention and control groups. This is done by checking the probabilities of the groups
associated (De Winter, 2013).
This method considered the following assumptions;
Data were obtained in a random manner.
Populations involved are normally distributed
Equality of variance of Samples involved.
Independence of the observations in the data set.
Table 4: Health Literacy Independent Sample T-Test
End of preview
Want to access all the pages? Upload your documents or become a member.
Related Documents
Prevalence and Associated Risk Factors of Hypertension: A Cross-Sectional Study in Urban Varanasilg...
|5
|1013
|285
Advanced Epidemiology and Biostatisticslg...
|16
|3740
|61
Design Methods Analysis in Nursinglg...
|20
|4263
|341
Summary of Statistical Research Methods used in Biostatisticslg...
|9
|2103
|354
Public Health Statistics Report 2022lg...
|11
|1488
|23
Applied Field Methods in Public Health Assignmentlg...
|13
|3098
|249