Approaches to Design the Spreadsheet
VerifiedAdded on 2021/01/08
|7
|1664
|76
AI Summary
Contribute Materials
Your contribution can guide someone’s learning journey. Share your
documents today.

Assignment
Secure Best Marks with AI Grader
Need help grading? Try our AI Grader for instant feedback on your assignments.
Table of Contents
TASK 1............................................................................................................................................1
A. Brief description......................................................................................................................1
B) Sales and expenses of 12 months............................................................................................1
......................................................................................................................................................1
TASK 2............................................................................................................................................3
Approaches to design the spreadsheet.........................................................................................3
TASK 1
A. Brief description
Convenience store is one of the small retail grocery store in UK that is gaining popularity
in recent days. The store offer variety of food items and also non-perishable product which are
labelled and packed in boxes, bottles. Store cover area of about 80*65 so that product can be
organised in proper section and shelves that help customer to reach needed food items. From last
few year store is continuously gaining success and able to earn adequate profit that help to
maintain stability. Manager are planning to expand business through online there they require
more capital to add product as per the current demand of customer in their store.
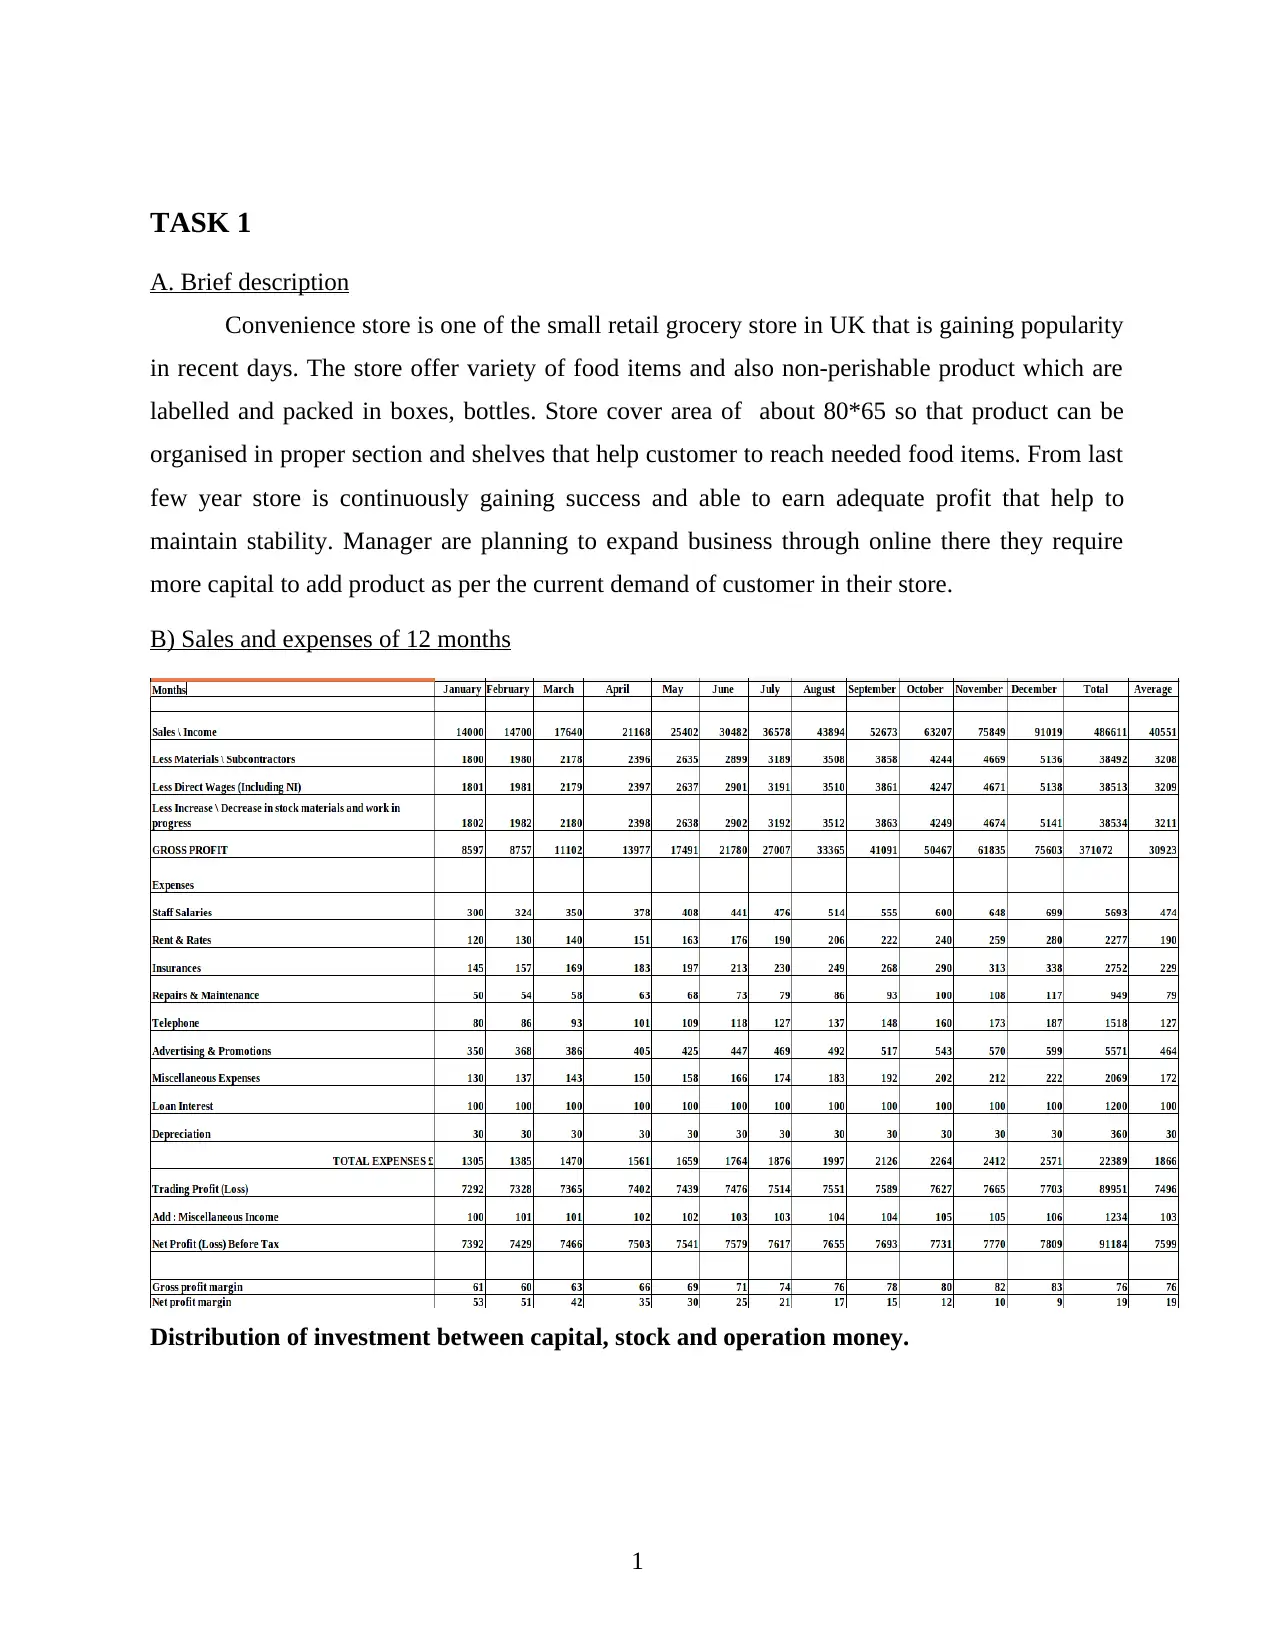
B) Sales and expenses of 12 months
Distribution of investment between capital, stock and operation money.
1
A. Brief description
Convenience store is one of the small retail grocery store in UK that is gaining popularity
in recent days. The store offer variety of food items and also non-perishable product which are
labelled and packed in boxes, bottles. Store cover area of about 80*65 so that product can be
organised in proper section and shelves that help customer to reach needed food items. From last
few year store is continuously gaining success and able to earn adequate profit that help to
maintain stability. Manager are planning to expand business through online there they require
more capital to add product as per the current demand of customer in their store.
B) Sales and expenses of 12 months
Distribution of investment between capital, stock and operation money.
1
20000
50000
30000
Investment
Capital
Stock
Operation money
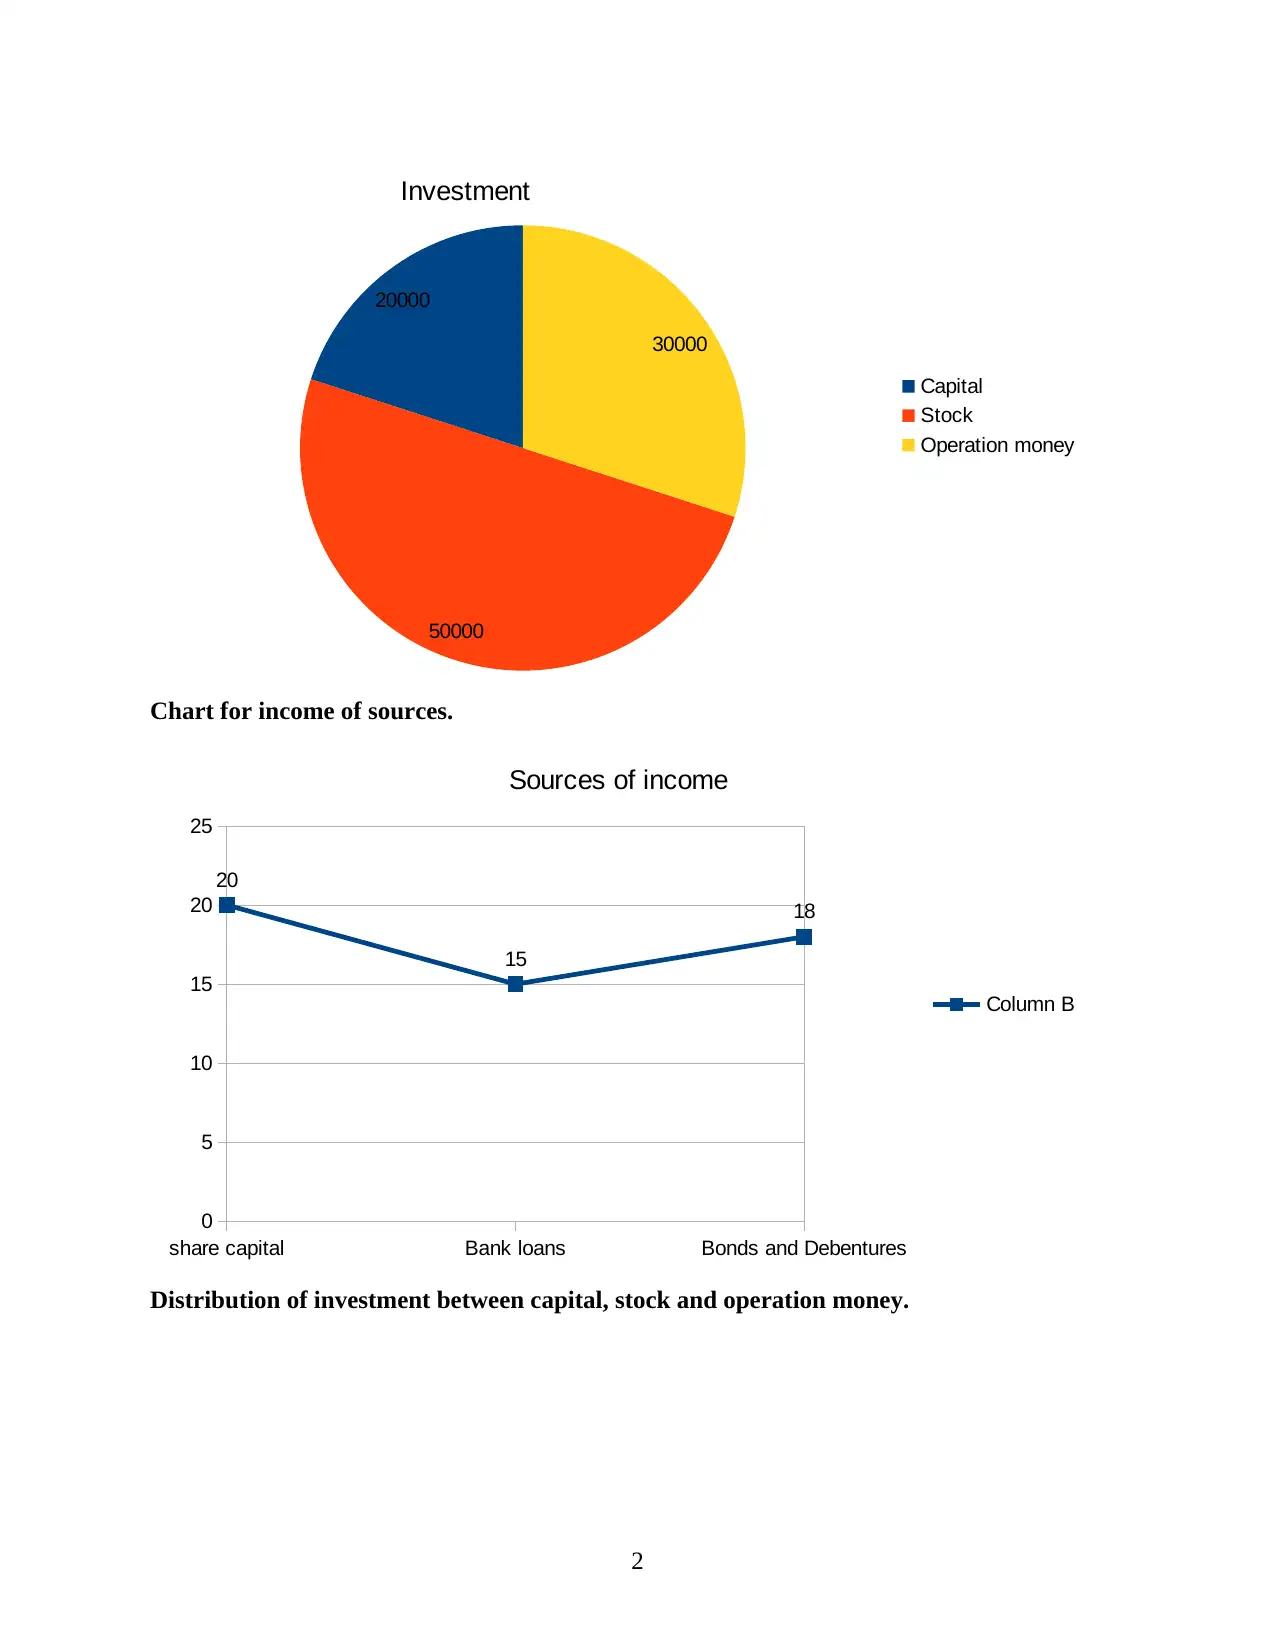
Chart for income of sources.
share capital Bank loans Bonds and Debentures
0
5
10
15
20
25
20
15
18
Sources of income
Column B
Distribution of investment between capital, stock and operation money.
2
50000
30000
Investment
Capital
Stock
Operation money
Chart for income of sources.
share capital Bank loans Bonds and Debentures
0
5
10
15
20
25
20
15
18
Sources of income
Column B
Distribution of investment between capital, stock and operation money.
2
Secure Best Marks with AI Grader
Need help grading? Try our AI Grader for instant feedback on your assignments.
Jan
Feb
Mar
Apr
May
Jun
Jul
Aug
Sep
Oct
Nov
Dec
0 500 1000 1500 2000 2500 3000
1305
1385
1470
1561
1659
1764
1876
1997
2126
2264
2412
2571
Expenses
Column B
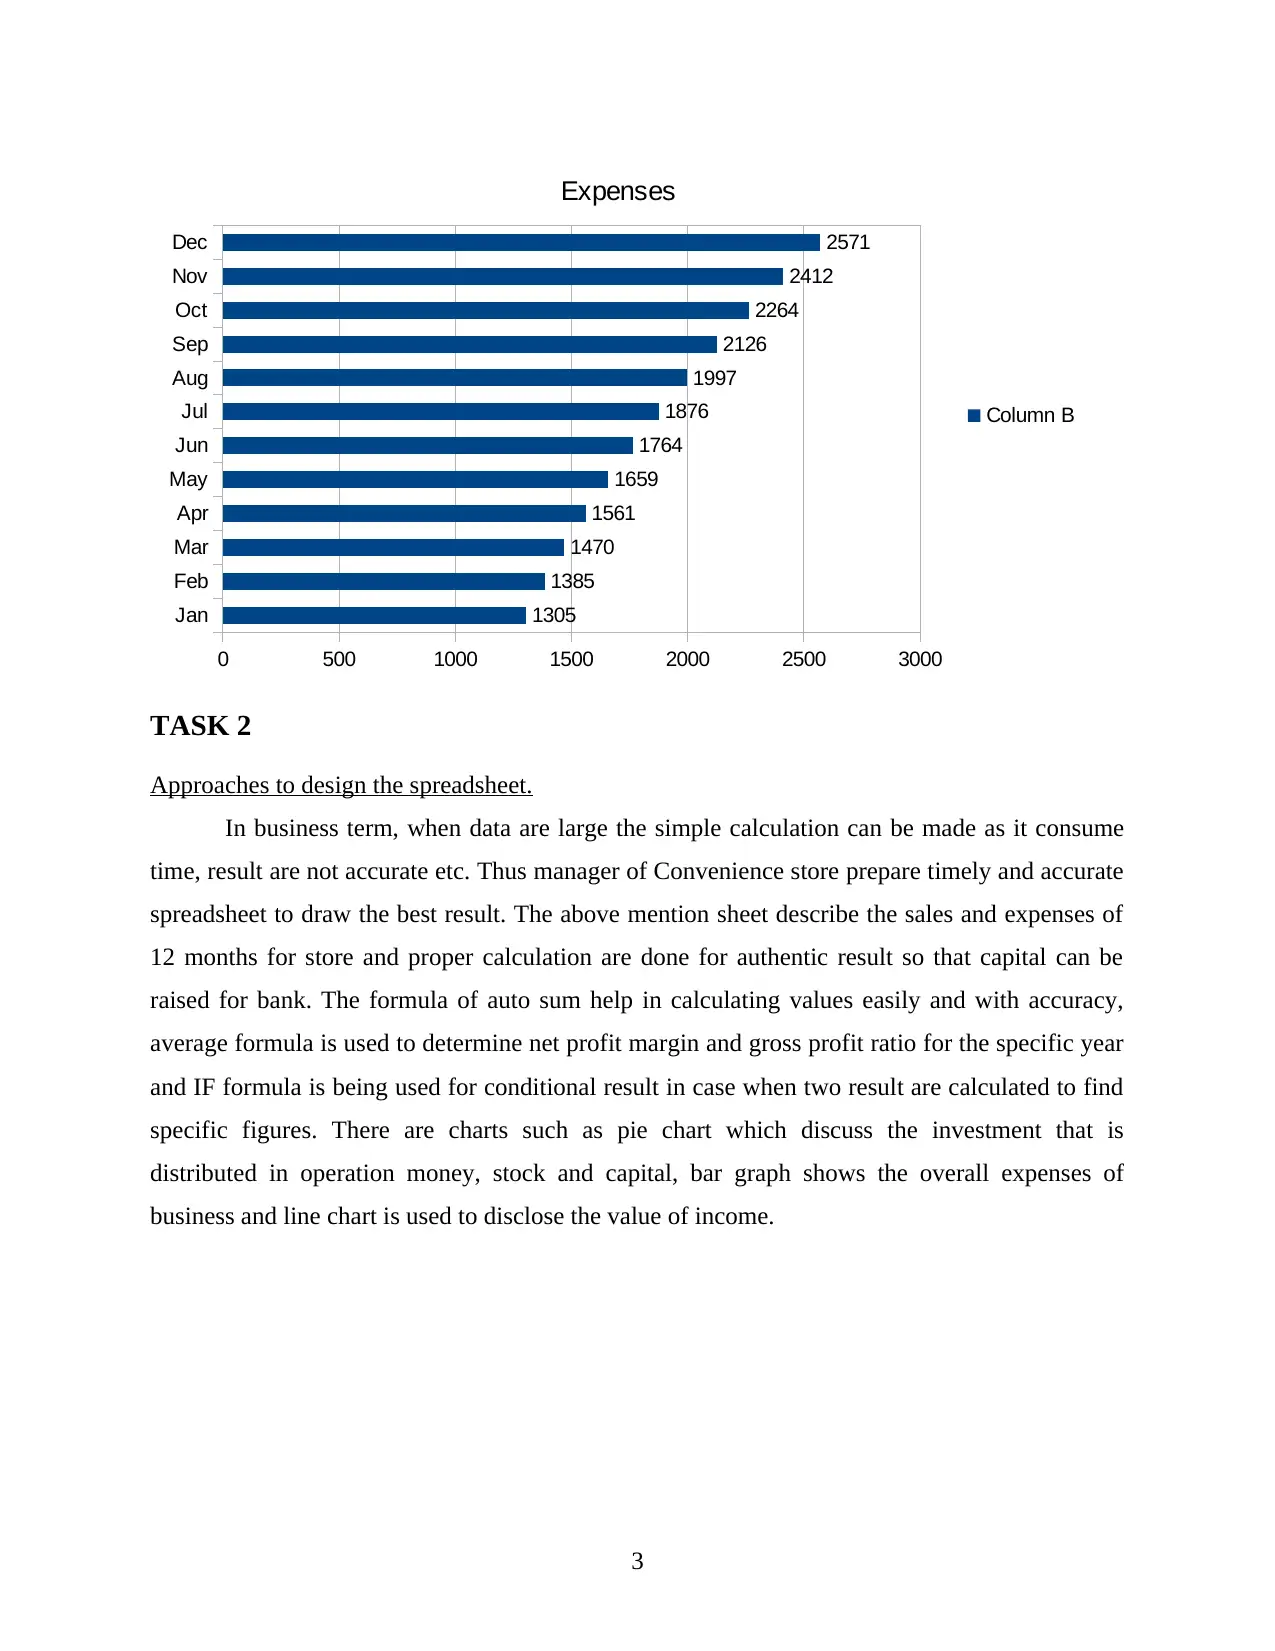
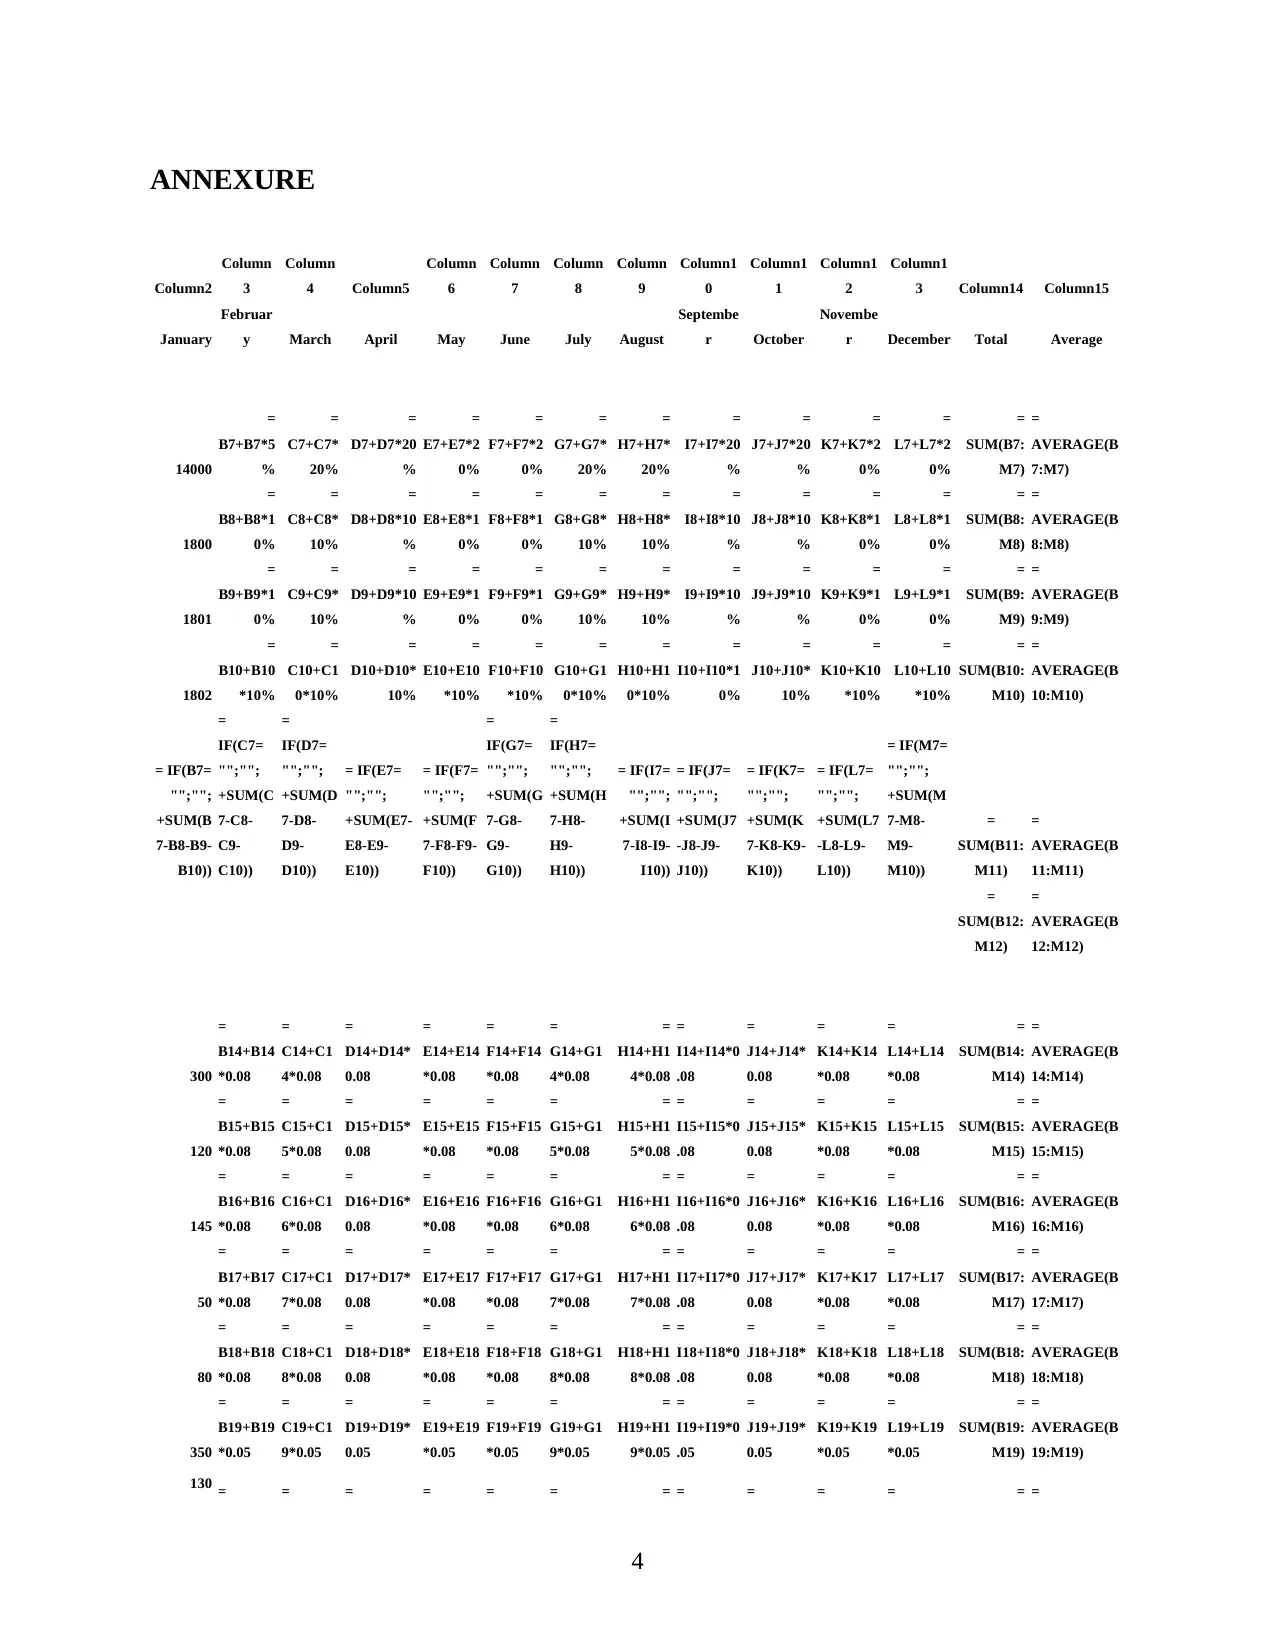
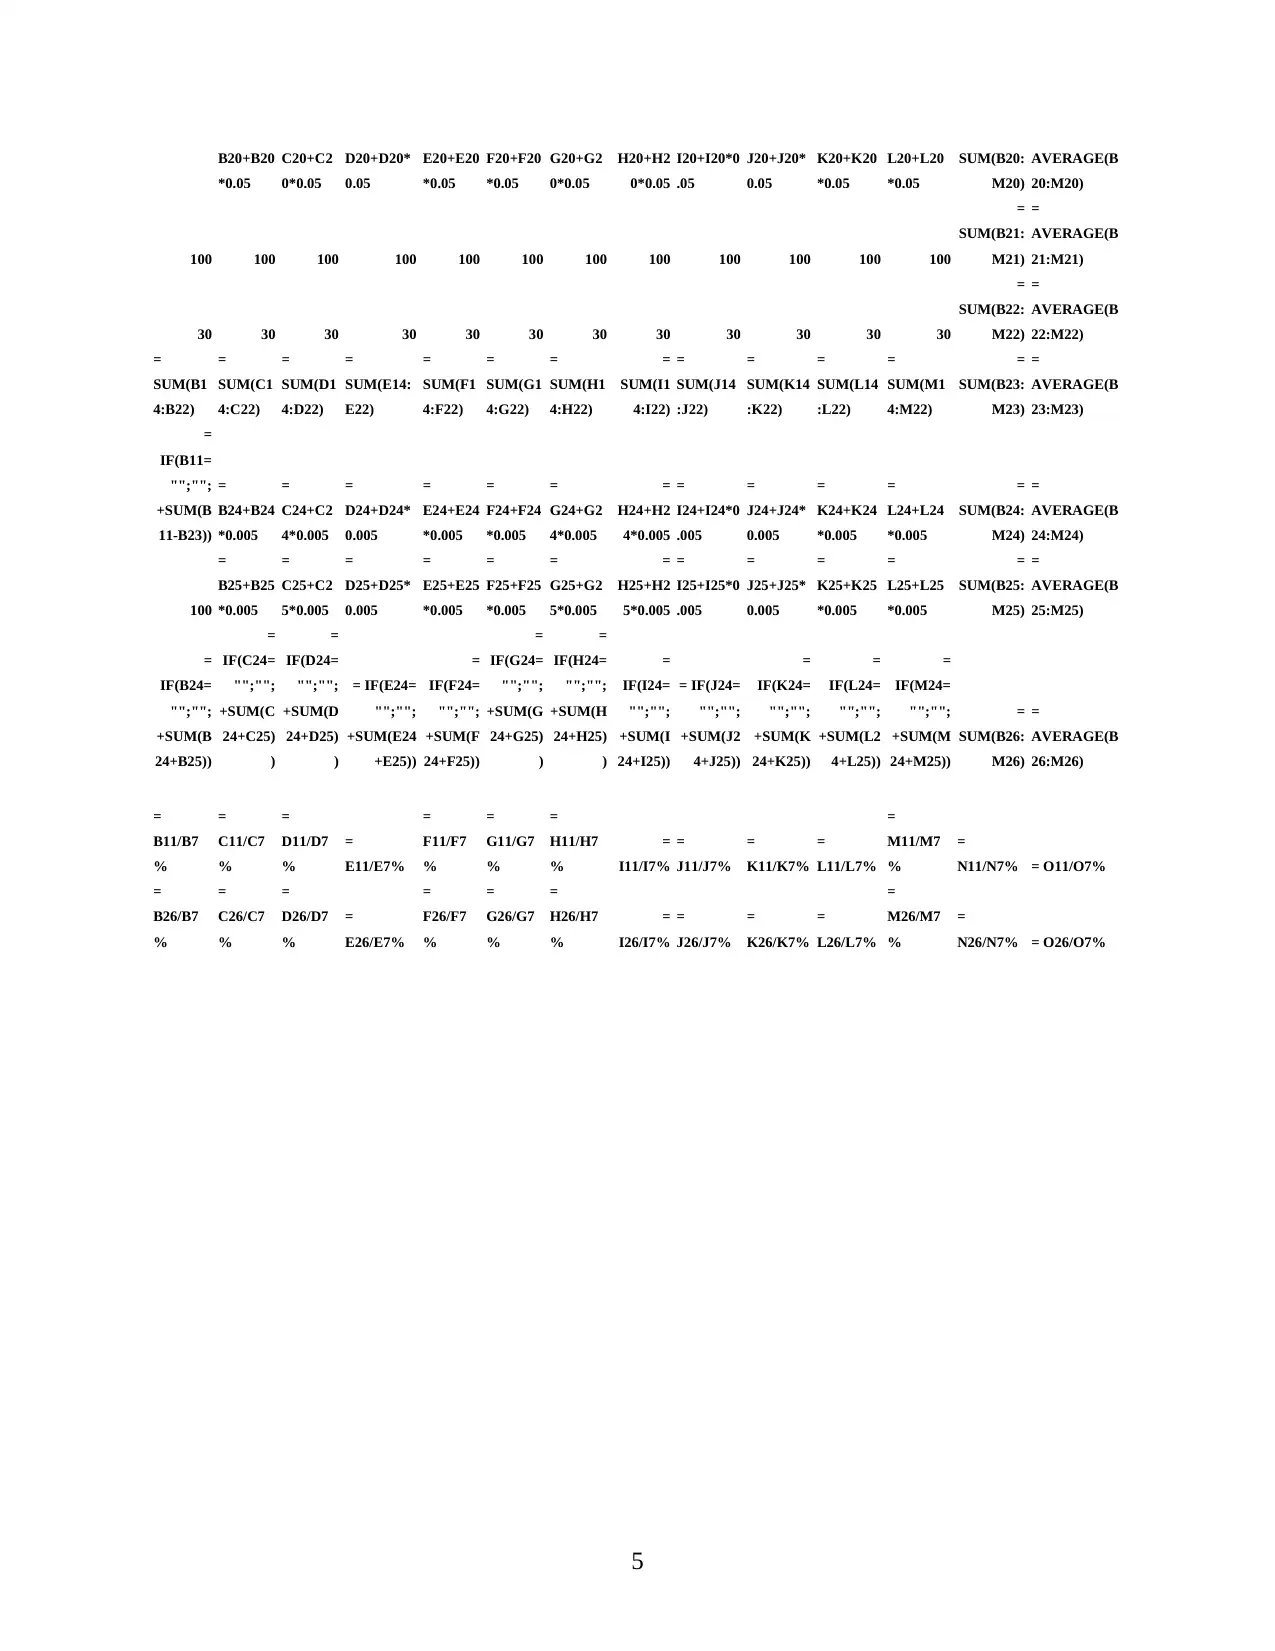
TASK 2
Approaches to design the spreadsheet.
In business term, when data are large the simple calculation can be made as it consume
time, result are not accurate etc. Thus manager of Convenience store prepare timely and accurate
spreadsheet to draw the best result. The above mention sheet describe the sales and expenses of
12 months for store and proper calculation are done for authentic result so that capital can be
raised for bank. The formula of auto sum help in calculating values easily and with accuracy,
average formula is used to determine net profit margin and gross profit ratio for the specific year
and IF formula is being used for conditional result in case when two result are calculated to find
specific figures. There are charts such as pie chart which discuss the investment that is
distributed in operation money, stock and capital, bar graph shows the overall expenses of
business and line chart is used to disclose the value of income.
3
Feb
Mar
Apr
May
Jun
Jul
Aug
Sep
Oct
Nov
Dec
0 500 1000 1500 2000 2500 3000
1305
1385
1470
1561
1659
1764
1876
1997
2126
2264
2412
2571
Expenses
Column B
TASK 2
Approaches to design the spreadsheet.
In business term, when data are large the simple calculation can be made as it consume
time, result are not accurate etc. Thus manager of Convenience store prepare timely and accurate
spreadsheet to draw the best result. The above mention sheet describe the sales and expenses of
12 months for store and proper calculation are done for authentic result so that capital can be
raised for bank. The formula of auto sum help in calculating values easily and with accuracy,
average formula is used to determine net profit margin and gross profit ratio for the specific year
and IF formula is being used for conditional result in case when two result are calculated to find
specific figures. There are charts such as pie chart which discuss the investment that is
distributed in operation money, stock and capital, bar graph shows the overall expenses of
business and line chart is used to disclose the value of income.
3
ANNEXURE
Column2
Column
3
Column
4 Column5
Column
6
Column
7
Column
8
Column
9
Column1
0
Column1
1
Column1
2
Column1
3 Column14 Column15
January
Februar
y March April May June July August
Septembe
r October
Novembe
r December Total Average
14000
=
B7+B7*5
%
=
C7+C7*
20%
=
D7+D7*20
%
=
E7+E7*2
0%
=
F7+F7*2
0%
=
G7+G7*
20%
=
H7+H7*
20%
=
I7+I7*20
%
=
J7+J7*20
%
=
K7+K7*2
0%
=
L7+L7*2
0%
=
SUM(B7:
M7)
=
AVERAGE(B
7:M7)
1800
=
B8+B8*1
0%
=
C8+C8*
10%
=
D8+D8*10
%
=
E8+E8*1
0%
=
F8+F8*1
0%
=
G8+G8*
10%
=
H8+H8*
10%
=
I8+I8*10
%
=
J8+J8*10
%
=
K8+K8*1
0%
=
L8+L8*1
0%
=
SUM(B8:
M8)
=
AVERAGE(B
8:M8)
1801
=
B9+B9*1
0%
=
C9+C9*
10%
=
D9+D9*10
%
=
E9+E9*1
0%
=
F9+F9*1
0%
=
G9+G9*
10%
=
H9+H9*
10%
=
I9+I9*10
%
=
J9+J9*10
%
=
K9+K9*1
0%
=
L9+L9*1
0%
=
SUM(B9:
M9)
=
AVERAGE(B
9:M9)
1802
=
B10+B10
*10%
=
C10+C1
0*10%
=
D10+D10*
10%
=
E10+E10
*10%
=
F10+F10
*10%
=
G10+G1
0*10%
=
H10+H1
0*10%
=
I10+I10*1
0%
=
J10+J10*
10%
=
K10+K10
*10%
=
L10+L10
*10%
=
SUM(B10:
M10)
=
AVERAGE(B
10:M10)
= IF(B7=
"";"";
+SUM(B
7-B8-B9-
B10))
=
IF(C7=
"";"";
+SUM(C
7-C8-
C9-
C10))
=
IF(D7=
"";"";
+SUM(D
7-D8-
D9-
D10))
= IF(E7=
"";"";
+SUM(E7-
E8-E9-
E10))
= IF(F7=
"";"";
+SUM(F
7-F8-F9-
F10))
=
IF(G7=
"";"";
+SUM(G
7-G8-
G9-
G10))
=
IF(H7=
"";"";
+SUM(H
7-H8-
H9-
H10))
= IF(I7=
"";"";
+SUM(I
7-I8-I9-
I10))
= IF(J7=
"";"";
+SUM(J7
-J8-J9-
J10))
= IF(K7=
"";"";
+SUM(K
7-K8-K9-
K10))
= IF(L7=
"";"";
+SUM(L7
-L8-L9-
L10))
= IF(M7=
"";"";
+SUM(M
7-M8-
M9-
M10))
=
SUM(B11:
M11)
=
AVERAGE(B
11:M11)
=
SUM(B12:
M12)
=
AVERAGE(B
12:M12)
300
=
B14+B14
*0.08
=
C14+C1
4*0.08
=
D14+D14*
0.08
=
E14+E14
*0.08
=
F14+F14
*0.08
=
G14+G1
4*0.08
=
H14+H1
4*0.08
=
I14+I14*0
.08
=
J14+J14*
0.08
=
K14+K14
*0.08
=
L14+L14
*0.08
=
SUM(B14:
M14)
=
AVERAGE(B
14:M14)
120
=
B15+B15
*0.08
=
C15+C1
5*0.08
=
D15+D15*
0.08
=
E15+E15
*0.08
=
F15+F15
*0.08
=
G15+G1
5*0.08
=
H15+H1
5*0.08
=
I15+I15*0
.08
=
J15+J15*
0.08
=
K15+K15
*0.08
=
L15+L15
*0.08
=
SUM(B15:
M15)
=
AVERAGE(B
15:M15)
145
=
B16+B16
*0.08
=
C16+C1
6*0.08
=
D16+D16*
0.08
=
E16+E16
*0.08
=
F16+F16
*0.08
=
G16+G1
6*0.08
=
H16+H1
6*0.08
=
I16+I16*0
.08
=
J16+J16*
0.08
=
K16+K16
*0.08
=
L16+L16
*0.08
=
SUM(B16:
M16)
=
AVERAGE(B
16:M16)
50
=
B17+B17
*0.08
=
C17+C1
7*0.08
=
D17+D17*
0.08
=
E17+E17
*0.08
=
F17+F17
*0.08
=
G17+G1
7*0.08
=
H17+H1
7*0.08
=
I17+I17*0
.08
=
J17+J17*
0.08
=
K17+K17
*0.08
=
L17+L17
*0.08
=
SUM(B17:
M17)
=
AVERAGE(B
17:M17)
80
=
B18+B18
*0.08
=
C18+C1
8*0.08
=
D18+D18*
0.08
=
E18+E18
*0.08
=
F18+F18
*0.08
=
G18+G1
8*0.08
=
H18+H1
8*0.08
=
I18+I18*0
.08
=
J18+J18*
0.08
=
K18+K18
*0.08
=
L18+L18
*0.08
=
SUM(B18:
M18)
=
AVERAGE(B
18:M18)
350
=
B19+B19
*0.05
=
C19+C1
9*0.05
=
D19+D19*
0.05
=
E19+E19
*0.05
=
F19+F19
*0.05
=
G19+G1
9*0.05
=
H19+H1
9*0.05
=
I19+I19*0
.05
=
J19+J19*
0.05
=
K19+K19
*0.05
=
L19+L19
*0.05
=
SUM(B19:
M19)
=
AVERAGE(B
19:M19)
130 = = = = = = = = = = = = =
4
B20+B20
*0.05
C20+C2
0*0.05
D20+D20*
0.05
E20+E20
*0.05
F20+F20
*0.05
G20+G2
0*0.05
H20+H2
0*0.05
I20+I20*0
.05
J20+J20*
0.05
K20+K20
*0.05
L20+L20
*0.05
SUM(B20:
M20)
AVERAGE(B
20:M20)
100 100 100 100 100 100 100 100 100 100 100 100
=
SUM(B21:
M21)
=
AVERAGE(B
21:M21)
30 30 30 30 30 30 30 30 30 30 30 30
=
SUM(B22:
M22)
=
AVERAGE(B
22:M22)
=
SUM(B1
4:B22)
=
SUM(C1
4:C22)
=
SUM(D1
4:D22)
=
SUM(E14:
E22)
=
SUM(F1
4:F22)
=
SUM(G1
4:G22)
=
SUM(H1
4:H22)
=
SUM(I1
4:I22)
=
SUM(J14
:J22)
=
SUM(K14
:K22)
=
SUM(L14
:L22)
=
SUM(M1
4:M22)
=
SUM(B23:
M23)
=
AVERAGE(B
23:M23)
=
IF(B11=
"";"";
+SUM(B
11-B23))
=
B24+B24
*0.005
=
C24+C2
4*0.005
=
D24+D24*
0.005
=
E24+E24
*0.005
=
F24+F24
*0.005
=
G24+G2
4*0.005
=
H24+H2
4*0.005
=
I24+I24*0
.005
=
J24+J24*
0.005
=
K24+K24
*0.005
=
L24+L24
*0.005
=
SUM(B24:
M24)
=
AVERAGE(B
24:M24)
100
=
B25+B25
*0.005
=
C25+C2
5*0.005
=
D25+D25*
0.005
=
E25+E25
*0.005
=
F25+F25
*0.005
=
G25+G2
5*0.005
=
H25+H2
5*0.005
=
I25+I25*0
.005
=
J25+J25*
0.005
=
K25+K25
*0.005
=
L25+L25
*0.005
=
SUM(B25:
M25)
=
AVERAGE(B
25:M25)
=
IF(B24=
"";"";
+SUM(B
24+B25))
=
IF(C24=
"";"";
+SUM(C
24+C25)
)
=
IF(D24=
"";"";
+SUM(D
24+D25)
)
= IF(E24=
"";"";
+SUM(E24
+E25))
=
IF(F24=
"";"";
+SUM(F
24+F25))
=
IF(G24=
"";"";
+SUM(G
24+G25)
)
=
IF(H24=
"";"";
+SUM(H
24+H25)
)
=
IF(I24=
"";"";
+SUM(I
24+I25))
= IF(J24=
"";"";
+SUM(J2
4+J25))
=
IF(K24=
"";"";
+SUM(K
24+K25))
=
IF(L24=
"";"";
+SUM(L2
4+L25))
=
IF(M24=
"";"";
+SUM(M
24+M25))
=
SUM(B26:
M26)
=
AVERAGE(B
26:M26)
=
B11/B7
%
=
C11/C7
%
=
D11/D7
%
=
E11/E7%
=
F11/F7
%
=
G11/G7
%
=
H11/H7
%
=
I11/I7%
=
J11/J7%
=
K11/K7%
=
L11/L7%
=
M11/M7
%
=
N11/N7% = O11/O7%
=
B26/B7
%
=
C26/C7
%
=
D26/D7
%
=
E26/E7%
=
F26/F7
%
=
G26/G7
%
=
H26/H7
%
=
I26/I7%
=
J26/J7%
=
K26/K7%
=
L26/L7%
=
M26/M7
%
=
N26/N7% = O26/O7%
5
*0.05
C20+C2
0*0.05
D20+D20*
0.05
E20+E20
*0.05
F20+F20
*0.05
G20+G2
0*0.05
H20+H2
0*0.05
I20+I20*0
.05
J20+J20*
0.05
K20+K20
*0.05
L20+L20
*0.05
SUM(B20:
M20)
AVERAGE(B
20:M20)
100 100 100 100 100 100 100 100 100 100 100 100
=
SUM(B21:
M21)
=
AVERAGE(B
21:M21)
30 30 30 30 30 30 30 30 30 30 30 30
=
SUM(B22:
M22)
=
AVERAGE(B
22:M22)
=
SUM(B1
4:B22)
=
SUM(C1
4:C22)
=
SUM(D1
4:D22)
=
SUM(E14:
E22)
=
SUM(F1
4:F22)
=
SUM(G1
4:G22)
=
SUM(H1
4:H22)
=
SUM(I1
4:I22)
=
SUM(J14
:J22)
=
SUM(K14
:K22)
=
SUM(L14
:L22)
=
SUM(M1
4:M22)
=
SUM(B23:
M23)
=
AVERAGE(B
23:M23)
=
IF(B11=
"";"";
+SUM(B
11-B23))
=
B24+B24
*0.005
=
C24+C2
4*0.005
=
D24+D24*
0.005
=
E24+E24
*0.005
=
F24+F24
*0.005
=
G24+G2
4*0.005
=
H24+H2
4*0.005
=
I24+I24*0
.005
=
J24+J24*
0.005
=
K24+K24
*0.005
=
L24+L24
*0.005
=
SUM(B24:
M24)
=
AVERAGE(B
24:M24)
100
=
B25+B25
*0.005
=
C25+C2
5*0.005
=
D25+D25*
0.005
=
E25+E25
*0.005
=
F25+F25
*0.005
=
G25+G2
5*0.005
=
H25+H2
5*0.005
=
I25+I25*0
.005
=
J25+J25*
0.005
=
K25+K25
*0.005
=
L25+L25
*0.005
=
SUM(B25:
M25)
=
AVERAGE(B
25:M25)
=
IF(B24=
"";"";
+SUM(B
24+B25))
=
IF(C24=
"";"";
+SUM(C
24+C25)
)
=
IF(D24=
"";"";
+SUM(D
24+D25)
)
= IF(E24=
"";"";
+SUM(E24
+E25))
=
IF(F24=
"";"";
+SUM(F
24+F25))
=
IF(G24=
"";"";
+SUM(G
24+G25)
)
=
IF(H24=
"";"";
+SUM(H
24+H25)
)
=
IF(I24=
"";"";
+SUM(I
24+I25))
= IF(J24=
"";"";
+SUM(J2
4+J25))
=
IF(K24=
"";"";
+SUM(K
24+K25))
=
IF(L24=
"";"";
+SUM(L2
4+L25))
=
IF(M24=
"";"";
+SUM(M
24+M25))
=
SUM(B26:
M26)
=
AVERAGE(B
26:M26)
=
B11/B7
%
=
C11/C7
%
=
D11/D7
%
=
E11/E7%
=
F11/F7
%
=
G11/G7
%
=
H11/H7
%
=
I11/I7%
=
J11/J7%
=
K11/K7%
=
L11/L7%
=
M11/M7
%
=
N11/N7% = O11/O7%
=
B26/B7
%
=
C26/C7
%
=
D26/D7
%
=
E26/E7%
=
F26/F7
%
=
G26/G7
%
=
H26/H7
%
=
I26/I7%
=
J26/J7%
=
K26/K7%
=
L26/L7%
=
M26/M7
%
=
N26/N7% = O26/O7%
5
1 out of 7
![[SOLVED] Financial Analysis and Modeling](/_next/image/?url=https%3A%2F%2Fdesklib.com%2Fmedia%2Fimages%2Faa%2F463786dccec74cfb928bae5305a0f448.jpg&w=256&q=75)


Your All-in-One AI-Powered Toolkit for Academic Success.
+13062052269
info@desklib.com
Available 24*7 on WhatsApp / Email
![[object Object]](/_next/static/media/star-bottom.7253800d.svg)
Unlock your academic potential
© 2024 | Zucol Services PVT LTD | All rights reserved.