Statistics Project: Aristocrat Leisure Limited Case Study 2022
VerifiedAdded on 2022/09/18
|8
|1225
|12
AI Summary
Contribute Materials
Your contribution can guide someone’s learning journey. Share your
documents today.
1
Statistics Project: Aristocrat Leisure Limited
Name:
Institution:
Statistics Project: Aristocrat Leisure Limited
Name:
Institution:
Secure Best Marks with AI Grader
Need help grading? Try our AI Grader for instant feedback on your assignments.
2
Executive Summary
The following study seeks to exhibit the descriptive statistics of the PWR (opening price
weekly return) and CWR (closely price weekly return) of both the Aristocrat Leisure and ASX
index. Moreover, the study will incorporate the simple regression analysis to test the predictive
power of PWR and CWR. Aristocrat Leisure Limited is an Australian based company that
engages in various activities, such as the production of casino gaming system, casino accessories,
furniture, and signage. Furthermore, the company provides technical supports and services, such
as casino consulting (finance, forecast, and revenue generation) and designing services. It is
evident that at 5% significance level both regression 1 and 2 recorded p-values of 0.32755 and
0.15494, which are greater than 0.05 thus the model is not adequate. Notably, to improve the
results of the regression it is recommendable to adopt other models, such as polynomial or
exponential models.
3
Contents
Executive Summary.............................................................................................................2
Introduction..........................................................................................................................4
Descriptive Statistics...........................................................................................................5
Summary Statistics..........................................................................................................5
Simple Regression Analysis................................................................................................6
Regression 1.....................................................................................................................6
Regression 2.....................................................................................................................6
Conclusion...........................................................................................................................6
References............................................................................................................................7
4
Introduction
Among various companies that engage in the production of casino gaming systems,
Aristocrat Leisure Limited based in Australia is the second largest company after the
International Game Technology based in the United States of America. Other principal
competitors to the company include GTECH Holdings Corporation and MWS Industries.
Notably, Australia has adopted various measures that curb the gambling market; however, the
company “Commands” 60% of the market in the country (Company Histories, 2019). Besides,
the Aristocrat Leisure accounts for 26% of the sales in the U.S.; moreover, the company is active
in other countries across the globe, such as Japan, South Africa, New Zealand, South America,
and Europe. In addition to the production of casino gaming system, the company engages in
other activities, such as production of casino accessories, furniture, and signage (Company
Histories, 2019). Furthermore, Aristocrat Leisure provides technical supports and services, such
as casino consulting (finance, forecast, and revenue generation) and designing services.
Notably, the mission of the company is to provide sustainable value for the stakeholders
through offering entertaining and innovative gaming activities to the clients across the continent.
Besides, the values of the company are based on two pillars, which include technology and
creativity. The company is controlled by the family of the founder (Leonard Ainsworth), which
owns approximately 40% of the total shares. Due to the various activities that Aristocrat Leisure
engages, its has experienced an exponential growth in various aspects such as revenue,
infrastructure, employees, and global coverage. As a result, the company is listed in various
stock exchange platforms, which include the New Zealand and Australia Stock exchange
platforms. Therefore, the following study seeks to exhibit the descriptive statistics of the PWR
(opening price weekly return) and CWR (closely price weekly return) of both the Aristocrat
Secure Best Marks with AI Grader
Need help grading? Try our AI Grader for instant feedback on your assignments.
5
Leisure and ASX index. Moreover, the study will incorporate the simple regression analysis to
test the predictive power of PWR and CWR.
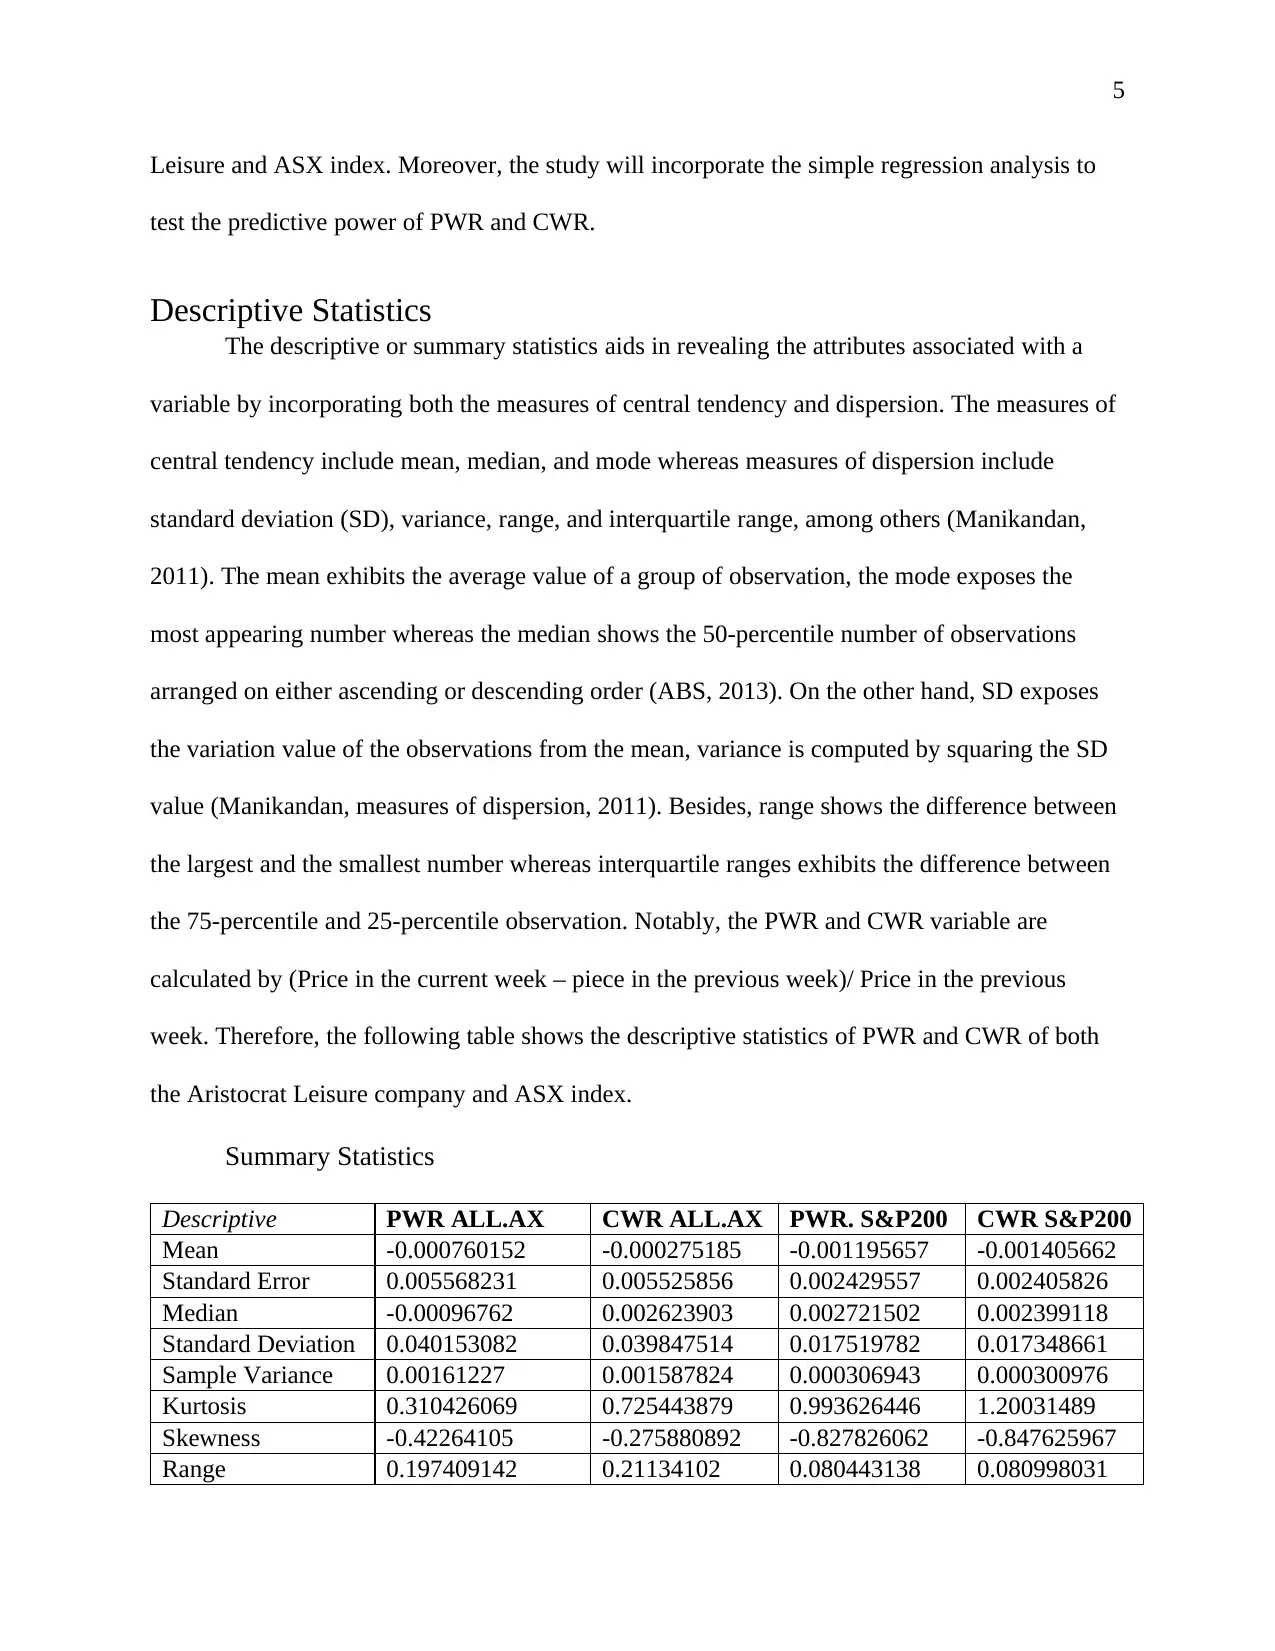
Descriptive Statistics
The descriptive or summary statistics aids in revealing the attributes associated with a
variable by incorporating both the measures of central tendency and dispersion. The measures of
central tendency include mean, median, and mode whereas measures of dispersion include
standard deviation (SD), variance, range, and interquartile range, among others (Manikandan,
2011). The mean exhibits the average value of a group of observation, the mode exposes the
most appearing number whereas the median shows the 50-percentile number of observations
arranged on either ascending or descending order (ABS, 2013). On the other hand, SD exposes
the variation value of the observations from the mean, variance is computed by squaring the SD
value (Manikandan, measures of dispersion, 2011). Besides, range shows the difference between
the largest and the smallest number whereas interquartile ranges exhibits the difference between
the 75-percentile and 25-percentile observation. Notably, the PWR and CWR variable are
calculated by (Price in the current week – piece in the previous week)/ Price in the previous
week. Therefore, the following table shows the descriptive statistics of PWR and CWR of both
the Aristocrat Leisure company and ASX index.
Summary Statistics
Descriptive PWR ALL.AX CWR ALL.AX PWR. S&P200 CWR S&P200
Mean -0.000760152 -0.000275185 -0.001195657 -0.001405662
Standard Error 0.005568231 0.005525856 0.002429557 0.002405826
Median -0.00096762 0.002623903 0.002721502 0.002399118
Standard Deviation 0.040153082 0.039847514 0.017519782 0.017348661
Sample Variance 0.00161227 0.001587824 0.000306943 0.000300976
Kurtosis 0.310426069 0.725443879 0.993626446 1.20031489
Skewness -0.42264105 -0.275880892 -0.827826062 -0.847625967
Range 0.197409142 0.21134102 0.080443138 0.080998031
Leisure and ASX index. Moreover, the study will incorporate the simple regression analysis to
test the predictive power of PWR and CWR.
Descriptive Statistics
The descriptive or summary statistics aids in revealing the attributes associated with a
variable by incorporating both the measures of central tendency and dispersion. The measures of
central tendency include mean, median, and mode whereas measures of dispersion include
standard deviation (SD), variance, range, and interquartile range, among others (Manikandan,
2011). The mean exhibits the average value of a group of observation, the mode exposes the
most appearing number whereas the median shows the 50-percentile number of observations
arranged on either ascending or descending order (ABS, 2013). On the other hand, SD exposes
the variation value of the observations from the mean, variance is computed by squaring the SD
value (Manikandan, measures of dispersion, 2011). Besides, range shows the difference between
the largest and the smallest number whereas interquartile ranges exhibits the difference between
the 75-percentile and 25-percentile observation. Notably, the PWR and CWR variable are
calculated by (Price in the current week – piece in the previous week)/ Price in the previous
week. Therefore, the following table shows the descriptive statistics of PWR and CWR of both
the Aristocrat Leisure company and ASX index.
Summary Statistics
Descriptive PWR ALL.AX CWR ALL.AX PWR. S&P200 CWR S&P200
Mean -0.000760152 -0.000275185 -0.001195657 -0.001405662
Standard Error 0.005568231 0.005525856 0.002429557 0.002405826
Median -0.00096762 0.002623903 0.002721502 0.002399118
Standard Deviation 0.040153082 0.039847514 0.017519782 0.017348661
Sample Variance 0.00161227 0.001587824 0.000306943 0.000300976
Kurtosis 0.310426069 0.725443879 0.993626446 1.20031489
Skewness -0.42264105 -0.275880892 -0.827826062 -0.847625967
Range 0.197409142 0.21134102 0.080443138 0.080998031
6
Minimum -0.111111111 -0.108135627 -0.046296584 -0.046851476
Maximum 0.086298031 0.103205393 0.034146555 0.034146555
Sum -0.039527923 -0.014309634 -0.062174158 -0.073094438
Count 52 52 52 52
Simple Regression Analysis
Regression analysis exhibits the level of relationship between the dependent and the
independent variable (Ray, 2015).
Regression 1
Independent variable = PWR S&P200 Dependent Variable = CWR ALL.AX
Observation 52
R Square 0.01964
Intercept -0.0006562
PWR S&P200 coefficient -0.318725
P-value 0.32755
CWR ALL.AX = -0.0006562 – 0.318725 PWR S&P200
Regression 2
Independent variable = PWR ALL.AX Dependent Variable = CWR S&P200
Observation 52
R Square 0.0400
Intercept -0.00147
PWR ALL.AX coefficient -0.0864
P-value 0.15494
CWR S&P200 = -0.00147 – 0.0864 PWR ALL.AX
7
Conclusion
As evident, the R square value for both regression 1 and 2 are 0.01964 (1.964%) and
0.0400 (4%) respectively, which shows that the variation in CWR ALL.AX is explained by PWR
S&P200 at 1.964% whereas the variation in CWR S&P200 is explained by PWR ALL.AX at
4%. Moreover, at 5% significance level both regression 1 and 2 recorded p-values of 0.32755
and 0.15494, which are greater than 0.05 thus the model is not adequate. Notably, to improve the
results of the regression it is recommendable to adopt other models, such as polynomial or
exponential models; moreover, the study can incorporate other variables.
Paraphrase This Document
Need a fresh take? Get an instant paraphrase of this document with our AI Paraphraser
8
References
ABS. (2013, July 3). Measures of Central Tendency. Retrieved from Australian Bureau of
Statistics Website:
https://www.abs.gov.au/websitedbs/a3121120.nsf/home/statistical+language+-
+measures+of+central+tendency
Company Histories. (2019). Aristocrat Leisure Limited. Retrieved from Company Histories
Website: http://www.company-histories.com/Aristocrat-Leisure-Limited-Company-
History.html
Manikandan, S. (2011). Measures of central tendency: The mean. Journal of Pharmacol &
Pharmacotherapeutics, 140-142. doi:10.4103/0976-500X.81920
Manikandan, S. (2011). Measures of dispersion. Journal of Pharmacol & Pharmacother, 315-
316. doi:10.4103/0976-500X.85931
Ray, S. (2015, August 14). Regression Techniques. Retrieved from Analytics Vidhya Website:
https://www.analyticsvidhya.com/blog/2015/08/comprehensive-guide-regression/
1 out of 8
Your All-in-One AI-Powered Toolkit for Academic Success.
+13062052269
info@desklib.com
Available 24*7 on WhatsApp / Email
![[object Object]](/_next/static/media/star-bottom.7253800d.svg)
Unlock your academic potential
© 2024 | Zucol Services PVT LTD | All rights reserved.