BUS502 Principles of Economics: Sydney's Growth and RBA Cash Rate
VerifiedAdded on 2023/06/13
|7
|2287
|92
Homework Assignment
AI Summary
This assignment provides a detailed analysis of Sydney's economic growth, focusing on real GDP and real GDP per capita, and comparing growth rates with regional NSW and Victoria. It evaluates the limitations of GDP as a measure of living standards and suggests alternative economic indicators like the Human Development Index and Social Progress Index. Furthermore, the assignment examines the potential effects of the Reserve Bank of Australia's cash rate decisions on Sydney's economy, particularly in relation to housing prices and inflation. The analysis includes data and references to support the findings, offering a comprehensive overview of Sydney's economic landscape and the factors influencing it.

Page 1 of 7
NAME:
ID NO:
Tutor’s name:
ATMC BUS502 principles of economics for Accountants – Semester One 2018
Assessment task 2 – Responses to articles - Article 1
DUE via Safe Assign 9pm Sunday 15th April
“Sydney powers the nation, accounting for almost half of Australia’s economic growth.” By Peter
Martin from The Sydney Morning Herald 4th December 2017 is available at:
https://www.smh.com.au/business/the-economy/sydney-powers-the-nation-accounting-for-
almost-half-of-australias-economic-growth-20171204-gzyj04.html
Access the article at the URL given above and read it carefully. Based on your reading, answer the
questions in the spaces below. Use full sentences and show all necessary working. Other references
are not necessary but, if you do use any (for example, online economics glossaries) please list at
least the URL of your source. Marks are shown and total [15].
(1) Real GDP and real GDP per capita for Sydney are different. Define the two terms in italics
and explain carefully why they differ.
[3]
Real GDP
Real Gross Domestic Product is a measure of aggregate output in an economy that is
adjusted for inflation or deflation (Agénor and Montiel 2015). Gross Domestic Product represents
the market value goods and services produced within the economy. GDP is computed using either
current market price or market price of a fixed base year. GDP obtained using market price of fixed
base year is called real GDP.
Real GDP per capita
Real GDP per capita is the measure for average income of a nation. It is obtained by dividing
real GDP by population of the country (Bernanke, Antonovics and Frank 2015). Unlike real GDP, it
represents output per person and thus indicates living standard.
In 2015-16, the GDP of Sydney was $400.9 billion. When divided by total population per
capita real GDP is obtained as $81,000 (sgsep.com.au 2017). Real GDP in Sydney has increased
significantly in recent years. The largest contributor to real GDP are professional services, wholesale
trade and financial and insurance service. The real estate, health care, manufacturing and
telecommunication contributed nearly 0.2 to 0.3 percentage point in GDP growth. Population
Paraphrase This Document
Need a fresh take? Get an instant paraphrase of this document with our AI Paraphraser
Page 2 of 7
growth plays an important role in driving economic growth. In order to eliminate this impact per
capita GDP is computed. Since 2004-05, per capita GDP of Sydney remain higher than national
average. A higher real GDP does not imply a higher per capita GDP. This in turn depends on the
extend of population growth. The population in Sydney has grown at a faster rate in the last few
years (smh.com.au 2018). The real GDP growth however offset the population growth causing per
capita GDP in Sydney to grow continuously.
(2) Martin notes two very significantly different growth rates in regional NSW and regional
Victoria. Compare the effect of these two different growth rates on GDP if they were
sustained over a period of 20 years.
[3]
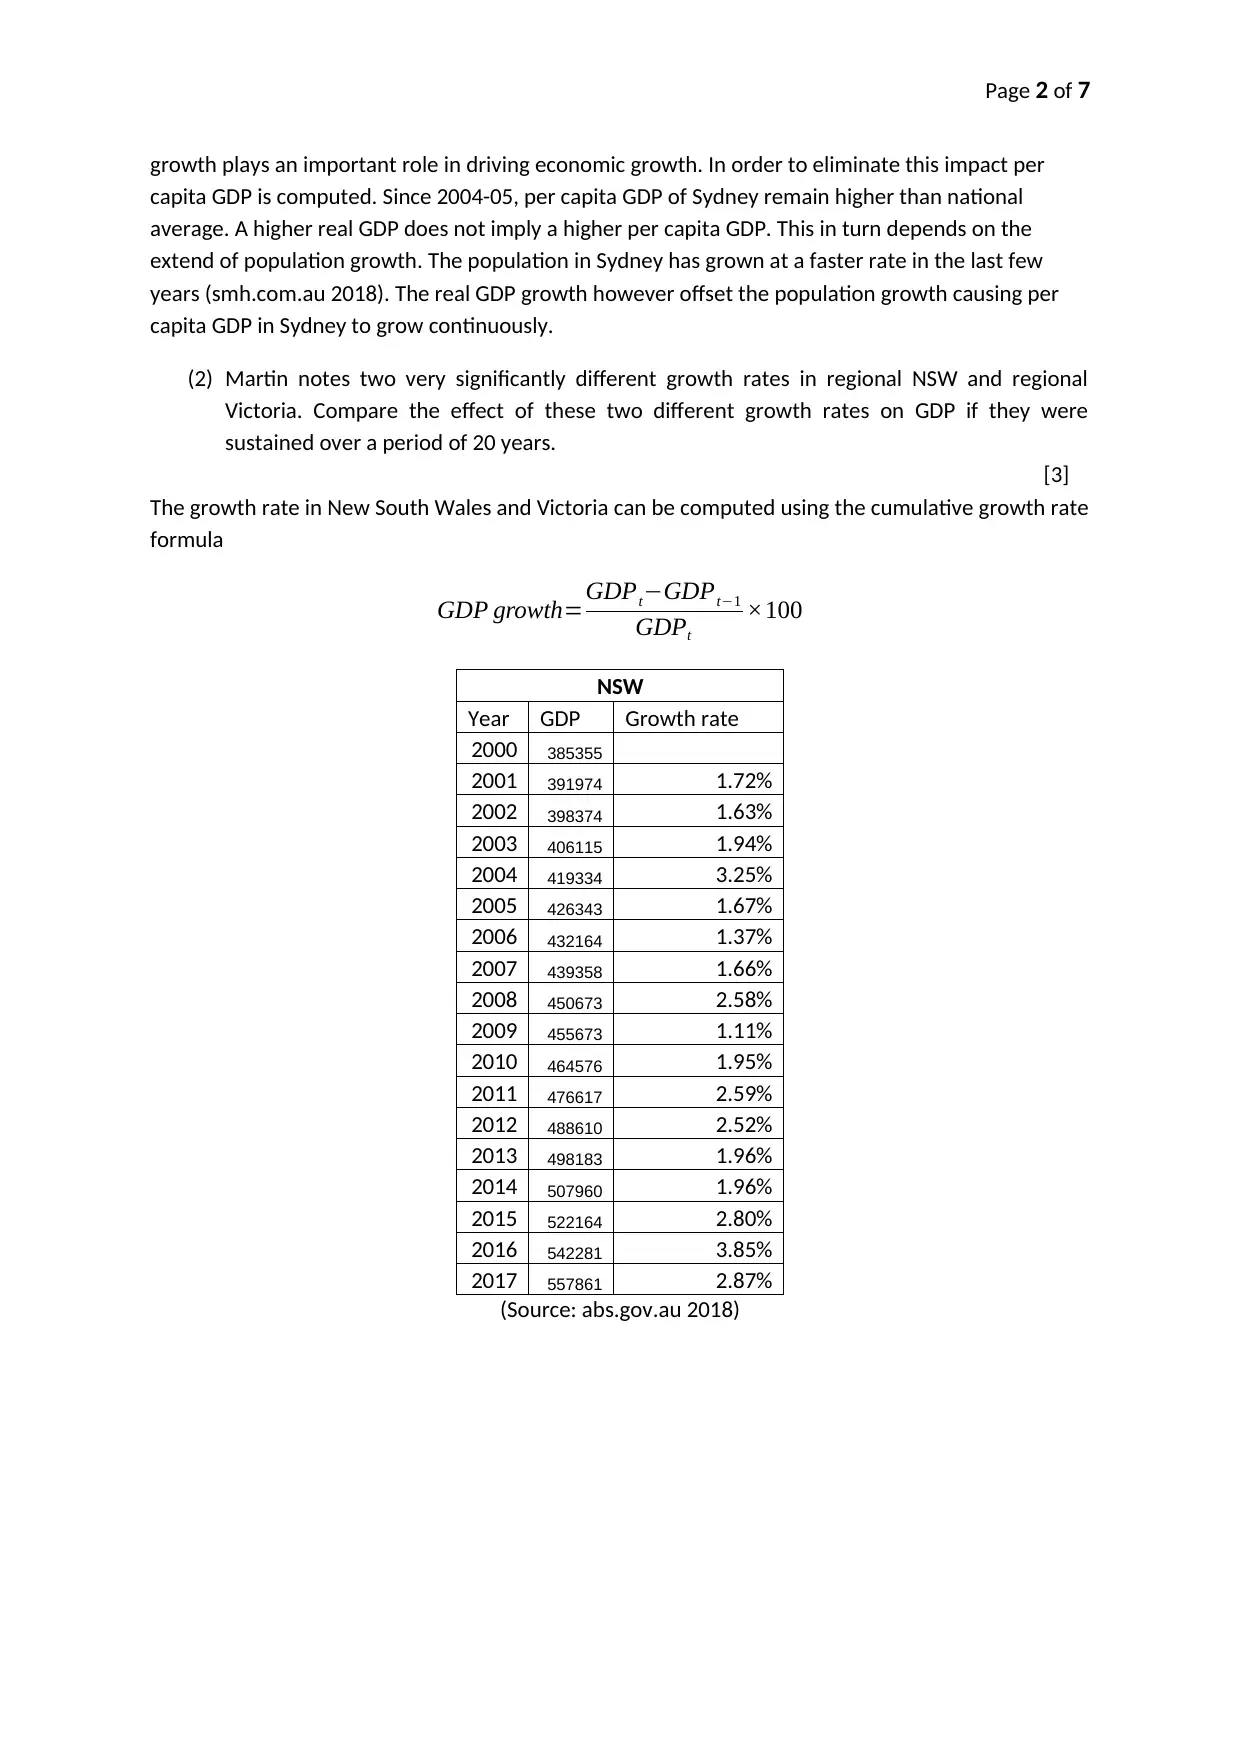
The growth rate in New South Wales and Victoria can be computed using the cumulative growth rate
formula
GDP growth=GDPt−GDPt−1
GDPt
×100
NSW
Year GDP Growth rate
2000 385355
2001 391974 1.72%
2002 398374 1.63%
2003 406115 1.94%
2004 419334 3.25%
2005 426343 1.67%
2006 432164 1.37%
2007 439358 1.66%
2008 450673 2.58%
2009 455673 1.11%
2010 464576 1.95%
2011 476617 2.59%
2012 488610 2.52%
2013 498183 1.96%
2014 507960 1.96%
2015 522164 2.80%
2016 542281 3.85%
2017 557861 2.87%
(Source: abs.gov.au 2018)
growth plays an important role in driving economic growth. In order to eliminate this impact per
capita GDP is computed. Since 2004-05, per capita GDP of Sydney remain higher than national
average. A higher real GDP does not imply a higher per capita GDP. This in turn depends on the
extend of population growth. The population in Sydney has grown at a faster rate in the last few
years (smh.com.au 2018). The real GDP growth however offset the population growth causing per
capita GDP in Sydney to grow continuously.
(2) Martin notes two very significantly different growth rates in regional NSW and regional
Victoria. Compare the effect of these two different growth rates on GDP if they were
sustained over a period of 20 years.
[3]
The growth rate in New South Wales and Victoria can be computed using the cumulative growth rate
formula
GDP growth=GDPt−GDPt−1
GDPt
×100
NSW
Year GDP Growth rate
2000 385355
2001 391974 1.72%
2002 398374 1.63%
2003 406115 1.94%
2004 419334 3.25%
2005 426343 1.67%
2006 432164 1.37%
2007 439358 1.66%
2008 450673 2.58%
2009 455673 1.11%
2010 464576 1.95%
2011 476617 2.59%
2012 488610 2.52%
2013 498183 1.96%
2014 507960 1.96%
2015 522164 2.80%
2016 542281 3.85%
2017 557861 2.87%
(Source: abs.gov.au 2018)
Page 3 of 7
1998 2000 2002 2004 2006 2008 2010 2012 2014 2016 2018
0
0.005
0.01
0.015
0.02
0.025
0.03
0.035
0.04
0.045
New South Wales
Growth rate
Year
Growth rate
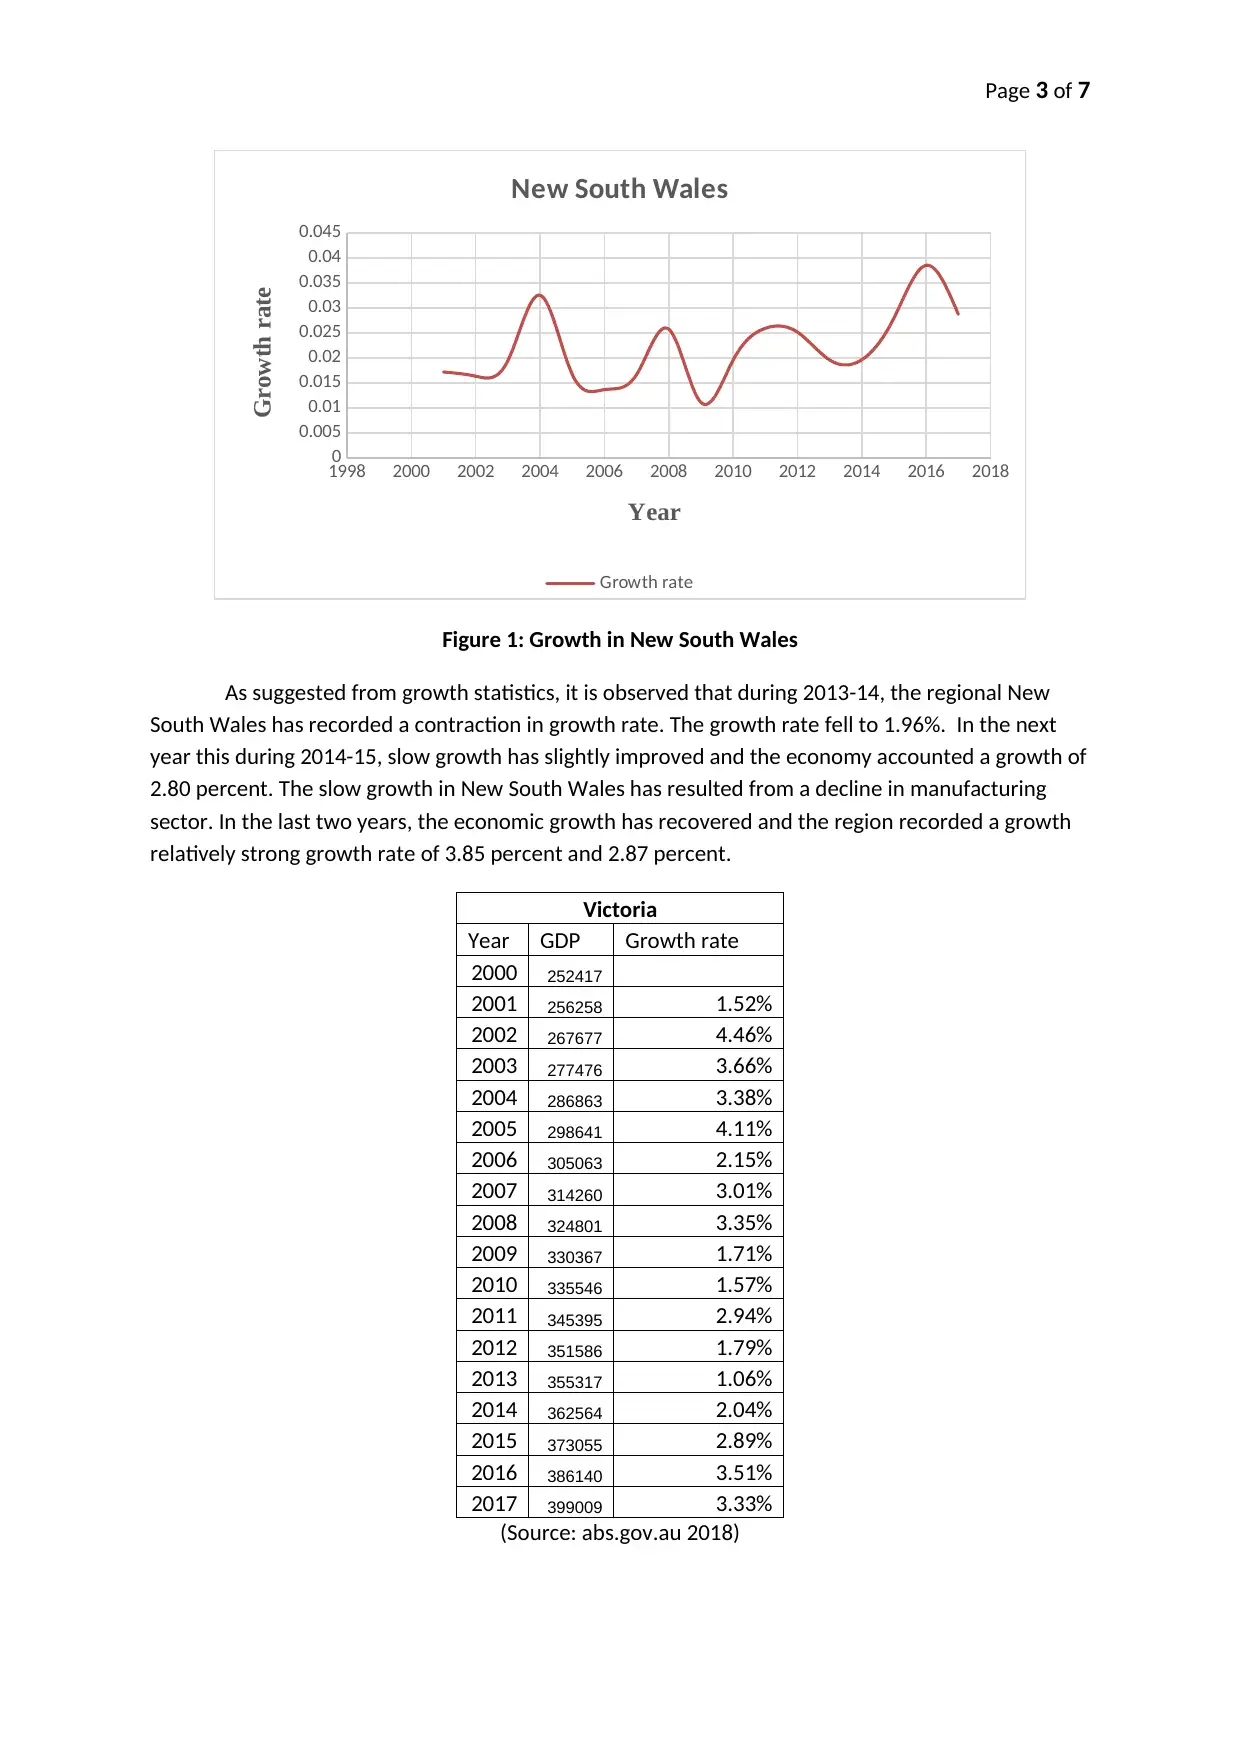
Figure 1: Growth in New South Wales
As suggested from growth statistics, it is observed that during 2013-14, the regional New
South Wales has recorded a contraction in growth rate. The growth rate fell to 1.96%. In the next
year this during 2014-15, slow growth has slightly improved and the economy accounted a growth of
2.80 percent. The slow growth in New South Wales has resulted from a decline in manufacturing
sector. In the last two years, the economic growth has recovered and the region recorded a growth
relatively strong growth rate of 3.85 percent and 2.87 percent.
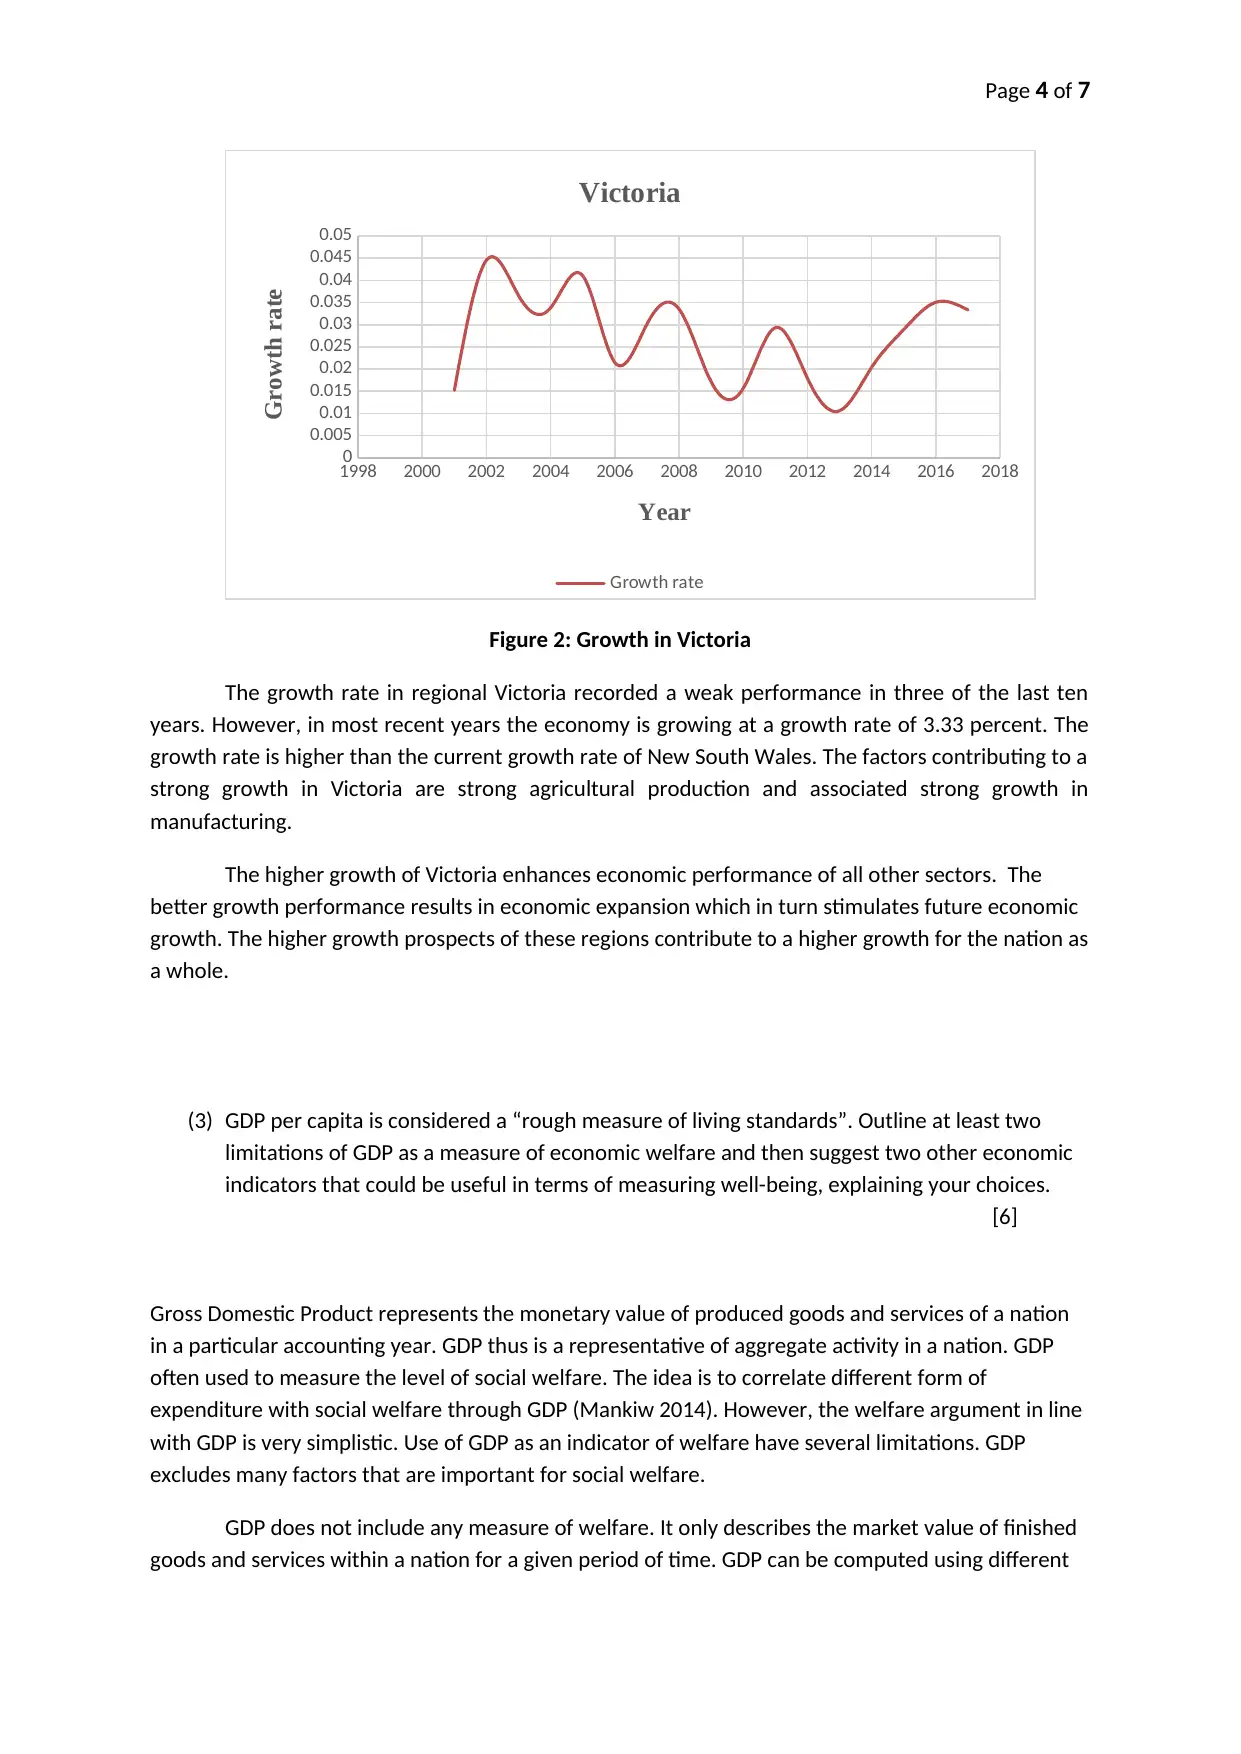
Victoria
Year GDP Growth rate
2000 252417
2001 256258 1.52%
2002 267677 4.46%
2003 277476 3.66%
2004 286863 3.38%
2005 298641 4.11%
2006 305063 2.15%
2007 314260 3.01%
2008 324801 3.35%
2009 330367 1.71%
2010 335546 1.57%
2011 345395 2.94%
2012 351586 1.79%
2013 355317 1.06%
2014 362564 2.04%
2015 373055 2.89%
2016 386140 3.51%
2017 399009 3.33%
(Source: abs.gov.au 2018)
1998 2000 2002 2004 2006 2008 2010 2012 2014 2016 2018
0
0.005
0.01
0.015
0.02
0.025
0.03
0.035
0.04
0.045
New South Wales
Growth rate
Year
Growth rate
Figure 1: Growth in New South Wales
As suggested from growth statistics, it is observed that during 2013-14, the regional New
South Wales has recorded a contraction in growth rate. The growth rate fell to 1.96%. In the next
year this during 2014-15, slow growth has slightly improved and the economy accounted a growth of
2.80 percent. The slow growth in New South Wales has resulted from a decline in manufacturing
sector. In the last two years, the economic growth has recovered and the region recorded a growth
relatively strong growth rate of 3.85 percent and 2.87 percent.
Victoria
Year GDP Growth rate
2000 252417
2001 256258 1.52%
2002 267677 4.46%
2003 277476 3.66%
2004 286863 3.38%
2005 298641 4.11%
2006 305063 2.15%
2007 314260 3.01%
2008 324801 3.35%
2009 330367 1.71%
2010 335546 1.57%
2011 345395 2.94%
2012 351586 1.79%
2013 355317 1.06%
2014 362564 2.04%
2015 373055 2.89%
2016 386140 3.51%
2017 399009 3.33%
(Source: abs.gov.au 2018)
⊘ This is a preview!⊘
Do you want full access?
Subscribe today to unlock all pages.
Trusted by 1+ million students worldwide
Page 4 of 7
1998 2000 2002 2004 2006 2008 2010 2012 2014 2016 2018
0
0.005
0.01
0.015
0.02
0.025
0.03
0.035
0.04
0.045
0.05
Victoria
Growth rate
Year
Growth rate
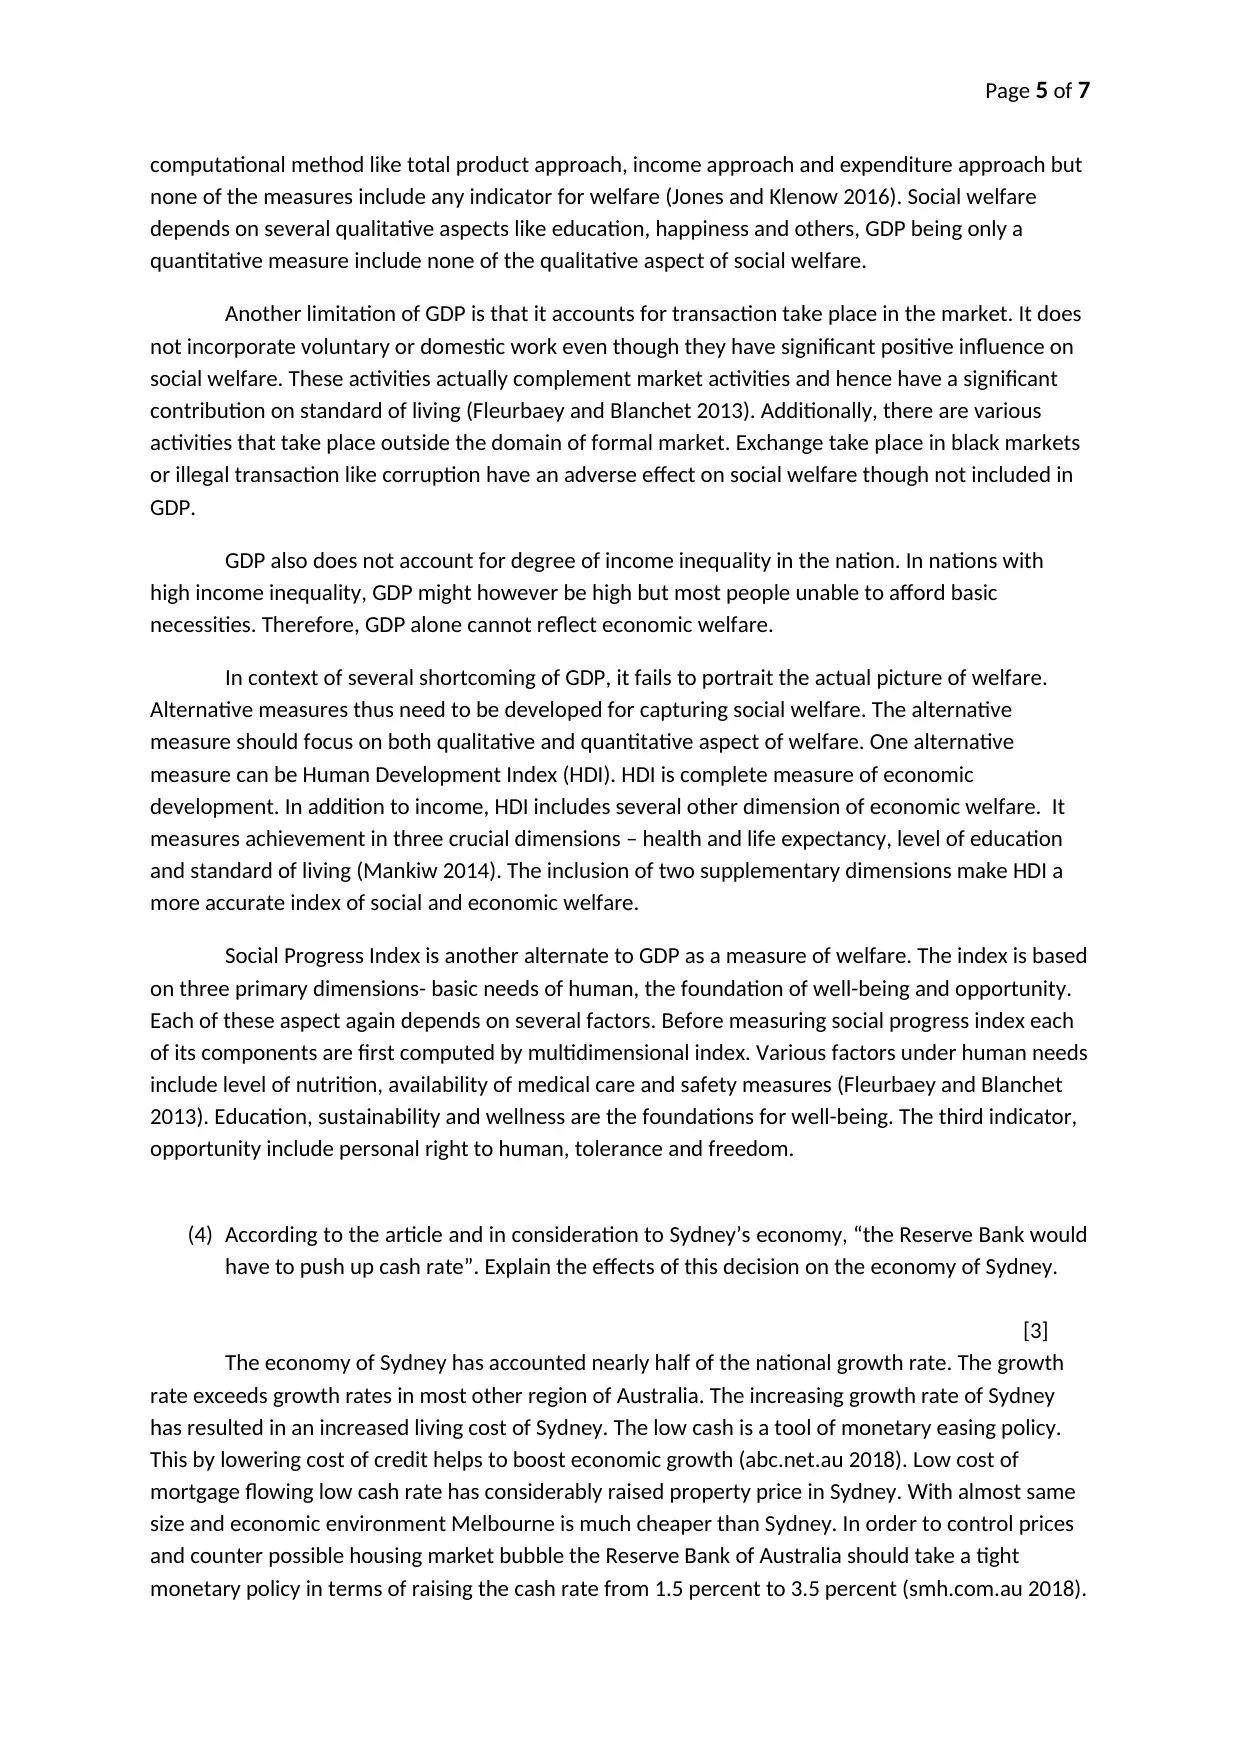
Figure 2: Growth in Victoria
The growth rate in regional Victoria recorded a weak performance in three of the last ten
years. However, in most recent years the economy is growing at a growth rate of 3.33 percent. The
growth rate is higher than the current growth rate of New South Wales. The factors contributing to a
strong growth in Victoria are strong agricultural production and associated strong growth in
manufacturing.
The higher growth of Victoria enhances economic performance of all other sectors. The
better growth performance results in economic expansion which in turn stimulates future economic
growth. The higher growth prospects of these regions contribute to a higher growth for the nation as
a whole.
(3) GDP per capita is considered a “rough measure of living standards”. Outline at least two
limitations of GDP as a measure of economic welfare and then suggest two other economic
indicators that could be useful in terms of measuring well-being, explaining your choices.
[6]
Gross Domestic Product represents the monetary value of produced goods and services of a nation
in a particular accounting year. GDP thus is a representative of aggregate activity in a nation. GDP
often used to measure the level of social welfare. The idea is to correlate different form of
expenditure with social welfare through GDP (Mankiw 2014). However, the welfare argument in line
with GDP is very simplistic. Use of GDP as an indicator of welfare have several limitations. GDP
excludes many factors that are important for social welfare.
GDP does not include any measure of welfare. It only describes the market value of finished
goods and services within a nation for a given period of time. GDP can be computed using different
1998 2000 2002 2004 2006 2008 2010 2012 2014 2016 2018
0
0.005
0.01
0.015
0.02
0.025
0.03
0.035
0.04
0.045
0.05
Victoria
Growth rate
Year
Growth rate
Figure 2: Growth in Victoria
The growth rate in regional Victoria recorded a weak performance in three of the last ten
years. However, in most recent years the economy is growing at a growth rate of 3.33 percent. The
growth rate is higher than the current growth rate of New South Wales. The factors contributing to a
strong growth in Victoria are strong agricultural production and associated strong growth in
manufacturing.
The higher growth of Victoria enhances economic performance of all other sectors. The
better growth performance results in economic expansion which in turn stimulates future economic
growth. The higher growth prospects of these regions contribute to a higher growth for the nation as
a whole.
(3) GDP per capita is considered a “rough measure of living standards”. Outline at least two
limitations of GDP as a measure of economic welfare and then suggest two other economic
indicators that could be useful in terms of measuring well-being, explaining your choices.
[6]
Gross Domestic Product represents the monetary value of produced goods and services of a nation
in a particular accounting year. GDP thus is a representative of aggregate activity in a nation. GDP
often used to measure the level of social welfare. The idea is to correlate different form of
expenditure with social welfare through GDP (Mankiw 2014). However, the welfare argument in line
with GDP is very simplistic. Use of GDP as an indicator of welfare have several limitations. GDP
excludes many factors that are important for social welfare.
GDP does not include any measure of welfare. It only describes the market value of finished
goods and services within a nation for a given period of time. GDP can be computed using different
Paraphrase This Document
Need a fresh take? Get an instant paraphrase of this document with our AI Paraphraser
Page 5 of 7
computational method like total product approach, income approach and expenditure approach but
none of the measures include any indicator for welfare (Jones and Klenow 2016). Social welfare
depends on several qualitative aspects like education, happiness and others, GDP being only a
quantitative measure include none of the qualitative aspect of social welfare.
Another limitation of GDP is that it accounts for transaction take place in the market. It does
not incorporate voluntary or domestic work even though they have significant positive influence on
social welfare. These activities actually complement market activities and hence have a significant
contribution on standard of living (Fleurbaey and Blanchet 2013). Additionally, there are various
activities that take place outside the domain of formal market. Exchange take place in black markets
or illegal transaction like corruption have an adverse effect on social welfare though not included in
GDP.
GDP also does not account for degree of income inequality in the nation. In nations with
high income inequality, GDP might however be high but most people unable to afford basic
necessities. Therefore, GDP alone cannot reflect economic welfare.
In context of several shortcoming of GDP, it fails to portrait the actual picture of welfare.
Alternative measures thus need to be developed for capturing social welfare. The alternative
measure should focus on both qualitative and quantitative aspect of welfare. One alternative
measure can be Human Development Index (HDI). HDI is complete measure of economic
development. In addition to income, HDI includes several other dimension of economic welfare. It
measures achievement in three crucial dimensions – health and life expectancy, level of education
and standard of living (Mankiw 2014). The inclusion of two supplementary dimensions make HDI a
more accurate index of social and economic welfare.
Social Progress Index is another alternate to GDP as a measure of welfare. The index is based
on three primary dimensions- basic needs of human, the foundation of well-being and opportunity.
Each of these aspect again depends on several factors. Before measuring social progress index each
of its components are first computed by multidimensional index. Various factors under human needs
include level of nutrition, availability of medical care and safety measures (Fleurbaey and Blanchet
2013). Education, sustainability and wellness are the foundations for well-being. The third indicator,
opportunity include personal right to human, tolerance and freedom.
(4) According to the article and in consideration to Sydney’s economy, “the Reserve Bank would
have to push up cash rate”. Explain the effects of this decision on the economy of Sydney.
[3]
The economy of Sydney has accounted nearly half of the national growth rate. The growth
rate exceeds growth rates in most other region of Australia. The increasing growth rate of Sydney
has resulted in an increased living cost of Sydney. The low cash is a tool of monetary easing policy.
This by lowering cost of credit helps to boost economic growth (abc.net.au 2018). Low cost of
mortgage flowing low cash rate has considerably raised property price in Sydney. With almost same
size and economic environment Melbourne is much cheaper than Sydney. In order to control prices
and counter possible housing market bubble the Reserve Bank of Australia should take a tight
monetary policy in terms of raising the cash rate from 1.5 percent to 3.5 percent (smh.com.au 2018).
Page 6 of 7
The cash rate influences borrowing and lending activities, economic activity and finally on inflation
rate on the economy. The higher cash means borrowers now have to pay a higher amount of return.
This would make borrowing less attractive to the people in Sydney. Borrowing is a major source to
finance housing demand. With a decline in borrowing, the housing demand will be reduced. This by
reducing demand of housing releasing upward pressure on housing price. With an increase in cash
rate, return on savings increases. More and more people in Sydney will now be interested to keep
their money in banks. This in turn reduces consumption demand in Sydney. The increased cash rate
thus by reducing housing price and commodity price helps to control overall inflation.
⊘ This is a preview!⊘
Do you want full access?
Subscribe today to unlock all pages.
Trusted by 1+ million students worldwide
Page 7 of 7
References
ABC News. (2018). Tell him he's dreaming: Why the RBA can't raise interest rates. [online] Available
at: http://www.abc.net.au/news/2017-07-17/interest-rates-four-reasons-why-rba-cannot-raise-
them/8714010 [Accessed 14 Apr. 2018].
Abs.gov.au. (2018). 5220.0 - Australian National Accounts: State Accounts, 2016-17. [online]
Available at: http://www.abs.gov.au/AUSSTATS/abs@.nsf/DetailsPage/5220.02016-17?
OpenDocument [Accessed 14 Apr. 2018].
Agénor, P.R. and Montiel, P.J., 2015. Development macroeconomics. Princeton University Press.
Bernanke, B., Antonovics, K. and Frank, R., 2015. Principles of macroeconomics. McGraw-Hill Higher
Education.
Fleurbaey, M. and Blanchet, D., 2013. Beyond GDP: Measuring welfare and assessing sustainability.
Oxford University Press.
Jones, C.I. and Klenow, P.J., 2016. Beyond GDP? Welfare across countries and time. American
Economic Review, 106(9), pp.2426-57.
Mankiw, N.G., 2014. Principles of macroeconomics. Cengage Learning.
Martin, P. (2018). Sydney powers the nation, accounting for almost half of Australia's economic
growth. [online] The Sydney Morning Herald. Available at: https://www.smh.com.au/business/the-
economy/sydney-powers-the-nation-accounting-for-almost-half-of-australias-economic-growth-
20171204-gzyj04.html [Accessed 14 Apr. 2018].
Sgsep.com.au. (2017). Sydney GDP 2015-2016 - SGS Economics & Planning. [online] Available at:
https://www.sgsep.com.au/publications/sydney-gdp-2015-2016 [Accessed 14 Apr. 2018].
Wade, M. (2018). Sydney's population tops five million, ABS data shows. [online] The Sydney
Morning Herald. Available at: https://www.smh.com.au/national/nsw/sydneys-population-tops-five-
million-abs-data-shows-20170330-gv9pnq.html [Accessed 14 Apr. 2018].
1 out of 7
Related Documents


Your All-in-One AI-Powered Toolkit for Academic Success.
+13062052269
info@desklib.com
Available 24*7 on WhatsApp / Email
![[object Object]](/_next/static/media/star-bottom.7253800d.svg)
Unlock your academic potential
Copyright © 2020–2026 A2Z Services. All Rights Reserved. Developed and managed by ZUCOL.