Dividend Policy in Indian Manufacturing and Service Sector
VerifiedAdded on 2022/08/16
|15
|8946
|15
Report
AI Summary
This report analyzes the dividend behavior of Indian manufacturing and service sector firms, comparing their dividend policies and identifying key determinants. The study employs panel data analysis using OLS regression and dynamic panel data analysis to address heteroscedasticity and endogeneity issues, covering the period from 2007 to 2015. The research reveals similarities in firm-level factors influencing dividend policy between the two sectors, although the manufacturing sector demonstrates higher dividend efficiency. Factors such as firm size and cash holdings positively correlate with dividend payments, while age and net working capital show negative significance in the service sector. In the manufacturing sector, profitability, firm size, and profitability are positively significant, while net working capital is negatively significant for dividend decisions. The report contributes to understanding the financial factors shaping dividend behavior in these sectors, providing valuable insights into their financial strategies and performance.
Article
Global Business Review
20(1) 1–15
© 2018 IMI
SAGE Publications
sagepub.in/home.nav
DOI: 10.1177/0972150917753863
http://journals.sagepub.com/home/gbr
1 Research Scholar, National Institute of Industrial Engineering (NITIE), Mumbai, Maharashtra, India.
2 Assistant Professor, Department of Accounting and Finance, National Institute of Industrial Engineering (N
Maharashtra, India.
Corresponding author:
Sanjeev Kumar, Research Scholar, National Institute of Industrial Engineering (NITIE), Mumbai, Maharashtra, India.
E-mail: sanjeev.kumar.2014@nitie.ac.in
Dividend Behaviour of Indian-listed
Manufacturing and Service Sector
Firms
Sanjeev Kumar1
K. S. Ranjani2
Abstract
The purpose of the study is to explore dividend behaviour of Indian manufacturing and servic
firms and to investigate similarities/differences between the same. First, the analysis i
using pooled, fixed and random effects OLS regression for panel data on 452 manufa
service sector firms for the period of 2007–2015. Further, dynamic panel data analysis has be
to deal with the heteroscedasticity and endogeneity issues among the variables for the study
asymptotic efficient estimates. The result refutes significant differences in terms of firm-leve
that determines dividend policy. However, manufacturing sector is significantly efficient in de
dividends (59.63 per cent) in comparison to service sector (34.33 per cent). Further analysis
that firm size and cash holdings have significant positive relationship to dividend paid, where
net working capital are negatively significant for dividend declarations in the service sector.
the analysis of manufacturing sector suggests that profitability and firm size and profitability
significant, while net working capital is negatively significant for dividend decisions.
Keywords
Dividend policy, Bombay Stock Exchange, service sector, manufacturing sector, generalized
moments, India
Introduction
The decision of firms to declare dividend or to retain earnings for future growth has always been dynamic
and sought to be explained through different theories. Theoretical and empirical works abound since
more than half a century. Various theories explain dividend behaviour providing a strong literature
Paraphrase This Document
Need a fresh take? Get an instant paraphrase of this document with our AI Paraphraser
2 Global Business Review 20(1)
base to amend the dividend policy as per financial status of the firm. Dividend irrelevance 1 (Miller &
Modigliani, 1961) was the first of such attempts describing that firm’s value is independent of its dividend
policy. Bird in hand 2 theory (Gordon, 1963; Lintner, 1962) argues that investor will make a trade-off
between the dividends paid today or the opportunity of capital gains in the future, strongly emphasizing
the effect of dividend policy on the value of the firm. Agency cost3 (Easterbrook, 1984; Jensen &
Meckling, 1976; Rozeff, 1982) theory explains the importance of dividends in minimizing the agency
cost to the firm thus, contributing to the value of the firm. Later, Life cycle4 (Mueller, 1972), Information
asymmetry and signalling theory5 (Bhattacharya, 1979) and free cash flow hypotheses6 (Lang &
Litzenberger, 1989) tried to explain the role of firm-level factors in determining dividend policy. Firm-
level factors such as age, size, ownership classification, cash holdings, leverage, net working capital,
risk, growth and profitability were used as the main explanatory variables to validate the theories
empirically. However, the convergence on these theories is yet to be achieved due to the assumptions
linked to each theory. Literature suggests strong evidence that dividend policy varies to a large number
of factors ranging from macroeconomic, industry- and firm-level factors. Previous studies were primarily
focussed on explaining the probability of dividend distribution taking firm-level factors as control
variables using the heterogeneous sample of firms from predefined indexes or set of firms. Also, some
studies focussed on the industry- and country-level variances to explain the dividend behaviour of the
firms (Denis & Osobov, 2008). However, sectoral differences between the firms were often overlooked
in the understanding of dividend policies of the firms. The objective of the current study is to explore
the determinants of dividend policy among manufacturing and service sector among Bombay Stock
Exchange (BSE)-listed firms. The study is motivated from the fact that there is a vast difference in the
way these sectors work. Manufacturing sector is highly dependent on the investments on plant and
machineries, whereas service sector is more dependent on human capital that requires lesser initial
investment. Service sector has grown tremendously during last two decades beating the orthodox odds
of dependence of profitability of firm on huge plant and machineries. However, the stability of service
sector firms is still subjected to various questions ranging from their survival, life cycle and profitability.
Manufacturing sector in India has faced a diminishing growth rate during the same period of time.
The important point that we want to address is that there exists a considerable amount of difference
between these sectors that may cause variations in dividend behaviour of these sectors. The study will
contribute to understand the relative role of financial factors to understand the existing dividend
behaviour in manufacturing and service sector firms of India. The article is formatted into seven sections
which includes, first, the introduction to the article followed by review of literature and objectives of the
study along with model proposed in the second and third section, respectively. Data and methodology
followed by descriptive statistics is discussed in the fourth and fifth section. The article is concluded into
results and discussion in the sixth section and finally, conclusion in the seventh section.
Review of Literature
Several studies have been conducted to explore the determinants of dividend policy around the globe.
Literature suggests theoretical and empirical support for variables such as corporate size, age, ownership
structure, market risk, cash holdings, leverage, growth opportunities, net working capital and profitability
of the firm. The aforementioned factors have been explicitly discussed in the following section to provide
base for the model proposed.
Kumar and Ranjani 3
Age
The importance of age can be understood from the fact that there is a huge gap between the number of
start-ups and survival of the firms which reflects that it takes a significant time to achieve their break-
evens and become profitable. Since dividend is usually paid out of profits there is a high probability that
younger firms will try to retain profits for future growth opportunities. According to a study conducted
on Swiss firms addressing success of start-up firms by Tobias Stucki (2014), only found 12 per cent firms
were able to survive in the sample period of 1996–2006 since incorporation out of 7,112 firms. Further,
many studies have reported age as a significant factor for credit constraints, that is, younger firms are
more credit constraint than older firms which means that younger firms will try to avoid dividend
payments (Cabral & Mata, 2003). Hadlock and Pierce (2010) said that age is the best proxy for judging
the firms credit constraints. Firms which are financially constrained will try to avoid dividend payments
due to internal funding requirements.
Ownership Structure
Ownership structure of the firms is responsible for various characteristics of the firm. In most of the
cases firms associated with a business group have easier access to funds for the future investment oppor-
tunities. Such firms are always considered less risky due to association with the diversified business
group. Most of the funding requirements are done through parent company and external finance is avail-
able at a relatively cheaper rate than for individual companies. Short, Zhang and Keasey (2002) reported
a positive association between dividend pay-out policy and business group affiliation by taking evidence
from a UK panel data set. The model was analysed by taking reference from dividend models of Lintner
(1956) and Fama and Babiak (1968). Firms also use dividend policy as a trade-off to lower agency cost
for the group companies (Chen & Steiner, 1999; Shleifer & Vishny, 1986). Chen, Cheung, Stouraitis and
Wong (2005) reported insignificant relationship between ownership structure and dividend policy.
Subramaniam, Tang, Yue and Zhou (2011) reported that there is a positive significant relationship
between ownership structure and dividend policy.
Risk
Market risk is an important determinant for the dividend policy as it reflects the stability of the firm
in the eyes of the investor. Higher volatility in the share price reflects information asymmetry and
larger dependence on external finance. According to the study conducted by Rozeff (1982), risk has a
negative influence on the dividend pay-out of the firm. Later, D’Souza and Saxena (1999) confirmed the
aforementioned results on the international perspective using DataStream database and World scope
disclosure reports. Amidu and Abor (2006) also reported negative influence of market risk on dividend
policy in their study conducted on the firms listed on the Ghana stock exchange. Recent research by
Bartram, Brown & Waller (2015) and Baker and Jabbouri (2016) also reported a significant negative
relation between dividend policy and firm risk.
⊘ This is a preview!⊘
Do you want full access?
Subscribe today to unlock all pages.
Trusted by 1+ million students worldwide
4 Global Business Review 20(1)
Cash
The amount of cash that a company holds can be seen as the indicator of growth opportunities available
to the firm. Firms may hold more cash either because of paucity of opportunities or in anticipation of
future opportunities (Jensen, 1986). Such firms may choose to pay dividends instead of choosing sub-
optimum investment options, but smaller firms might choose to stock cash to meet up future funding
requirements rather than going for costly external finance. There is large thread of literature which shows
a positive relationship between cash flows and dividend policy (Agrawal & Jayaraman, 1994; Chen,
Chou, & Lee, 2014; Lang & Litzenberger, 1989; Subramaniam et al., 2011). However, Denis, Denis and
Sarin (1994) did not support the overinvestment problem and reported insignificant relationship between
cash flow and dividend policy.
Leverage
Capital structure is the main characteristic which derives the value of the firm. The optimal mix of debt
and equity is the prime objective to achieve to maximize the value of the firm. Leverage is also discussed
as an important determinant of dividend policy as highly levered firm will prefer to pay back the princi-
ple debt instead of paying dividends. The interest expenses are directly proportional to the degree of
financial leverage. Also firms prefer to fund the investment opportunities from external finance for the
sake of tax benefits rather than issuing risky equity shares for the project. The literature suggests a nega-
tive relationship between leverage and dividend policy (Fan & Sundaresan, 2000; Jensen, Solberg, &
Zorn, 1992; John & Muthusamy, 2010; Papadopoulos & Charalambidis, 2007).
Growth Opportunities
Profitable investment opportunities available to the firms are termed as growth opportunities. Firms
would prefer cheaper internal finance to fund these growth opportunities rather than resort to costly
external finance (Myers & Majluf, 1984). Rozeff (1982), Lloyd Jahera & Page (1985) and Manos (2002)
reported significant negative relationship between growth opportunities and dividend policy of the firm.
Presence of growth opportunities diminish the possibility of dividend pay-out.
Net Working Capital
Net working capital is a major factor for the firm as recognized by famous economist Adam Smith.
Authors such as Schiff and Lieber (1974), Smith (1980) and Kim and Chung (1990) reported that firm
performance is affected by working capital decisions. While empirical evidence suggests that efficient
working capital management enhances profitability (Deloof, 2003; Jose, Lancaster, & Stevens, 1996;
Shin & Soenen, 1998; Wang, 2002), reducing working capital investment is likely to bring affirmative
results to profitability (Juan García-Teruel & Martinez-Solano, 2007). Hence, efficient working capital
management or reduced working capital holding is likely to facilitate dividend decisions.
Paraphrase This Document
Need a fresh take? Get an instant paraphrase of this document with our AI Paraphraser
Kumar and Ranjani 5
Profitability of the Firm
The primary source of dividend payments is from the profits of the firm hence it is considered that higher
the profitability of the firm more will be the chances of dividend pay-out (Anil & Kapoor, 2008). Seminal
work of Lintner (1956) found that earnings are the most important determinants of dividend policy
which was later supported by Fama and Babiak (1968), Ryan (1974), Shevlin (1982) and Allen (1992).
Further studies by Baker, Farrelly and Edelman (1985), Pruitt and Gitman (1991) and Baker and Powell
(1999) reported that future earnings and the pattern of past dividends were the main determinants of
dividend payments. They also found that current dividends are influenced by the current as well as past
level of earnings as also the growth rate of earnings. Significant positive relationship between profitability
and dividend policy is confirmed by Nissim and Ziv (2001), Amidu (2007), Howatt, Zuber, Gandar and
Lamb (2009) and Ajanthan (2013).
While these results are highly intuitive and plausible, Farsio, Geary and Moser (2004) and John and
Muthusamy (2010) reported insignificant and negative relationship between profitability and dividend
policy. Farsio et al. (2004) explained his results by using a longer period of analysis (1988–2002). Further,
latest study from Batra and Kalia (2016) reported corporate profitability as the driver for dividend
payments.
Size of the Firm
Size of the firm is one of the most important determinant of the dividend policy as suggested by the
literature. Large companies pay more dividends in comparison to smaller firms as they have saturated
growth rates and access to cheap external finance. Dividends are used as a tool to avoid information
asymmetry problems (Bhattacharya, 1979) later on also supported by (Aharony & Swary, 1980; John &
Williams, 1985; Miller & Rock, 1985). Previous studies also suggest that larger firms pay dividends to
signal financial soundness and lower agency conflicts for the firm (Jensen & Meckling, 1976). Another
important reason for smaller firms for paying dividends is the costly external finance which they would
require if a profitable investment opportunity would be available to them (Holder, Langrehr, & Hexter,
1998). Larger firms usually have access to diversified technology, market and trusted business partners
which reduces the risk of the firm in comparison to small firms (Behr & Güttler, 2007; Harhoff &
Körting, 1998). Lower risk rates can help in improving profitability of large firms which can be linked
to dividend decisions of the firms.
Objectives of the Study and Model Proposed
The main objective of the study is to find out the sectoral divergence in terms of dividend behaviour
among Indian-listed manufacturing and service sector firms, if any. It also analyse the same for the mana-
gerial implications derived out of the relationship among the factors of the study. The model proposed for
the study used variables that affected dividend policy as suggested by the literature. The variables are
analysed using OLS regression, and OLS using fixed and random effects estimator Equation (3). Further
dynamic panel data equation as specified by Arellano and Bond (1991) is used by taking lags of the
dependent variable and instrumental variables to control for heterogeneity in Equation (4).
Y X, , , ,i t i t i t i ta b f= + +to (1)
6 Global Business Review 20(1)
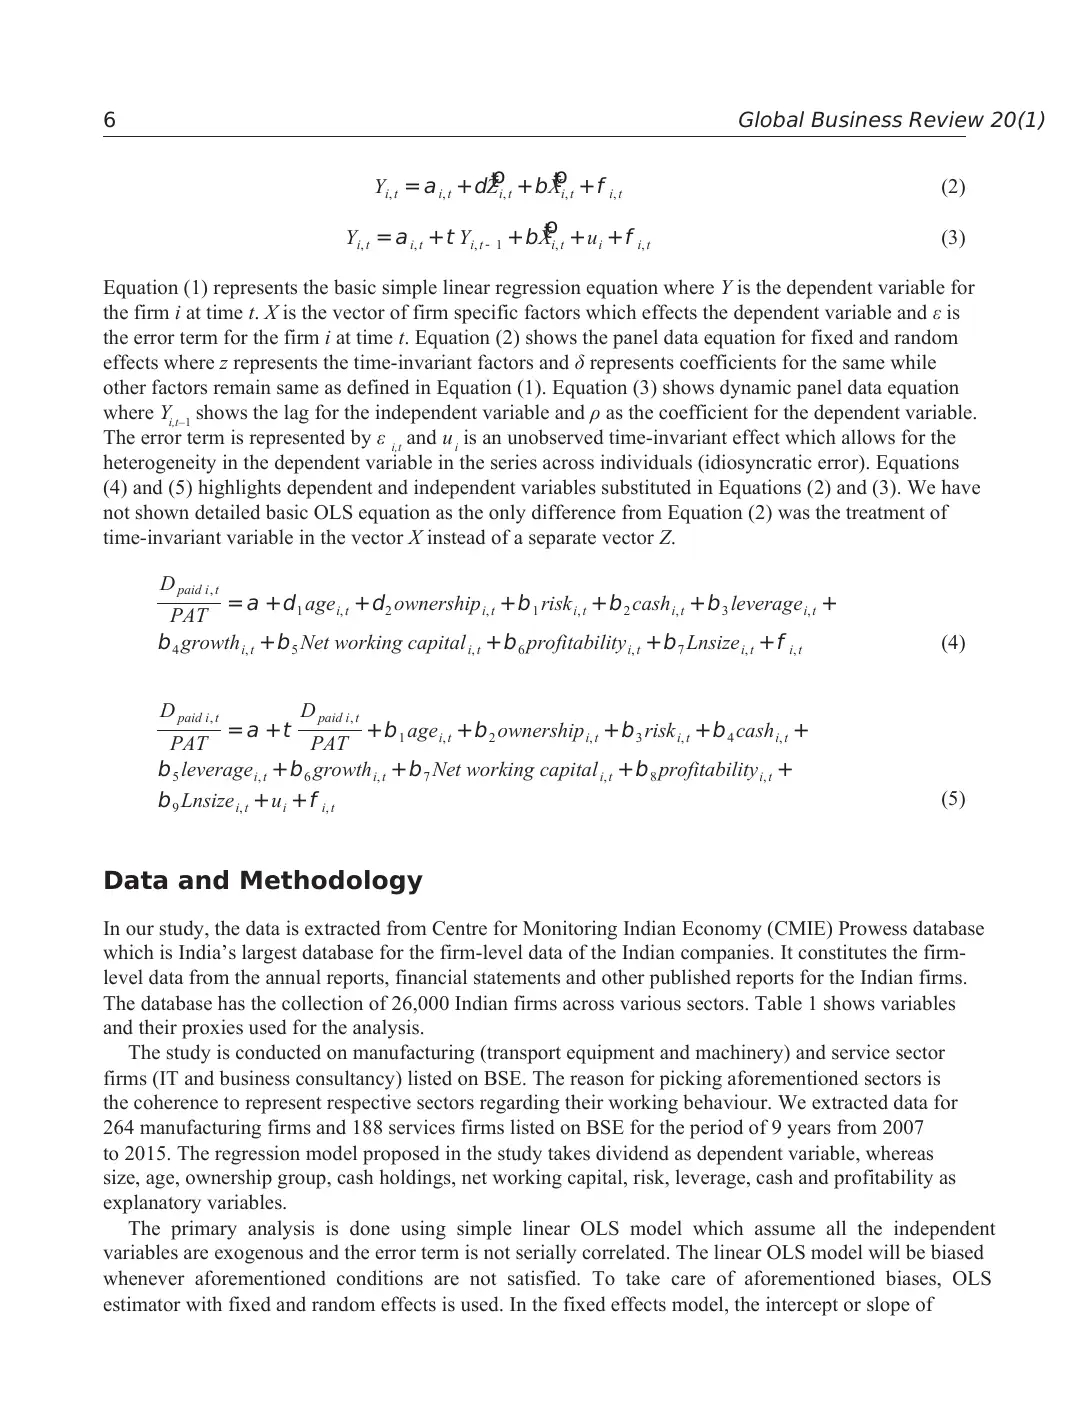
Y Z X, , , , ,i t i t i t i t i ta d b f= + + +to to (2)
Y Y uX, , , 1 , ,i t i t i t i t i i ta t b f= + + + +- to (3)
Equation (1) represents the basic simple linear regression equation where Y is the dependent variable for
the firm i at time t. X is the vector of firm specific factors which effects the dependent variable and ε is
the error term for the firm i at time t. Equation (2) shows the panel data equation for fixed and random
effects where z represents the time-invariant factors and δ represents coefficients for the same while
other factors remain same as defined in Equation (1). Equation (3) shows dynamic panel data equation
where Yi,t–1 shows the lag for the independent variable and ρ as the coefficient for the dependent variable.
The error term is represented by ε i,t and ui is an unobserved time-invariant effect which allows for the
heterogeneity in the dependent variable in the series across individuals (idiosyncratic error). Equations
(4) and (5) highlights dependent and independent variables substituted in Equations (2) and (3). We have
not shown detailed basic OLS equation as the only difference from Equation (2) was the treatment of
time-invariant variable in the vector X instead of a separate vector Z.
PAT
D age ownership risk cash leverage
growth Net working capital profitability Lnsize
,
1 , 2 , 1 , 2 , 3 ,
4 , 5 , 6 , 7 , ,
paid i t
i t i t i t i t i t
i t i t i t i t i t
a d d b b b
b b b b f
= + + + + + +
+ + + + (4)
PAT
D
PAT
D age ownership risk cash
leverage growth Net working capital profitability
Lnsize u
, ,
1 , 2 , 3 , 4 ,
5 , 6 , 7 , 8 ,
9 , ,
paid i t paid i t
i t i t i t i t
i t i t i t i t
i t i i t
a t b b b b
b b b b
b f
= + + + + + +
+ + + +
+ + (5)
Data and Methodology
In our study, the data is extracted from Centre for Monitoring Indian Economy (CMIE) Prowess database
which is India’s largest database for the firm-level data of the Indian companies. It constitutes the firm-
level data from the annual reports, financial statements and other published reports for the Indian firms.
The database has the collection of 26,000 Indian firms across various sectors. Table 1 shows variables
and their proxies used for the analysis.
The study is conducted on manufacturing (transport equipment and machinery) and service sector
firms (IT and business consultancy) listed on BSE. The reason for picking aforementioned sectors is
the coherence to represent respective sectors regarding their working behaviour. We extracted data for
264 manufacturing firms and 188 services firms listed on BSE for the period of 9 years from 2007
to 2015. The regression model proposed in the study takes dividend as dependent variable, whereas
size, age, ownership group, cash holdings, net working capital, risk, leverage, cash and profitability as
explanatory variables.
The primary analysis is done using simple linear OLS model which assume all the independent
variables are exogenous and the error term is not serially correlated. The linear OLS model will be biased
whenever aforementioned conditions are not satisfied. To take care of aforementioned biases, OLS
estimator with fixed and random effects is used. In the fixed effects model, the intercept or slope of
⊘ This is a preview!⊘
Do you want full access?
Subscribe today to unlock all pages.
Trusted by 1+ million students worldwide
Kumar and Ranjani 7
variables is assumed to be time invariant but will differ among individuals and the error term intercepts
as time variant. To find out which model is appropriate Hausman test (1978) for fixed and random
effects was applied with the null hypotheses stating that random model is appropriate. In the fixed effect
model age and ownership are omitted because of collinearity conditions and time-variant effect on the
independent variables.
We estimate Equation (5) using the one-step and two-step generalized method of moments (GMM)
estimator for dynamic panel data model developed by Arellano and Bond (1991). GMM is among the
most frequently used methods due to its capacities of convenience in deriving normally distributed
estimators of the statistical model Hall (2005). The advantage of using GMM is the efficient results
which it brings by taking the unobserved heterogeneity into account. Further, two-step GMM is used to
improve asymptotic efficiency in comparison to one-step estimates. Also endogeneity problems are
taken care of by using lag of dependent variable and substituting instruments for explanatory variables.
We allowed maximum one lag of dependent variable to be used as instruments. The autoregression of
order AR (2) is used in the analysis.
Descriptive Statistics
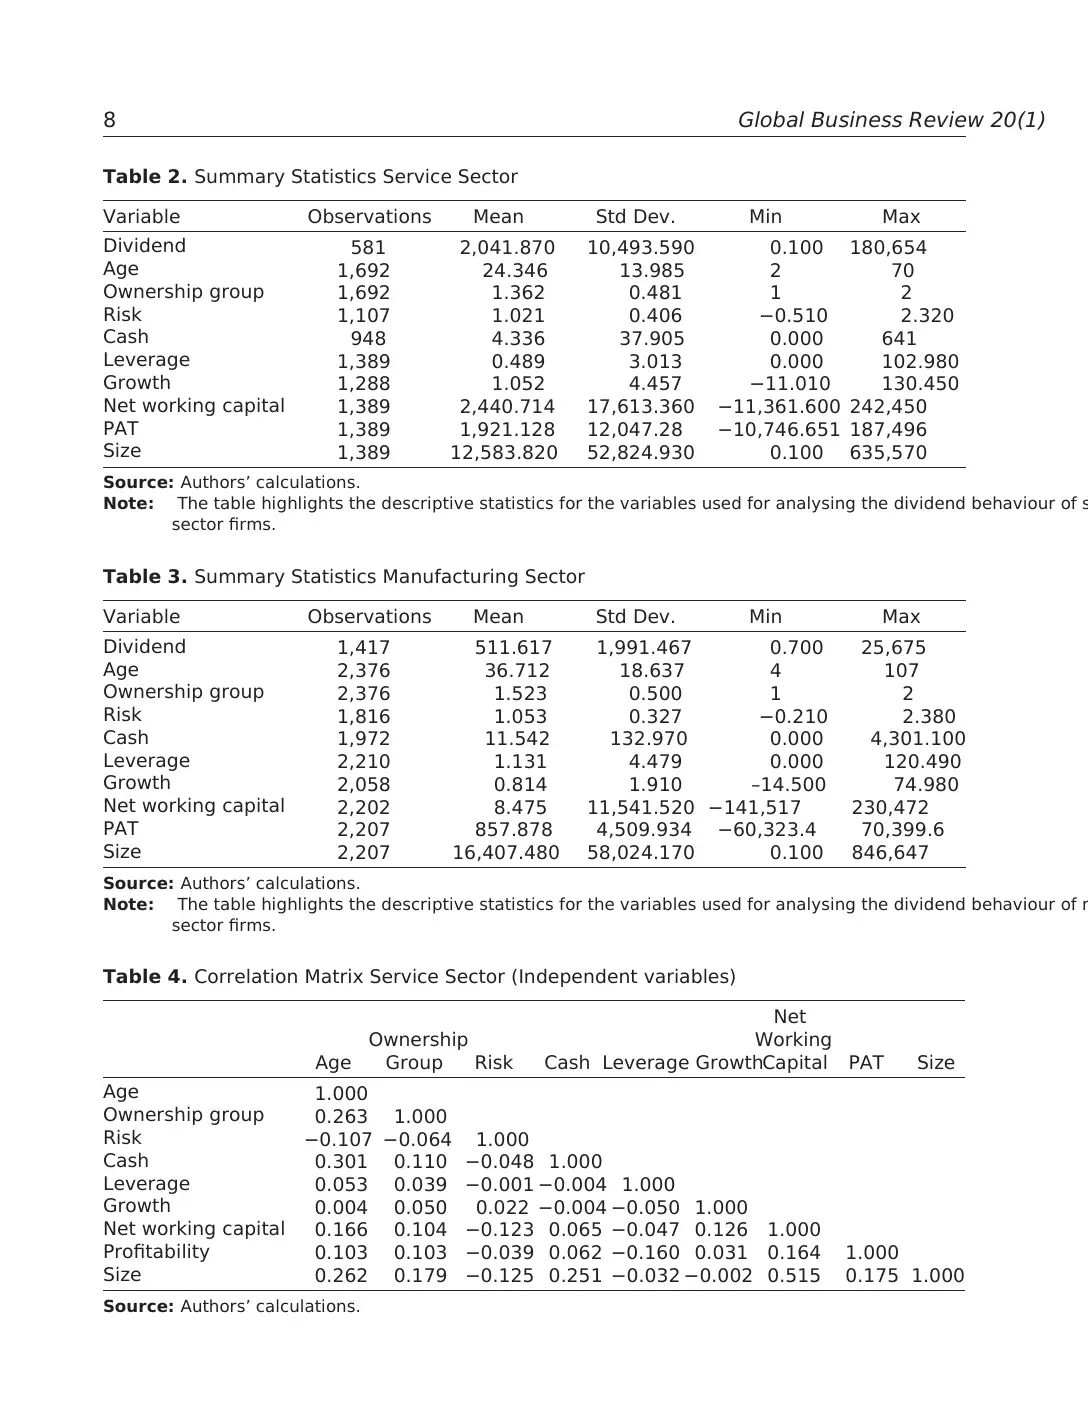
The descriptive statistics of variables taken for manufacturing and service sector has been shown in
Tables 2 and 3, respectively. Maximum observations are recorded for age and ownership for manufacturing
(2,376) and service sector (1,692), respectively. Dependent variable dividend is recorded only for 581
out of 1,692 observations in service sector while manufacturing sector recorded 1,417 out of 2,376
observations. Overall manufacturing sector has exhaustive data compared to service sector in terms of
missing values. Data clearly suggest that manufacturing firms are much efficient than service sector in
declaring dividends (59.63 per cent in comparison to 34.33 per cent).
The correlation matrix for independent variables has been shown in Tables 3 and 4. In the service
sector, size is reported to be highly correlated with net working capital with the positive correlation of
0.515 which shows positive association between size and net working capital of the firm. In addition,
cash is also found to be correlated with size and age with the positive values of 0.251 and 0.301 implying
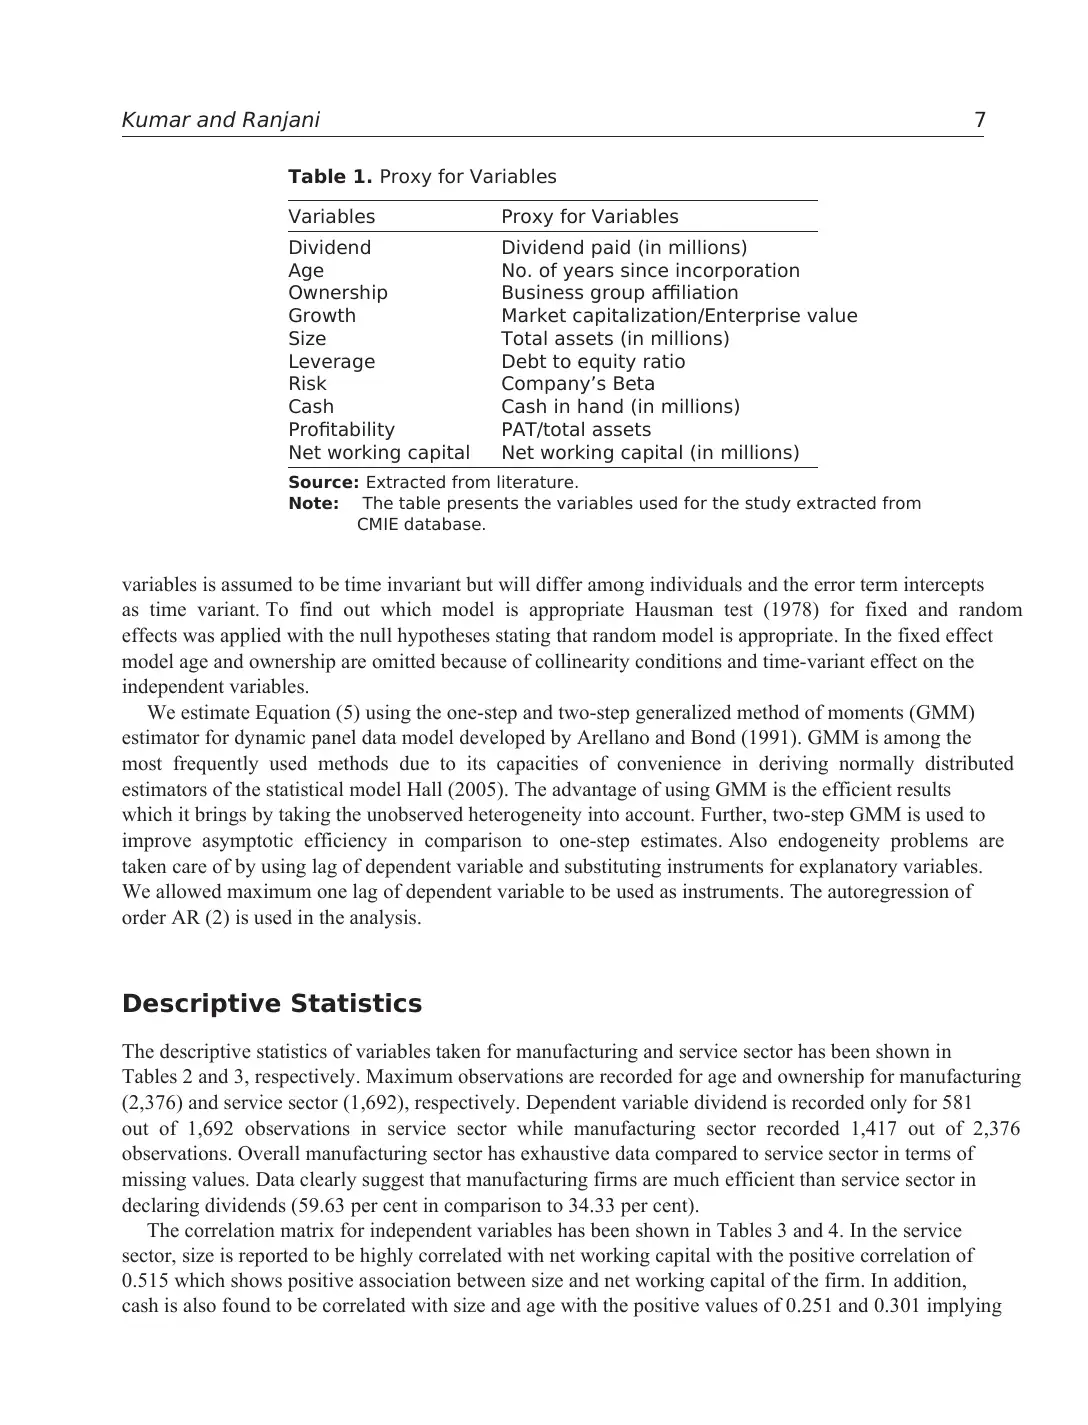
Table 1. Proxy for Variables
Variables Proxy for Variables
Dividend Dividend paid (in millions)
Age No. of years since incorporation
Ownership Business group affiliation
Growth Market capitalization/Enterprise value
Size Total assets (in millions)
Leverage Debt to equity ratio
Risk Company’s Beta
Cash Cash in hand (in millions)
Profitability PAT/total assets
Net working capital Net working capital (in millions)
Source: Extracted from literature.
Note: The table presents the variables used for the study extracted from
CMIE database.
variables is assumed to be time invariant but will differ among individuals and the error term intercepts
as time variant. To find out which model is appropriate Hausman test (1978) for fixed and random
effects was applied with the null hypotheses stating that random model is appropriate. In the fixed effect
model age and ownership are omitted because of collinearity conditions and time-variant effect on the
independent variables.
We estimate Equation (5) using the one-step and two-step generalized method of moments (GMM)
estimator for dynamic panel data model developed by Arellano and Bond (1991). GMM is among the
most frequently used methods due to its capacities of convenience in deriving normally distributed
estimators of the statistical model Hall (2005). The advantage of using GMM is the efficient results
which it brings by taking the unobserved heterogeneity into account. Further, two-step GMM is used to
improve asymptotic efficiency in comparison to one-step estimates. Also endogeneity problems are
taken care of by using lag of dependent variable and substituting instruments for explanatory variables.
We allowed maximum one lag of dependent variable to be used as instruments. The autoregression of
order AR (2) is used in the analysis.
Descriptive Statistics
The descriptive statistics of variables taken for manufacturing and service sector has been shown in
Tables 2 and 3, respectively. Maximum observations are recorded for age and ownership for manufacturing
(2,376) and service sector (1,692), respectively. Dependent variable dividend is recorded only for 581
out of 1,692 observations in service sector while manufacturing sector recorded 1,417 out of 2,376
observations. Overall manufacturing sector has exhaustive data compared to service sector in terms of
missing values. Data clearly suggest that manufacturing firms are much efficient than service sector in
declaring dividends (59.63 per cent in comparison to 34.33 per cent).
The correlation matrix for independent variables has been shown in Tables 3 and 4. In the service
sector, size is reported to be highly correlated with net working capital with the positive correlation of
0.515 which shows positive association between size and net working capital of the firm. In addition,
cash is also found to be correlated with size and age with the positive values of 0.251 and 0.301 implying
Table 1. Proxy for Variables
Variables Proxy for Variables
Dividend Dividend paid (in millions)
Age No. of years since incorporation
Ownership Business group affiliation
Growth Market capitalization/Enterprise value
Size Total assets (in millions)
Leverage Debt to equity ratio
Risk Company’s Beta
Cash Cash in hand (in millions)
Profitability PAT/total assets
Net working capital Net working capital (in millions)
Source: Extracted from literature.
Note: The table presents the variables used for the study extracted from
CMIE database.
Paraphrase This Document
Need a fresh take? Get an instant paraphrase of this document with our AI Paraphraser
8 Global Business Review 20(1)
Table 2. Summary Statistics Service Sector
Variable Observations Mean Std Dev. Min Max
Dividend 581 2,041.870 10,493.590 0.100 180,654
Age 1,692 24.346 13.985 2 70
Ownership group 1,692 1.362 0.481 1 2
Risk 1,107 1.021 0.406 −0.510 2.320
Cash 948 4.336 37.905 0.000 641
Leverage 1,389 0.489 3.013 0.000 102.980
Growth 1,288 1.052 4.457 −11.010 130.450
Net working capital 1,389 2,440.714 17,613.360 −11,361.600 242,450
PAT 1,389 1,921.128 12,047.28 −10,746.651 187,496
Size 1,389 12,583.820 52,824.930 0.100 635,570
Source: Authors’ calculations.
Note: The table highlights the descriptive statistics for the variables used for analysing the dividend behaviour of s
sector firms.
Table 3. Summary Statistics Manufacturing Sector
Variable Observations Mean Std Dev. Min Max
Dividend 1,417 511.617 1,991.467 0.700 25,675
Age 2,376 36.712 18.637 4 107
Ownership group 2,376 1.523 0.500 1 2
Risk 1,816 1.053 0.327 −0.210 2.380
Cash 1,972 11.542 132.970 0.000 4,301.100
Leverage 2,210 1.131 4.479 0.000 120.490
Growth 2,058 0.814 1.910 –14.500 74.980
Net working capital 2,202 8.475 11,541.520 −141,517 230,472
PAT 2,207 857.878 4,509.934 −60,323.4 70,399.6
Size 2,207 16,407.480 58,024.170 0.100 846,647
Source: Authors’ calculations.
Note: The table highlights the descriptive statistics for the variables used for analysing the dividend behaviour of m
sector firms.
Table 4. Correlation Matrix Service Sector (Independent variables)
Age
Ownership
Group Risk Cash Leverage Growth
Net
Working
Capital PAT Size
Age 1.000
Ownership group 0.263 1.000
Risk −0.107 −0.064 1.000
Cash 0.301 0.110 −0.048 1.000
Leverage 0.053 0.039 −0.001 −0.004 1.000
Growth 0.004 0.050 0.022 −0.004 −0.050 1.000
Net working capital 0.166 0.104 −0.123 0.065 −0.047 0.126 1.000
Profitability 0.103 0.103 −0.039 0.062 −0.160 0.031 0.164 1.000
Size 0.262 0.179 −0.125 0.251 −0.032 −0.002 0.515 0.175 1.000
Source: Authors’ calculations.
Kumar and Ranjani 9
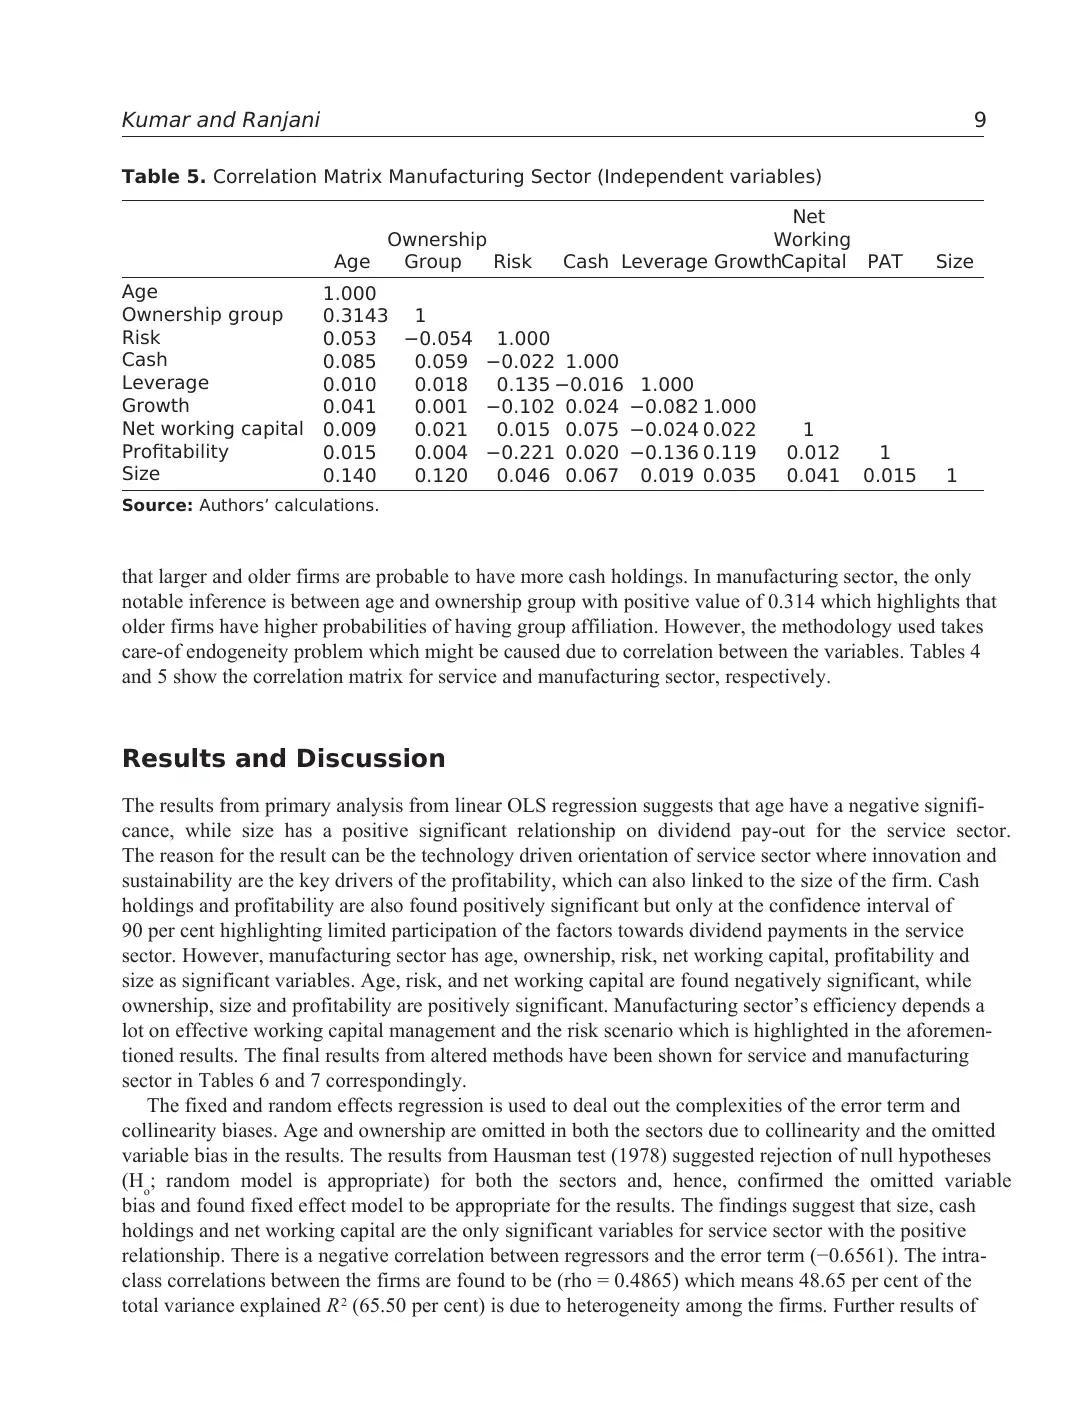
that larger and older firms are probable to have more cash holdings. In manufacturing sector, the only
notable inference is between age and ownership group with positive value of 0.314 which highlights that
older firms have higher probabilities of having group affiliation. However, the methodology used takes
care-of endogeneity problem which might be caused due to correlation between the variables. Tables 4
and 5 show the correlation matrix for service and manufacturing sector, respectively.
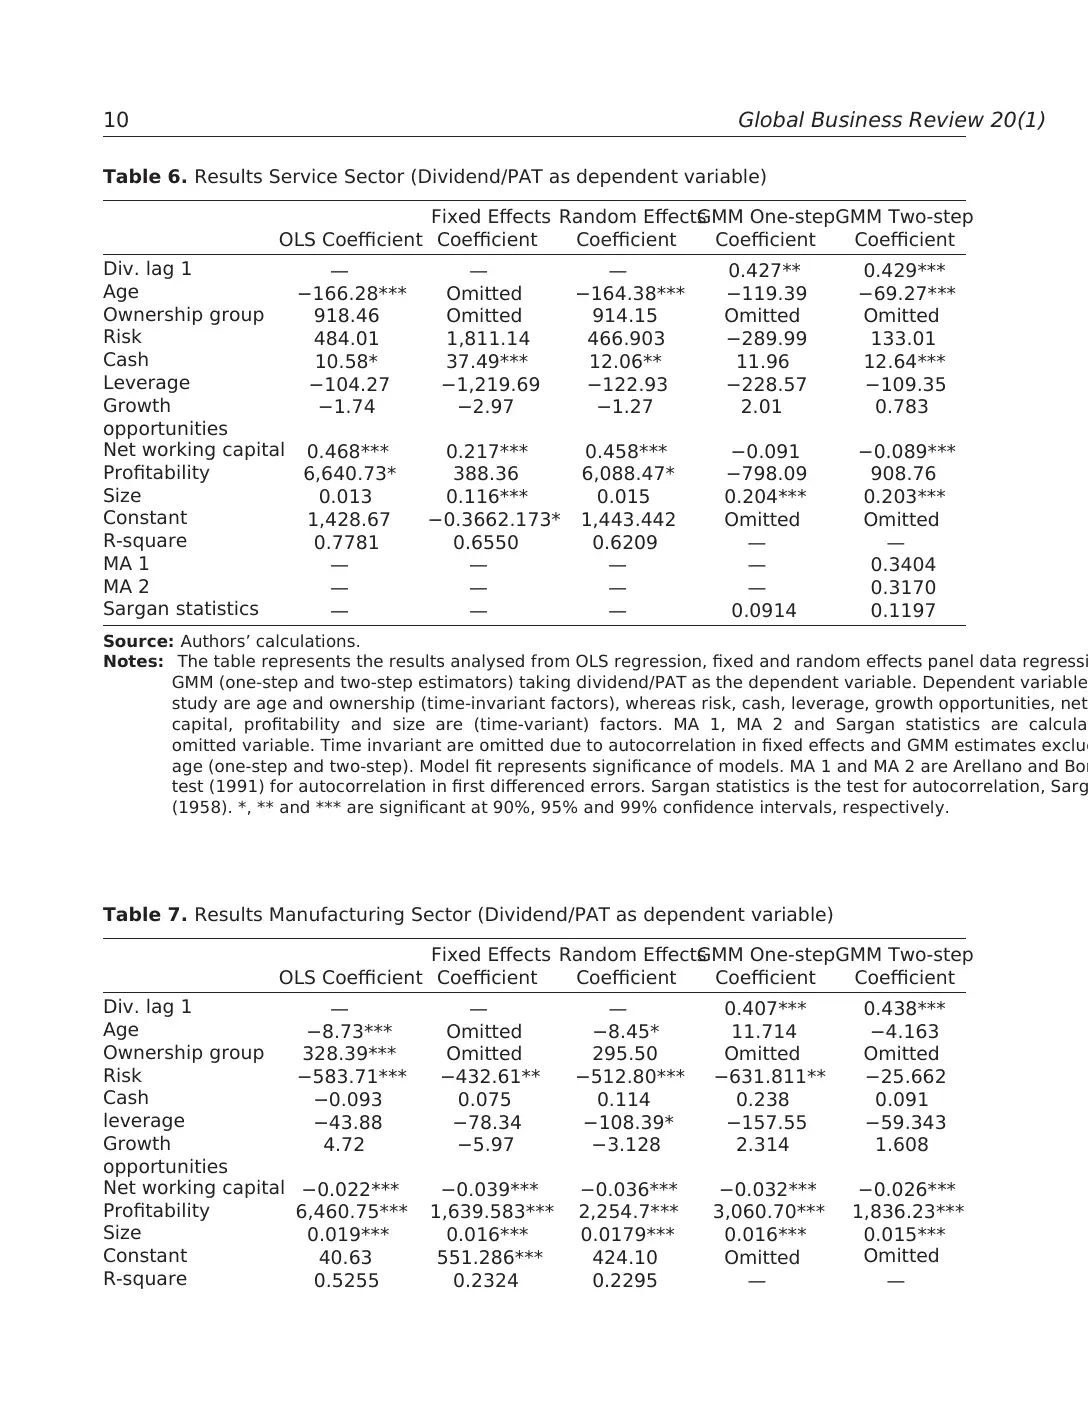
Results and Discussion
The results from primary analysis from linear OLS regression suggests that age have a negative signifi-
cance, while size has a positive significant relationship on dividend pay-out for the service sector.
The reason for the result can be the technology driven orientation of service sector where innovation and
sustainability are the key drivers of the profitability, which can also linked to the size of the firm. Cash
holdings and profitability are also found positively significant but only at the confidence interval of
90 per cent highlighting limited participation of the factors towards dividend payments in the service
sector. However, manufacturing sector has age, ownership, risk, net working capital, profitability and
size as significant variables. Age, risk, and net working capital are found negatively significant, while
ownership, size and profitability are positively significant. Manufacturing sector’s efficiency depends a
lot on effective working capital management and the risk scenario which is highlighted in the aforemen-
tioned results. The final results from altered methods have been shown for service and manufacturing
sector in Tables 6 and 7 correspondingly.
The fixed and random effects regression is used to deal out the complexities of the error term and
collinearity biases. Age and ownership are omitted in both the sectors due to collinearity and the omitted
variable bias in the results. The results from Hausman test (1978) suggested rejection of null hypotheses
(Ho; random model is appropriate) for both the sectors and, hence, confirmed the omitted variable
bias and found fixed effect model to be appropriate for the results. The findings suggest that size, cash
holdings and net working capital are the only significant variables for service sector with the positive
relationship. There is a negative correlation between regressors and the error term (−0.6561). The intra-
class correlations between the firms are found to be (rho = 0.4865) which means 48.65 per cent of the
total variance explained R2 (65.50 per cent) is due to heterogeneity among the firms. Further results of
Table 5. Correlation Matrix Manufacturing Sector (Independent variables)
Age
Ownership
Group Risk Cash Leverage Growth
Net
Working
Capital PAT Size
Age 1.000
Ownership group 0.3143 1
Risk 0.053 −0.054 1.000
Cash 0.085 0.059 −0.022 1.000
Leverage 0.010 0.018 0.135 −0.016 1.000
Growth 0.041 0.001 −0.102 0.024 −0.082 1.000
Net working capital 0.009 0.021 0.015 0.075 −0.024 0.022 1
Profitability 0.015 0.004 −0.221 0.020 −0.136 0.119 0.012 1
Size 0.140 0.120 0.046 0.067 0.019 0.035 0.041 0.015 1
Source: Authors’ calculations.
that larger and older firms are probable to have more cash holdings. In manufacturing sector, the only
notable inference is between age and ownership group with positive value of 0.314 which highlights that
older firms have higher probabilities of having group affiliation. However, the methodology used takes
care-of endogeneity problem which might be caused due to correlation between the variables. Tables 4
and 5 show the correlation matrix for service and manufacturing sector, respectively.
Results and Discussion
The results from primary analysis from linear OLS regression suggests that age have a negative signifi-
cance, while size has a positive significant relationship on dividend pay-out for the service sector.
The reason for the result can be the technology driven orientation of service sector where innovation and
sustainability are the key drivers of the profitability, which can also linked to the size of the firm. Cash
holdings and profitability are also found positively significant but only at the confidence interval of
90 per cent highlighting limited participation of the factors towards dividend payments in the service
sector. However, manufacturing sector has age, ownership, risk, net working capital, profitability and
size as significant variables. Age, risk, and net working capital are found negatively significant, while
ownership, size and profitability are positively significant. Manufacturing sector’s efficiency depends a
lot on effective working capital management and the risk scenario which is highlighted in the aforemen-
tioned results. The final results from altered methods have been shown for service and manufacturing
sector in Tables 6 and 7 correspondingly.
The fixed and random effects regression is used to deal out the complexities of the error term and
collinearity biases. Age and ownership are omitted in both the sectors due to collinearity and the omitted
variable bias in the results. The results from Hausman test (1978) suggested rejection of null hypotheses
(Ho; random model is appropriate) for both the sectors and, hence, confirmed the omitted variable
bias and found fixed effect model to be appropriate for the results. The findings suggest that size, cash
holdings and net working capital are the only significant variables for service sector with the positive
relationship. There is a negative correlation between regressors and the error term (−0.6561). The intra-
class correlations between the firms are found to be (rho = 0.4865) which means 48.65 per cent of the
total variance explained R2 (65.50 per cent) is due to heterogeneity among the firms. Further results of
Table 5. Correlation Matrix Manufacturing Sector (Independent variables)
Age
Ownership
Group Risk Cash Leverage Growth
Net
Working
Capital PAT Size
Age 1.000
Ownership group 0.3143 1
Risk 0.053 −0.054 1.000
Cash 0.085 0.059 −0.022 1.000
Leverage 0.010 0.018 0.135 −0.016 1.000
Growth 0.041 0.001 −0.102 0.024 −0.082 1.000
Net working capital 0.009 0.021 0.015 0.075 −0.024 0.022 1
Profitability 0.015 0.004 −0.221 0.020 −0.136 0.119 0.012 1
Size 0.140 0.120 0.046 0.067 0.019 0.035 0.041 0.015 1
Source: Authors’ calculations.
⊘ This is a preview!⊘
Do you want full access?
Subscribe today to unlock all pages.
Trusted by 1+ million students worldwide
10 Global Business Review 20(1)
Table 6. Results Service Sector (Dividend/PAT as dependent variable)
OLS Coefficient
Fixed Effects
Coefficient
Random Effects
Coefficient
GMM One-step
Coefficient
GMM Two-step
Coefficient
Div. lag 1 — — — 0.427** 0.429***
Age −166.28*** Omitted −164.38*** −119.39 −69.27***
Ownership group 918.46 Omitted 914.15 Omitted Omitted
Risk 484.01 1,811.14 466.903 −289.99 133.01
Cash 10.58* 37.49*** 12.06** 11.96 12.64***
Leverage −104.27 −1,219.69 −122.93 −228.57 −109.35
Growth
opportunities
−1.74 −2.97 −1.27 2.01 0.783
Net working capital 0.468*** 0.217*** 0.458*** −0.091 −0.089***
Profitability 6,640.73* 388.36 6,088.47* −798.09 908.76
Size 0.013 0.116*** 0.015 0.204*** 0.203***
Constant 1,428.67 −0.3662.173* 1,443.442 Omitted Omitted
R-square 0.7781 0.6550 0.6209 — —
MA 1 — — — — 0.3404
MA 2 — — — — 0.3170
Sargan statistics — — — 0.0914 0.1197
Source: Authors’ calculations.
Notes: The table represents the results analysed from OLS regression, fixed and random effects panel data regressi
GMM (one-step and two-step estimators) taking dividend/PAT as the dependent variable. Dependent variable
study are age and ownership (time-invariant factors), whereas risk, cash, leverage, growth opportunities, net
capital, profitability and size are (time-variant) factors. MA 1, MA 2 and Sargan statistics are calcula
omitted variable. Time invariant are omitted due to autocorrelation in fixed effects and GMM estimates exclud
age (one-step and two-step). Model fit represents significance of models. MA 1 and MA 2 are Arellano and Bon
test (1991) for autocorrelation in first differenced errors. Sargan statistics is the test for autocorrelation, Sarg
(1958). *, ** and *** are significant at 90%, 95% and 99% confidence intervals, respectively.
Table 7. Results Manufacturing Sector (Dividend/PAT as dependent variable)
OLS Coefficient
Fixed Effects
Coefficient
Random Effects
Coefficient
GMM One-step
Coefficient
GMM Two-step
Coefficient
Div. lag 1 — — — 0.407*** 0.438***
Age −8.73*** Omitted −8.45* 11.714 −4.163
Ownership group 328.39*** Omitted 295.50 Omitted Omitted
Risk −583.71*** −432.61** −512.80*** −631.811** −25.662
Cash −0.093 0.075 0.114 0.238 0.091
leverage −43.88 −78.34 −108.39* −157.55 −59.343
Growth
opportunities
4.72 −5.97 −3.128 2.314 1.608
Net working capital −0.022*** −0.039*** −0.036*** −0.032*** −0.026***
Profitability 6,460.75*** 1,639.583*** 2,254.7*** 3,060.70*** 1,836.23***
Size 0.019*** 0.016*** 0.0179*** 0.016*** 0.015***
Constant 40.63 551.286*** 424.10 Omitted Omitted
R-square 0.5255 0.2324 0.2295 — —
Paraphrase This Document
Need a fresh take? Get an instant paraphrase of this document with our AI Paraphraser
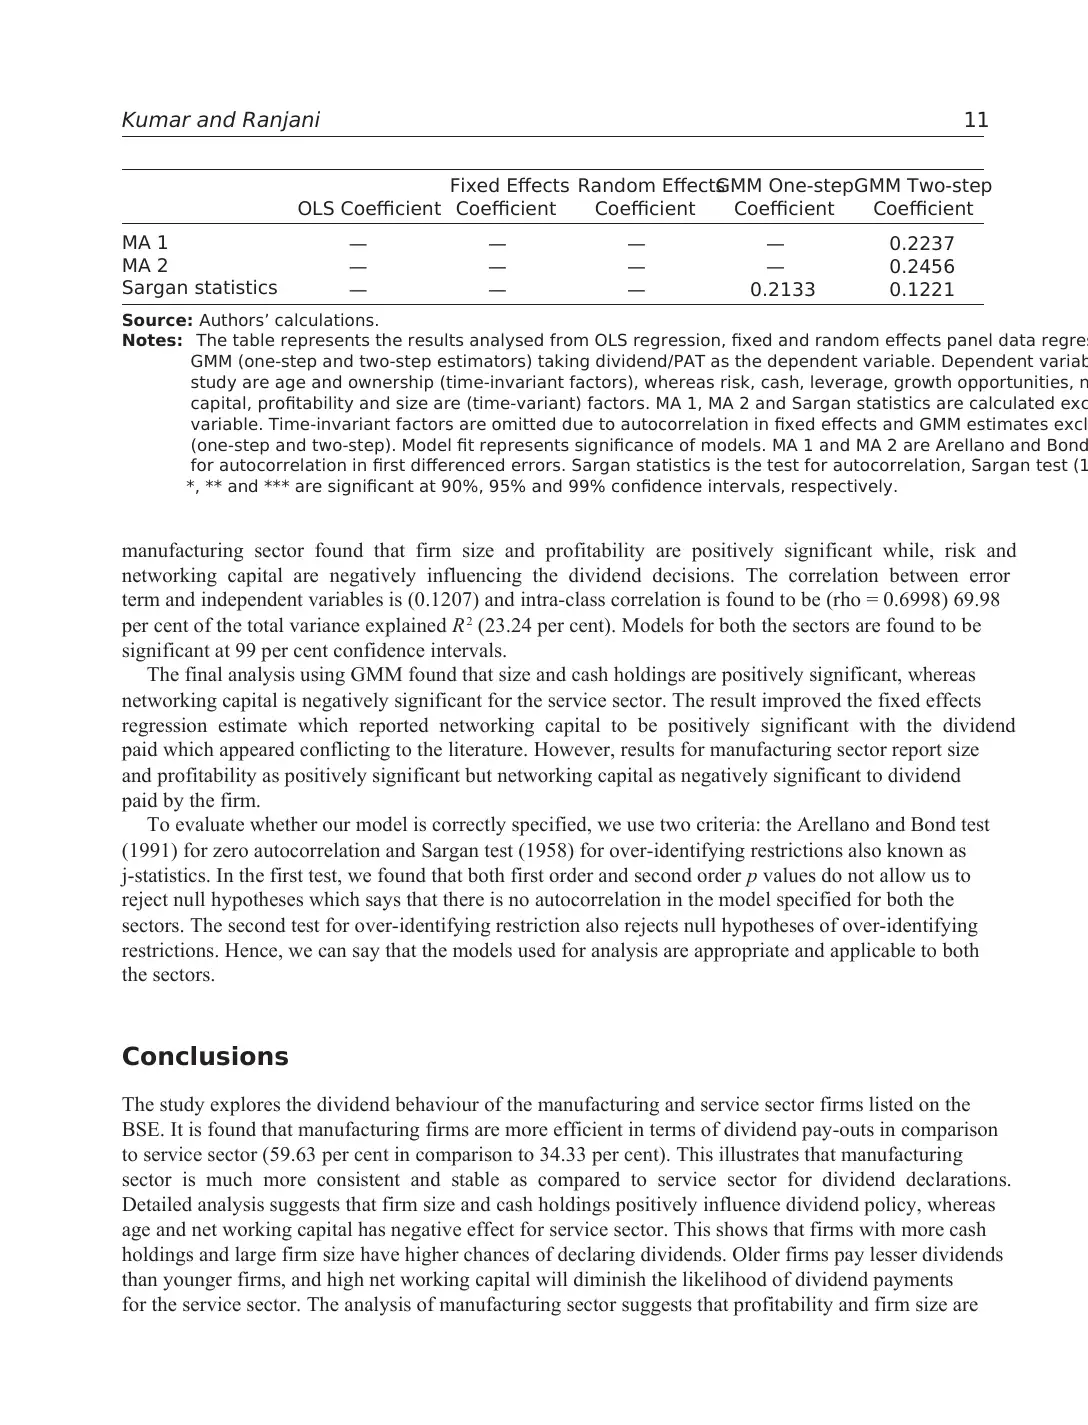
Kumar and Ranjani 11
manufacturing sector found that firm size and profitability are positively significant while, risk and
networking capital are negatively influencing the dividend decisions. The correlation between error
term and independent variables is (0.1207) and intra-class correlation is found to be (rho = 0.6998) 69.98
per cent of the total variance explained R2 (23.24 per cent). Models for both the sectors are found to be
significant at 99 per cent confidence intervals.
The final analysis using GMM found that size and cash holdings are positively significant, whereas
networking capital is negatively significant for the service sector. The result improved the fixed effects
regression estimate which reported networking capital to be positively significant with the dividend
paid which appeared conflicting to the literature. However, results for manufacturing sector report size
and profitability as positively significant but networking capital as negatively significant to dividend
paid by the firm.
To evaluate whether our model is correctly specified, we use two criteria: the Arellano and Bond test
(1991) for zero autocorrelation and Sargan test (1958) for over-identifying restrictions also known as
j-statistics. In the first test, we found that both first order and second order p values do not allow us to
reject null hypotheses which says that there is no autocorrelation in the model specified for both the
sectors. The second test for over-identifying restriction also rejects null hypotheses of over-identifying
restrictions. Hence, we can say that the models used for analysis are appropriate and applicable to both
the sectors.
Conclusions
The study explores the dividend behaviour of the manufacturing and service sector firms listed on the
BSE. It is found that manufacturing firms are more efficient in terms of dividend pay-outs in comparison
to service sector (59.63 per cent in comparison to 34.33 per cent). This illustrates that manufacturing
sector is much more consistent and stable as compared to service sector for dividend declarations.
Detailed analysis suggests that firm size and cash holdings positively influence dividend policy, whereas
age and net working capital has negative effect for service sector. This shows that firms with more cash
holdings and large firm size have higher chances of declaring dividends. Older firms pay lesser dividends
than younger firms, and high net working capital will diminish the likelihood of dividend payments
for the service sector. The analysis of manufacturing sector suggests that profitability and firm size are
OLS Coefficient
Fixed Effects
Coefficient
Random Effects
Coefficient
GMM One-step
Coefficient
GMM Two-step
Coefficient
MA 1 — — — — 0.2237
MA 2 — — — — 0.2456
Sargan statistics — — — 0.2133 0.1221
Source: Authors’ calculations.
Notes: The table represents the results analysed from OLS regression, fixed and random effects panel data regres
GMM (one-step and two-step estimators) taking dividend/PAT as the dependent variable. Dependent variab
study are age and ownership (time-invariant factors), whereas risk, cash, leverage, growth opportunities, n
capital, profitability and size are (time-variant) factors. MA 1, MA 2 and Sargan statistics are calculated exc
variable. Time-invariant factors are omitted due to autocorrelation in fixed effects and GMM estimates excl
(one-step and two-step). Model fit represents significance of models. MA 1 and MA 2 are Arellano and Bond
for autocorrelation in first differenced errors. Sargan statistics is the test for autocorrelation, Sargan test (1
*, ** and *** are significant at 90%, 95% and 99% confidence intervals, respectively.
12 Global Business Review 20(1)
positively significant while networking capital is negatively significant. This implies that profitability is
an important factor for manufacturing sector than service sector and net working capital is found to be
negatively significant for both the sectors. The results illustrate the need for internal funds which reduce
chances of dividend payments irrespective of sector to which a firm belongs. Also, it explains that higher
profitability does not necessarily convert to higher dividend declarations for service sector. Age is a
major factor for service sector but statistically insignificant for manufacturing sector. The result signifies
that older service sector firms are likely to pay dividends, whereas manufacturing sector lacks any such
evidences. Younger firms may choose to hold cash and defer dividend payment because of higher
growth prospects in service sector implying better investment opportunities. Other factors are found
insignificant in either one or all the methods used for analysis. Finally, we do not find any significant
differences regarding fundamentals apart from variance in terms of sensitivities of the variables to
dividend payments. However, manufacturing firms are more inclined to dividend payments in comparison
to service sector which is reported empirically in the study. The counter intuitive results in service sector
can overall be attributed to the expectation of higher returns from business opportunities, especially in
the case of younger firms.
The study offers insights to both the firms and investors to understand the dividend behaviour of
manufacturing and service sector firms. The managers can work on the significantly influencing factors
to keep an equilibrium of the investors’ sentiments on the profit distributions. It will also help to under-
stand the sectoral divergence dividend behaviour of firms. India is a developing economy, and results can
also be used to understand the dividend behaviour of the countries with similar structure of manufacturing
and service sectors, especially South Asian economies. This study is limited in terms of capturing macro-
economic factors that help a particular sector to grow rapidly because of government policies such as
foreign direct investment (FDI) or tax subsidies.
The future research may be conducted by considering both micro and macroeconomic factors together
to understand the effects of macroeconomic factors. Also, multiple industries can be included in the
study to improve the application of the results.
Acknowledgement
The authors are grateful to the anonymous referees of the journal for their extremely useful suggestions to improve
the quality of the article. Usual disclaimers apply.
Notes
1. Share price and cost of capital of the firm is independent of its dividend policy.
2. Investor is only concerned of the returns irrespective of the medium of return (dividend or capital gain).
3. Dividend as the medium to minimize agency costs.
4. Dividend payments vary according to the life cycle stages of the firm
5. Reducing information asymmetry and communicating sound financial health through dividend pay-outs.
6. Combined approach of agency and signalling theory.
References
Agrawal, A., & Jayaraman, N. (1994). The dividend policies of all-equity firms: A direct test of the free cash flow
theory. Managerial and Decision Economics, 15(2), 139–148.
Aharony, J., & Swary, I. (1980). Quarterly dividend and earnings announcements and stockholders’ returns:
An empirical analysis. The Journal of Finance, 35(1), 1–12.
Ajanthan, A. (2013). The relationship between dividend payout and firm profitability: A study of listed hotels and
restaurant companies in Sri Lanka. International Journal of Scientific and Research Publications, 3(5), 1–6.
⊘ This is a preview!⊘
Do you want full access?
Subscribe today to unlock all pages.
Trusted by 1+ million students worldwide
1 out of 15
Your All-in-One AI-Powered Toolkit for Academic Success.
+13062052269
info@desklib.com
Available 24*7 on WhatsApp / Email
![[object Object]](/_next/static/media/star-bottom.7253800d.svg)
Unlock your academic potential
Copyright © 2020–2026 A2Z Services. All Rights Reserved. Developed and managed by ZUCOL.