Applying Mixed Methods to QSR Customer Satisfaction at the Unit Level
VerifiedAdded on 2022/09/18
|10
|11383
|323
Report
AI Summary
This report explores the drivers of customer satisfaction in Quick Service Restaurants (QSRs) at the unit level, addressing the limitations of the Importance-Performance Analysis (IPA) method. The study synthesizes qualitative methods, Penalty-Reward Contrast Analysis (PRCA), and importance grid methods to identify key attributes influencing customer satisfaction. Findings reveal basic factors like taste, temperature, and accuracy, performance factors such as friendliness, and excitement factors including cleanliness, speed, and ease of understanding. The study emphasizes prioritizing taste, temperature, and accuracy, followed by friendliness, and then allocating resources to cleanliness, speed, and ease of understanding. The research contributes a novel approach to optimize resource allocation and provides practical insights for hospitality practitioners aiming to enhance customer satisfaction in the competitive QSR environment. The generalizability is limited to the single QSR chain examined and the limited number of attributes considered.
See discussions, stats, and author profiles for this publication at: https://www.researchgate.net/publication/282562967
Applying mixed methods to identify what drives quick service restaurant's
customer satisfaction at the unit-level
Article in International Journal of Hospitality Management · September 2015
DOI: 10.1016/j.ijhm.2015.07.007
CITATIONS
16
READS
749
3 authors, including:
Kimberly Mathe
Oklahoma State University - Stillwater
19PUBLICATIONS210CITATIONS
SEE PROFILE
Lisa Slevitch
Oklahoma State University - Stillwater
24PUBLICATIONS245CITATIONS
SEE PROFILE
Paraphrase This Document
Need a fresh take? Get an instant paraphrase of this document with our AI Paraphraser
International Journal of Hospitality Management 50 (2015) 46–54
Contents lists available at ScienceDirect
International Journal of Hospitality Management
j o u r n a lh o m e p a g e :w w w . e l s e v i e r . c o m / l o c a t e / i j h o s m a n
Applying mixed methods to identify what drives quick service
restaurant’s customer satisfaction at the unit-level
Kimberly Mathe-Souleka, Lisa Slevitchb,∗, Ioana Dallingerc
a Texas Tech University, College of Human Sciences, Department of Retailing, Hospitality and Institutional Management, United States
b School of Hotel and Restaurant Administration, Oklahoma State University, 210 HESW, Stillwater, OK 74078-6173, United States
c Department of Hospitality and Tourism Management, Virginia Tech University, 352 Wallace Hall, Virginia Tech, 295 West Campus Drive, Blacksburg,
VA 24061, United States
a r t i c l e i n f o
Article history:
Received 21 August 2014
Received in revised form 14 July 2015
Accepted 16 July 2015
Keywords:
Customer satisfaction
Kano’s model
Quick service restaurants
Performance optimization
Service quality
Product quality
a b s t r a c t
The current study addresses issues related to developing a set of criticalquality attributes. The pri-
mary research objective was to address drawbacks of importance–performance method and develop
a novel approach that identifies satisfaction drivers for unit-level quick service restaurant (QSR).The
new approach is based on synthesis of qualitative,PRCA, and importance grid methods.Basic (taste,
temperature, and accuracy), performance (friendliness) and excitement (cleanliness, speed, and ease of
understanding) factors were identified for a QSR context. The current findings help to resolve the problem
of performance optimization and identify an optimal set of QSR attributes to allocate resources.Taste,
temperature, and accuracy must be ensured as top priority. Then, friendliness should also be ensured and
only after that the resources should be allocated to cleanliness, speed, and ease of understanding. Gen-
eralizability of the findings is bounded by the fact that only one QSR chain was examined. Additionally,
only a limited number of QSR attributes was examined.
© 2015 Elsevier Ltd. All rights reserved.
1. Introduction
The foodservice industry is highly competitive, with 29% of all
restaurant sales coming from the quick service restaurant (QSR)
segment (QSR Magazine, 2012a). In such an environment, cus-
tomer satisfaction is considered to be a critical indicator for the
businesses’future; as high levels of customer satisfaction tend
to lead to loyalty, which in return leads to profits (Chen, 2012;
Matzler and Hinterhuber, 1998). Additionally, customer satisfac-
tion reduces price sensitivity, increases cross-buying, and increases
positive word-of-mouth (Matzler et al., 2004).
The widely accepted satisfaction-profit chain framework sug-
gests that profits stem from customer retention that arises from
high levels of customer satisfaction, which is achieved by delivering
quality product or service (Anderson and Mittal, 2000). The con-
ceptual logic underlying the satisfaction-profit chain stems from
the idea that by improving product or service attributes or quality,
customer satisfaction should increase. When customer satisfaction
increases based on attributes of the restaurant experience, this in
∗ Corresponding author. Tel.: +1 405 744 7643; fax: +1 405 744 6299.
E-mail addresses: kim.mathe@okstate.edu (K. Mathe-Soulek),
lisa.slevitch@okstate.edu (L. Slevitch), kioana@vt.edu (I. Dallinger).
turn will lead to greater profitability, revisit intentions, customer
traffic, and sales (Gupta et al., 2007).
It should be noted that there has been little agreement on the
primary drivers of restaurant satisfaction,in large part because
each segment of the restaurant industry can have different expec-
tations of the product and service. What is commonly agreed
on, is that knowing and delivering the optimal set of product or
service attributes that produce the highest level of customer sat-
isfaction is crucial to the competitive edge of businesses (Mikuli´c
and Prebeˇzac, 2011). With this idea in mind, numerous attempts
have been made to identify critical service or product attributes
that generate customer satisfaction in order to stay abreast of
competitors (Deng et al., 2008). Customer satisfaction determi-
nants at an attribute level are generally operationalized through
the Importance–Performance Analysis (IPA). In this prominent
approach, a list of attributes is generated first, and then, customers
are asked to rate a product or service on the degree of how each
of the attributes is delivered. Also, consumers are asked to rate the
importance of each attribute. Finally, an overall score is computed
as a sum of individual attribute scores weighed by the level of their
importance (Martilla and James, 1977).
In spite of its dominance,the IPA method has numerous flaws
and can be misleading in attempts to identify an optimal set of prod-
uct or service features (Deng, 2007; Matzler et al., 2003; Oh, 2001).
http://dx.doi.org/10.1016/j.ijhm.2015.07.007
0278-4319/© 2015 Elsevier Ltd. All rights reserved.
K. Mathe-Soulek et al. / International Journal of Hospitality Management 50 (2015) 46–54 47
IPA does not provide clear definition for the concept of importance
and does not take into account whether the attribute is important
for its presence or its absence (Deng et al., 2008). Additionally, IPA’s
underlying assumption is that importance and performance are
two independent entities, however, numerous studies have con-
firmed that the relationship between attribute performance and
attribute importance was causal and attribute importance changed
as attribute performance did (Matzler et al., 2003; Oh, 2001; Oliver,
1997). Another one of the major IPA’s assumptions is that the cus-
tomer satisfaction function is linear and additive in nature, though
it was proven otherwise (Bartikowski and Llosa, 2003; Hui et al.,
2005; Matzler et al., 2004; Slevitch and Oh, 2010). Therefore, the IPA
approach is innately geared toward performance maximization, not
optimization, consequently, leaving the problem of optimal deploy-
ment of resources unaddressed (Chen,2012; Mittal et al., 1998).
More importantly, both academics and practitioners report that
equally investing in greater performance along all service attributes
in order to increase satisfaction would not be effective and does not
justify additional investments (Busacca and Padula, 2005; Cadotte
and Turgeon, 1988; Lin et al., 2010; Mittal et al., 1998).
As Oh (2001) states, hospitality academics and practitioners
continue to use IPA without giving critical considerations to its
conceptual and practical validities. Oh (2001) further suggests that
though easy applicability is always desirable, simplicity and conve-
nience should not be the predominant criteria when choosing and
applying a research method.Oh (2001) concludes that thorough
reassessment of IPA as a tool is necessary.
Therefore, the current study attempts to address the issues
raised by previous researchers with regard to IPA (Deng, 2007; Oh,
2001) and tackle the problem of a better method to identify sat-
isfaction determinants.Several alternatives,such as Kano et al.’s
model, PRCA, and qualitative approach, address many of the IPA’s
drawbacks (Chen, 2012). The main objective of this study is to syn-
thesize several existing methods that overcome shortcomings of
IPA as summarized by Oh (2001) and Mikuli´c and Prebeˇzac (2011),
and to test them in the context of QSR – an area where intense
competition makes knowing satisfaction determinants a matter
of survival. More specifically, through mixed methods,this study
will examine unit-level QSR attributes rated by independent sets
of consumers. The significance of the current study is grounded
in utilizing a mixed methods design, which addresses some of the
limitations of the IPA method by providing a novel and useful tool
to assess attributes and their relationships to customer satisfaction.
The latter would have a significant practical significance, as the new
method would allow hospitality practitioners to truly define what
drives customer satisfaction and optimize their resource allocation.
A visual depiction of this research framework of mixed methods can
be seen in Fig. 1.
2. Literature review
Multiple attempts have been made to develop a better method of
identifying a critical set of quality attributes (Mikuli´c and Prebeˇzac,
2011). Some studies have modified IPA with the basic frame-
work remaining largely the same, however several researchers
presented a framework that rectifies the flaws of the original
IPA model (Matzler et al., 2003). Methods that address issues of
performance–importance dependence and the asymmetric nature
of the customer satisfaction function stem from Kano’s Theory of
Attractive Quality,which is often referred as Kano’s model (Kano
et al., 1984). In turn, Kano’s theory is grounded into Herzberg’s work
on job satisfaction where Herzberg introduced two categories of
factors, hygiene and motivators, based on their dissimilar effect on
satisfaction (Herzberg, 1967).
The original Kano’s model distinguishes between five dif-
ferent quality attribute types: attractive,one-dimensional,basic
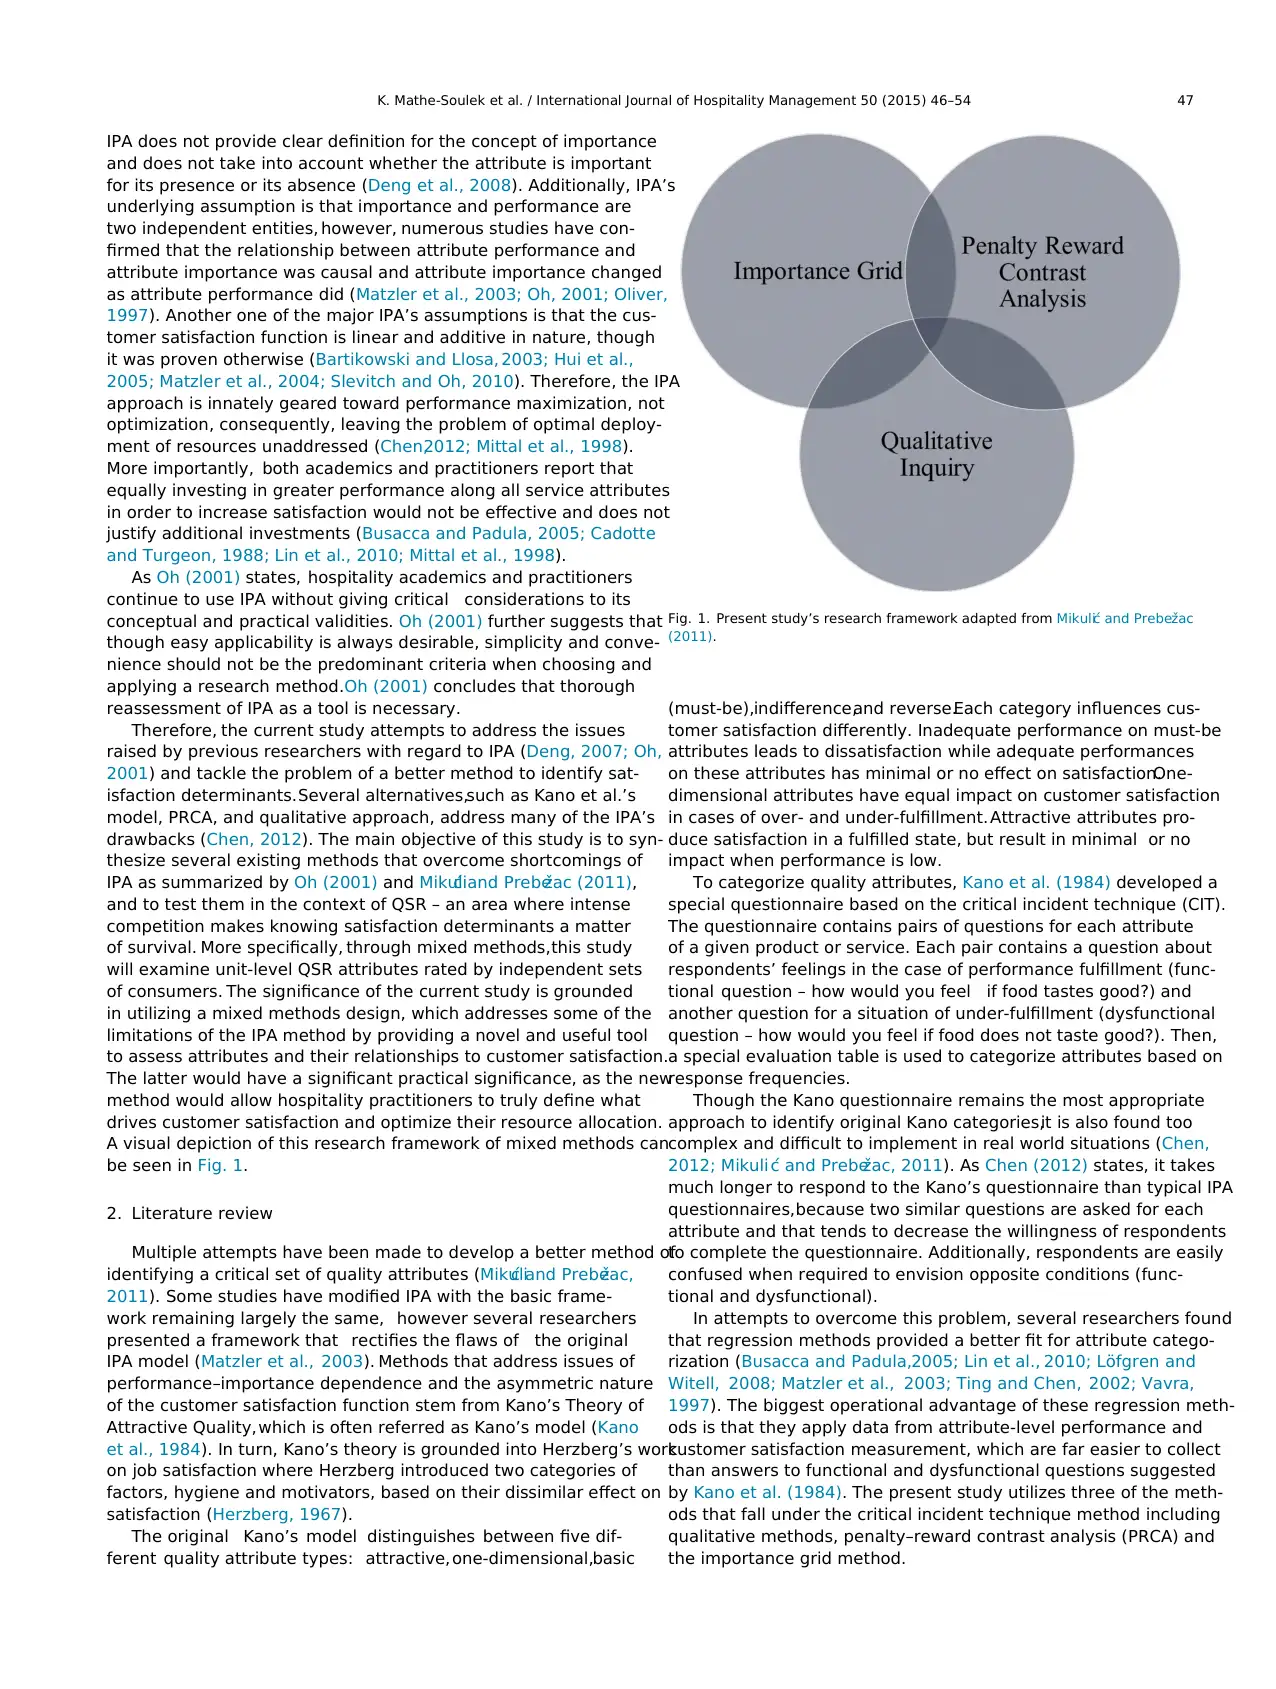
Fig. 1. Present study’s research framework adapted from Mikuli´c and Prebeˇzac
(2011).
(must-be),indifference,and reverse.Each category influences cus-
tomer satisfaction differently. Inadequate performance on must-be
attributes leads to dissatisfaction while adequate performances
on these attributes has minimal or no effect on satisfaction.One-
dimensional attributes have equal impact on customer satisfaction
in cases of over- and under-fulfillment. Attractive attributes pro-
duce satisfaction in a fulfilled state, but result in minimal or no
impact when performance is low.
To categorize quality attributes, Kano et al. (1984) developed a
special questionnaire based on the critical incident technique (CIT).
The questionnaire contains pairs of questions for each attribute
of a given product or service. Each pair contains a question about
respondents’ feelings in the case of performance fulfillment (func-
tional question – how would you feel if food tastes good?) and
another question for a situation of under-fulfillment (dysfunctional
question – how would you feel if food does not taste good?). Then,
a special evaluation table is used to categorize attributes based on
response frequencies.
Though the Kano questionnaire remains the most appropriate
approach to identify original Kano categories,it is also found too
complex and difficult to implement in real world situations (Chen,
2012; Mikuli ´c and Prebeˇzac, 2011). As Chen (2012) states, it takes
much longer to respond to the Kano’s questionnaire than typical IPA
questionnaires,because two similar questions are asked for each
attribute and that tends to decrease the willingness of respondents
to complete the questionnaire. Additionally, respondents are easily
confused when required to envision opposite conditions (func-
tional and dysfunctional).
In attempts to overcome this problem, several researchers found
that regression methods provided a better fit for attribute catego-
rization (Busacca and Padula,2005; Lin et al., 2010; Löfgren and
Witell, 2008; Matzler et al., 2003; Ting and Chen, 2002; Vavra,
1997). The biggest operational advantage of these regression meth-
ods is that they apply data from attribute-level performance and
customer satisfaction measurement, which are far easier to collect
than answers to functional and dysfunctional questions suggested
by Kano et al. (1984). The present study utilizes three of the meth-
ods that fall under the critical incident technique method including
qualitative methods, penalty–reward contrast analysis (PRCA) and
the importance grid method.
IPA does not provide clear definition for the concept of importance
and does not take into account whether the attribute is important
for its presence or its absence (Deng et al., 2008). Additionally, IPA’s
underlying assumption is that importance and performance are
two independent entities, however, numerous studies have con-
firmed that the relationship between attribute performance and
attribute importance was causal and attribute importance changed
as attribute performance did (Matzler et al., 2003; Oh, 2001; Oliver,
1997). Another one of the major IPA’s assumptions is that the cus-
tomer satisfaction function is linear and additive in nature, though
it was proven otherwise (Bartikowski and Llosa, 2003; Hui et al.,
2005; Matzler et al., 2004; Slevitch and Oh, 2010). Therefore, the IPA
approach is innately geared toward performance maximization, not
optimization, consequently, leaving the problem of optimal deploy-
ment of resources unaddressed (Chen,2012; Mittal et al., 1998).
More importantly, both academics and practitioners report that
equally investing in greater performance along all service attributes
in order to increase satisfaction would not be effective and does not
justify additional investments (Busacca and Padula, 2005; Cadotte
and Turgeon, 1988; Lin et al., 2010; Mittal et al., 1998).
As Oh (2001) states, hospitality academics and practitioners
continue to use IPA without giving critical considerations to its
conceptual and practical validities. Oh (2001) further suggests that
though easy applicability is always desirable, simplicity and conve-
nience should not be the predominant criteria when choosing and
applying a research method.Oh (2001) concludes that thorough
reassessment of IPA as a tool is necessary.
Therefore, the current study attempts to address the issues
raised by previous researchers with regard to IPA (Deng, 2007; Oh,
2001) and tackle the problem of a better method to identify sat-
isfaction determinants.Several alternatives,such as Kano et al.’s
model, PRCA, and qualitative approach, address many of the IPA’s
drawbacks (Chen, 2012). The main objective of this study is to syn-
thesize several existing methods that overcome shortcomings of
IPA as summarized by Oh (2001) and Mikuli´c and Prebeˇzac (2011),
and to test them in the context of QSR – an area where intense
competition makes knowing satisfaction determinants a matter
of survival. More specifically, through mixed methods,this study
will examine unit-level QSR attributes rated by independent sets
of consumers. The significance of the current study is grounded
in utilizing a mixed methods design, which addresses some of the
limitations of the IPA method by providing a novel and useful tool
to assess attributes and their relationships to customer satisfaction.
The latter would have a significant practical significance, as the new
method would allow hospitality practitioners to truly define what
drives customer satisfaction and optimize their resource allocation.
A visual depiction of this research framework of mixed methods can
be seen in Fig. 1.
2. Literature review
Multiple attempts have been made to develop a better method of
identifying a critical set of quality attributes (Mikuli´c and Prebeˇzac,
2011). Some studies have modified IPA with the basic frame-
work remaining largely the same, however several researchers
presented a framework that rectifies the flaws of the original
IPA model (Matzler et al., 2003). Methods that address issues of
performance–importance dependence and the asymmetric nature
of the customer satisfaction function stem from Kano’s Theory of
Attractive Quality,which is often referred as Kano’s model (Kano
et al., 1984). In turn, Kano’s theory is grounded into Herzberg’s work
on job satisfaction where Herzberg introduced two categories of
factors, hygiene and motivators, based on their dissimilar effect on
satisfaction (Herzberg, 1967).
The original Kano’s model distinguishes between five dif-
ferent quality attribute types: attractive,one-dimensional,basic
Fig. 1. Present study’s research framework adapted from Mikuli´c and Prebeˇzac
(2011).
(must-be),indifference,and reverse.Each category influences cus-
tomer satisfaction differently. Inadequate performance on must-be
attributes leads to dissatisfaction while adequate performances
on these attributes has minimal or no effect on satisfaction.One-
dimensional attributes have equal impact on customer satisfaction
in cases of over- and under-fulfillment. Attractive attributes pro-
duce satisfaction in a fulfilled state, but result in minimal or no
impact when performance is low.
To categorize quality attributes, Kano et al. (1984) developed a
special questionnaire based on the critical incident technique (CIT).
The questionnaire contains pairs of questions for each attribute
of a given product or service. Each pair contains a question about
respondents’ feelings in the case of performance fulfillment (func-
tional question – how would you feel if food tastes good?) and
another question for a situation of under-fulfillment (dysfunctional
question – how would you feel if food does not taste good?). Then,
a special evaluation table is used to categorize attributes based on
response frequencies.
Though the Kano questionnaire remains the most appropriate
approach to identify original Kano categories,it is also found too
complex and difficult to implement in real world situations (Chen,
2012; Mikuli ´c and Prebeˇzac, 2011). As Chen (2012) states, it takes
much longer to respond to the Kano’s questionnaire than typical IPA
questionnaires,because two similar questions are asked for each
attribute and that tends to decrease the willingness of respondents
to complete the questionnaire. Additionally, respondents are easily
confused when required to envision opposite conditions (func-
tional and dysfunctional).
In attempts to overcome this problem, several researchers found
that regression methods provided a better fit for attribute catego-
rization (Busacca and Padula,2005; Lin et al., 2010; Löfgren and
Witell, 2008; Matzler et al., 2003; Ting and Chen, 2002; Vavra,
1997). The biggest operational advantage of these regression meth-
ods is that they apply data from attribute-level performance and
customer satisfaction measurement, which are far easier to collect
than answers to functional and dysfunctional questions suggested
by Kano et al. (1984). The present study utilizes three of the meth-
ods that fall under the critical incident technique method including
qualitative methods, penalty–reward contrast analysis (PRCA) and
the importance grid method.
⊘ This is a preview!⊘
Do you want full access?
Subscribe today to unlock all pages.
Trusted by 1+ million students worldwide
48 K. Mathe-Soulek et al. / International Journal of Hospitality Management 50 (2015) 46–54
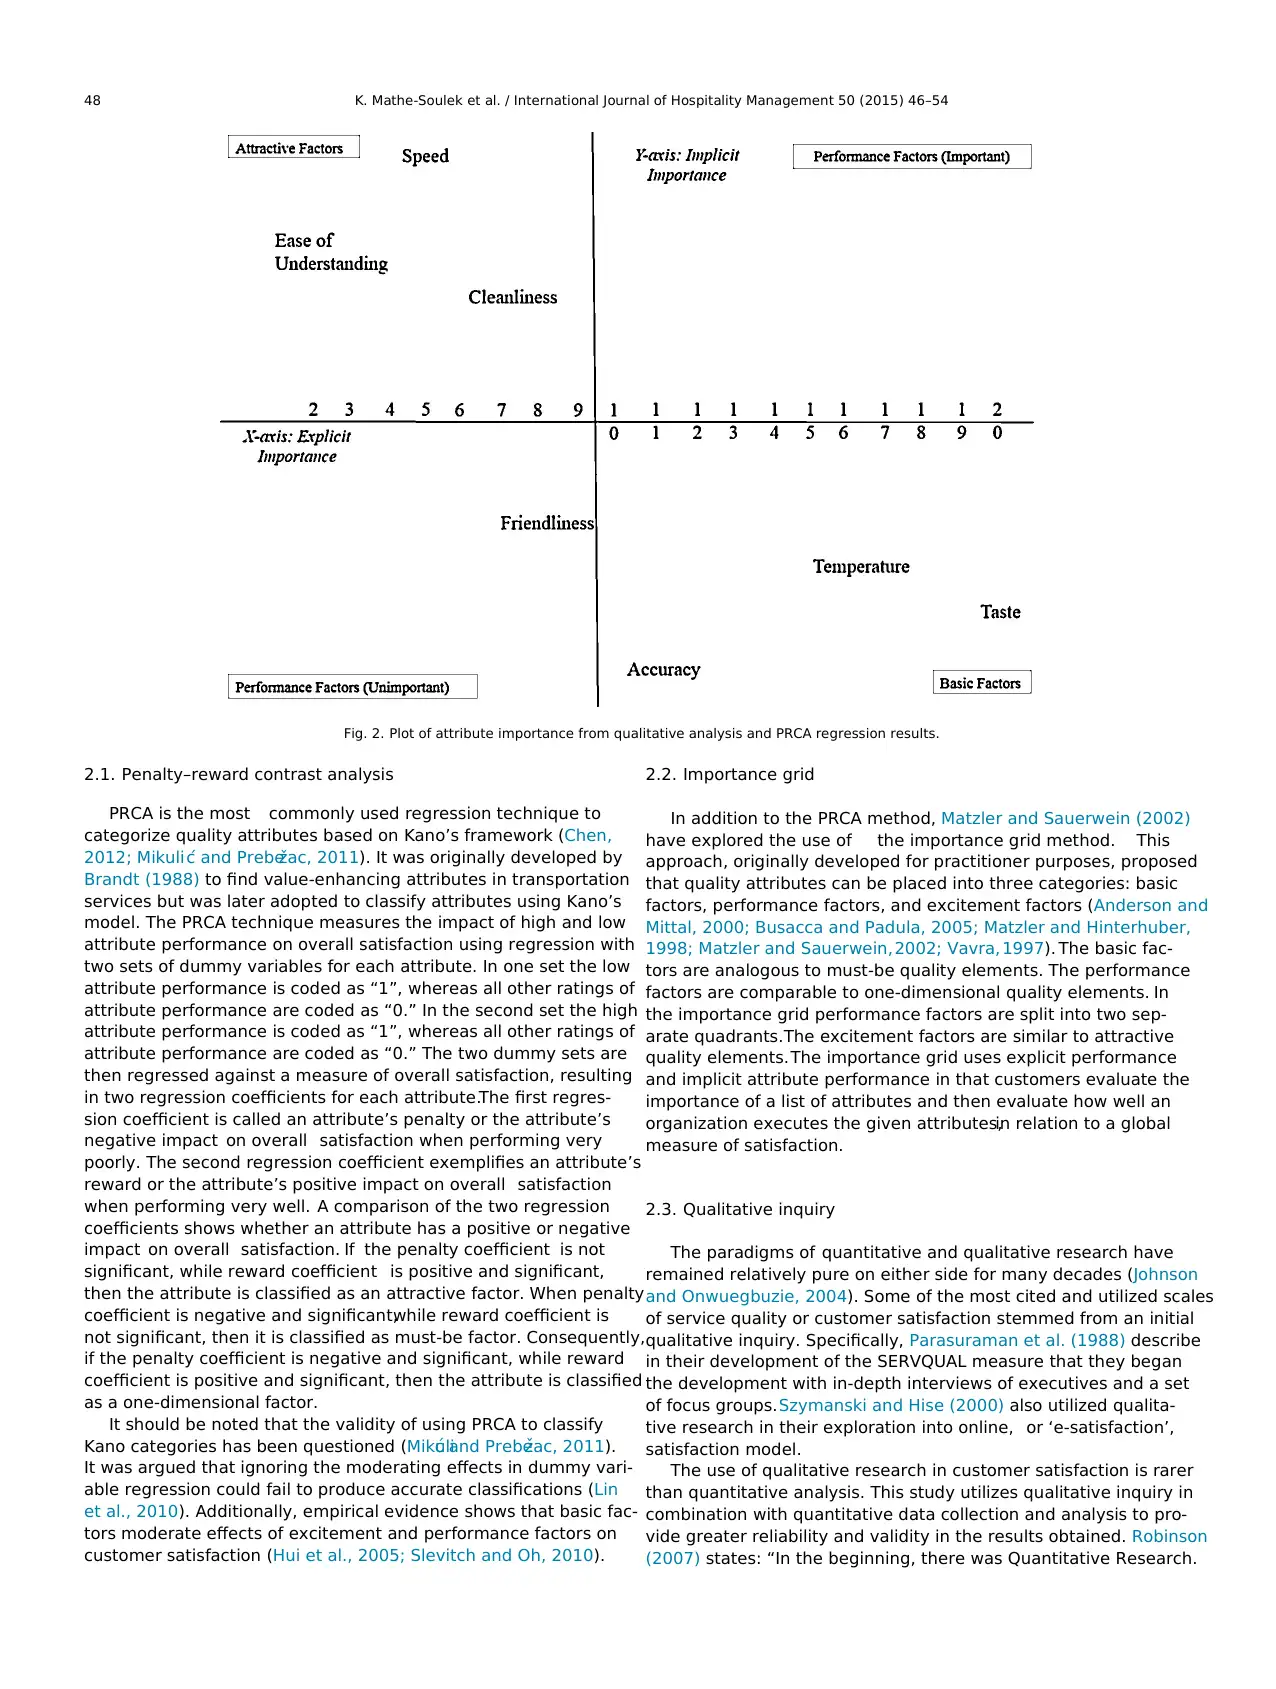
Fig. 2. Plot of attribute importance from qualitative analysis and PRCA regression results.
2.1. Penalty–reward contrast analysis
PRCA is the most commonly used regression technique to
categorize quality attributes based on Kano’s framework (Chen,
2012; Mikuli ´c and Prebeˇzac, 2011). It was originally developed by
Brandt (1988) to find value-enhancing attributes in transportation
services but was later adopted to classify attributes using Kano’s
model. The PRCA technique measures the impact of high and low
attribute performance on overall satisfaction using regression with
two sets of dummy variables for each attribute. In one set the low
attribute performance is coded as “1”, whereas all other ratings of
attribute performance are coded as “0.” In the second set the high
attribute performance is coded as “1”, whereas all other ratings of
attribute performance are coded as “0.” The two dummy sets are
then regressed against a measure of overall satisfaction, resulting
in two regression coefficients for each attribute.The first regres-
sion coefficient is called an attribute’s penalty or the attribute’s
negative impact on overall satisfaction when performing very
poorly. The second regression coefficient exemplifies an attribute’s
reward or the attribute’s positive impact on overall satisfaction
when performing very well. A comparison of the two regression
coefficients shows whether an attribute has a positive or negative
impact on overall satisfaction. If the penalty coefficient is not
significant, while reward coefficient is positive and significant,
then the attribute is classified as an attractive factor. When penalty
coefficient is negative and significant,while reward coefficient is
not significant, then it is classified as must-be factor. Consequently,
if the penalty coefficient is negative and significant, while reward
coefficient is positive and significant, then the attribute is classified
as a one-dimensional factor.
It should be noted that the validity of using PRCA to classify
Kano categories has been questioned (Mikuli´c and Prebeˇzac, 2011).
It was argued that ignoring the moderating effects in dummy vari-
able regression could fail to produce accurate classifications (Lin
et al., 2010). Additionally, empirical evidence shows that basic fac-
tors moderate effects of excitement and performance factors on
customer satisfaction (Hui et al., 2005; Slevitch and Oh, 2010).
2.2. Importance grid
In addition to the PRCA method, Matzler and Sauerwein (2002)
have explored the use of the importance grid method. This
approach, originally developed for practitioner purposes, proposed
that quality attributes can be placed into three categories: basic
factors, performance factors, and excitement factors (Anderson and
Mittal, 2000; Busacca and Padula, 2005; Matzler and Hinterhuber,
1998; Matzler and Sauerwein,2002; Vavra, 1997). The basic fac-
tors are analogous to must-be quality elements. The performance
factors are comparable to one-dimensional quality elements. In
the importance grid performance factors are split into two sep-
arate quadrants.The excitement factors are similar to attractive
quality elements.The importance grid uses explicit performance
and implicit attribute performance in that customers evaluate the
importance of a list of attributes and then evaluate how well an
organization executes the given attributes,in relation to a global
measure of satisfaction.
2.3. Qualitative inquiry
The paradigms of quantitative and qualitative research have
remained relatively pure on either side for many decades (Johnson
and Onwuegbuzie, 2004). Some of the most cited and utilized scales
of service quality or customer satisfaction stemmed from an initial
qualitative inquiry. Specifically, Parasuraman et al. (1988) describe
in their development of the SERVQUAL measure that they began
the development with in-depth interviews of executives and a set
of focus groups.Szymanski and Hise (2000) also utilized qualita-
tive research in their exploration into online, or ‘e-satisfaction’,
satisfaction model.
The use of qualitative research in customer satisfaction is rarer
than quantitative analysis. This study utilizes qualitative inquiry in
combination with quantitative data collection and analysis to pro-
vide greater reliability and validity in the results obtained. Robinson
(2007) states: “In the beginning, there was Quantitative Research.
Paraphrase This Document
Need a fresh take? Get an instant paraphrase of this document with our AI Paraphraser
K. Mathe-Soulek et al. / International Journal of Hospitality Management 50 (2015) 46–54 49
A few years later, there was Qualitative Research. And then, Mixed
Methods was born as a separate child of these parents” (p. 388). As
Creswell and Clark (2007) describe, there are generally four types
of designs in mixed methods: embedded, exploratory, triangulated,
and explanatory. The crux of this study focuses on the triangulated
approach,which utilizes different research approaches,methods,
and techniques in the same study (Hussey and Hussey, 1997;
Mangan et al., 2004).
The present study seeks to not only explore the PRCA method
in relation to QSR performance,but also proposes a new method
of performance planning that combines aspects of a qualitative
approach, the importance grid, and the regression results of the
PRCA, three of the primary methods Mikuli´c and Prebeˇzac (2011)
suggest using for IPA classification. Consequently, the satisfaction
with the penalty and reward attributes in relation to the quad-
rants of the importance grid is assumed to better define customer
satisfaction. Since the method combines a qualitative approach
and quantitative approach, the results redefine the axes on which
attributes are plotted.
Applying Kano’s categorization in the QSR industry is impor-
tant because in addition to the fact that the categorization varies
between industries and market segments (Harrington et al., 2013;
Matzler et al., 2004), it also has a strong temporal dimension
(Mikuli ´c and Prebeˇzac, 2011). Customers’ perceptions of attributes
change over time forcing attributes to migrate from one category to
another. For example, current excitement factors can become basic
factors as a result of becoming industry norms. As Kano (2001)
and Oliver (1997) suggest, such shift happens due to competi-
tion as all competing products or services duplicate each other’s
features, thus creating new “musts” perceived by consumers. How-
ever, knowing to which category attributes belong in a particular
industry is important for resource optimization purposes and also
to build competitive advantage (Kano, 2001). It is particularly true
for the highly competitive QSR segment.
2.4. Other studies focusing on QSR and restaurant attributes
One of the most renowned instruments that measures service
quality, a dimension that predicts satisfaction in restaurants, is
the DINESERV instrument (Stevens et al., 1995), which has strong
theoretical underpinnings from the aforementioned SERVQUAL
instrument (Parasuraman et al., 1988). While these instruments
strongly focus on service related dimensions such as reliability,
assurance,responsiveness,and more (Stevens et al., 1995), the
QSR industry is unique in nature because the interaction with the
employee is often less than one minute (Mathe, 2011) making the
total customer experience from service,product, and operational
quality of upmost importance. Past studies have focused on what
drives QSR satisfaction and loyalty,but not all studies attempted
to capture drivers of customer satisfaction immediately after the
customer experience,but instead used a sample that was sepa-
rate from those who recently encountered a QSR dining experience
(Harrington et al., 2013; Reich et al., 2005).
In the QSR industry, one of the most common methods of deter-
mining guests’ level of satisfaction is through mystery shops, or
other inspection type system implemented by restaurant chains
(DiPietro et al., 2011). In the inspection type method of evalua-
tion that DiPietro et al. (2011) tested, the relationship between the
scores on quality, cleanliness, and service failed to achieve a signif-
icant relationship with performance in QSR restaurants.Because
the information obtained from inspection scores was from only
one source, the authors suggest that not all of restaurants perfor-
mance should be placed on inspection scores only. Therefore, using
another method of performance analysis,like that in the present
study, could help to verify or provide new insights into where a QSR
unit is succeeding, or failing. One of the newer trends in restaurants
and other retail locations is to print a 1–800 number or provide cus-
tomers with a web address to share experience feedback from their
encounter. A representative from Jack in the Box, a QSR company,
reports receiving survey feedback approximately every 25 s from
consumers based on their experience, and within an hour to hour
and a half managers from every level within a restaurant company
can see if a unit is experiencing a problem (KSDK, 2013). Based on
the prior review and discussion, the study addresses the question:
What attributes are relevant to QSR guest satisfaction, and how are
each of these attributes affecting guest satisfaction?
3. Methods
3.1. Qualitative phase
Previous Kano’s categorization instruments included items that
dealt with a fine dining or casual dining experience in which con-
sumers eat in a dining room. Because this study focuses on QSRs at
the unit level, the researcher(s) generated a list of attributes that
would be conducive to the drive-thru experience at a QSR through
qualitative research. At QSRs, drive-thru business accounts for
more than 50–70% of revenues (QSR Magazine, 2012b), and satis-
faction attributes have yet to be explored. Therefore, in the summer
of 2011, an online panel through Yahoo! was created to explore
customer perceptions of fast food restaurants through qualitative
data techniques suggested by Mikuli´c and Prebeˇzac (2011). The
group consisted of 50 members,who were fast food users across
the United States. The group was first asked “What is your favorite
fast food restaurant and why?” to initiate a group discussion.For
each participant,they were required to answer the question and
reply to another participant.For their responses,the participants
were sent a $5 gift card of their selection. The second and third
questions focused on the crux of the research for this study in which
participants were asked “What factors are important to you when
visiting a fast food restaurant” and also “Recall your last unsatis-
factory restaurant experience; what went wrong?” Both questions
were asked to help with the IPA flaw focusing on the causality
of importance leading to performance,or performance leading to
importance. Of the 50 participants, 42 responded and received a $10
gift card to their choice of QSR.The responses from this question
were then entered into Nvivo9 qualitative data software and were
analyzed for themes. The 42 participants then received a survey and
were asked to rate the importance of the themes that were gener-
ated from their responses. A sample item included “How important
is the taste of food when visiting a QSR”, or “How important is
speed of service when visiting a QSR.” Based on work by Matzler
and Sauerwein (2002) consumers were then asked to allocate 100
points to each of the ten attributes. In order of most points earned
to least points earned the attributes were ranked in the following
order (average points in parentheses):
• Tastes good/tastes fresh (20)
• Low cost (19)
• Hot food (16)
• Convenient location (12)
• Accuracy (11)
• Friendly service (8)
• Clean (7)
• Speed service (5)
• Wide range of items to choose (3)
• Understanding through the speaker (2)
These attributes were then assessed in terms of operational
applicability and included the quantitative survey. For example, at
the store level for a national QSR chain, the individual unit would
50 K. Mathe-Soulek et al. / International Journal of Hospitality Management 50 (2015) 46–54
Table 1
Correlations of QSR attributes.
1 2 3 4 5 6 7 8
1 Taste –
2 Temperature 0.76 –
3 Friendliness 0.65 0.68 –
4 Order accuracy 0.67 0.71 0.70 –
5 Speed 0.67 0.69 0.75 0.71 –
6 Ease of understanding 0.66 0.68 0.71 0.71 0.71 –
7 Cleanliness 0.62 0.65 0.70 0.63 0.71 0.68 –
8 Satisfaction 0.70 0.72 0.75 0.72 0.77 0.70 0.68 –
Note: all correlations significant at p < .01.
not be able to control what is put on the menu and, therefore,
wide range of items was eliminated as this decision typically comes
from a corporate office or centralized decision-making system like
a franchise group. Additionally, convenient location was also elim-
inated because where the store was built was not in control of the
operations that occur at the store. Conversely,an included item
would be cleanliness, as it is an operational level variable in that the
employees at the store level are responsible for keeping a positive
appearance.
3.2. Quantitative phase
3.2.1. Measure and analysis
After the qualitative research phase used to understand the
attributes important to QSRs and their order of importance, a quan-
titative survey was created based on the factors derived in the
qualitative step. A national QSR chain was seeking to develop a
post experience satisfaction survey and agreed to participate in
the study. After visiting the QSR drive-thru, consumers were ran-
domly selected to receive a URL that directed the guest to complete
an online survey. The survey was taped to the bag or on the cup
received by the guest at the drive thru window. Each restaurant unit
had at least 25 consumer responses in a 30-day period, or they were
not included in the analysis per the participating organization’s
reporting structure. In return for participation, the participants
were given a code for a select free menu item at their next visit.
Consumers were first asked the following question: “Consid-
ering your experience today, how would you rate your overall
satisfaction with your visit?” The response options were a Likert
type scale: 1 – highly dissatisfied, 2 – dissatisfied, 3 – neither sat-
isfied nor dissatisfied, 4 – satisfied, and 5 – highly satisfied. Then,
consumers were given the list of attributes to rate on the same
Likert type scale. From the qualitative results, the attributes were
altered to neutral wording. For example, consumers stated that ‘hot
food’ was important to them. The survey changed ‘hot food’ to ‘food
temperature’ to be more neutral. A complete list of the qualitative
items and their neutralized worded items can be seen inTable 1.
An example of an attribute item from the survey would be “Consid-
ering your experience today, how would you rate the temperature
of the food/beverage you received?” or “Considering your experi-
ence today, how would you rate the cleanliness of the restaurant?”
The consumer responses were then averaged by the store and a
total of 2928 units were available for analysis for the month of
data collection.Response rate of the number of consumers could
not be calculated as the number of printed receipts with the URL is
based on the traffic of the each store. High traffic stores would print
fewer receipts than lower traffic stores.The randomized printing
was controlled by the point of sale system utilized by the participat-
ing organization. Also, no demographic information was available
regarding the individual consumers because the participating orga-
nization was the owner of the proprietary database and it was
not unavailable. Based on the total number of responses received,
gender was 58% female and 40% male while 2% did not respond.
The seven attributes’ reliability and validity were analyzed using
a variety of tests. First, to see if they were measuring one fac-
tor, an exploratory factor analysis was conducted.The attributes
(taste,temperature,cleanliness,friendliness, ease of understand-
ing, speed, and accuracy) were inputted and principal components
analysis was used. Only one factor had an eigenvalue greater than
1 (eigenvalue = 5.118) suggesting all were suitable for loading on
a single factor of performance. A Cronbach alpha of .94 suggested
an acceptable scale reliability. Then, a confirmatory factor analysis
was conducted to validate that all items were measuring indicators
of quality performance at the unit level. All items had standardized
loadings of .8 or higher. The GFI = .96, AGFI = .92, CFI = .98, NFI = .98.
The 2 = 400.42, df = 14, and p < .01 and RMSEA = .08. All indicators
suggested acceptable model fit (Hu and Bentler, 1995; Jöreskog and
Sörbom, 1993; Kline, 1998; Rigdon, 1996), except the2, which is
highly influenced by large samples, as it was in the present study.
The average variance extracted (AVE) and composite reliability (CR)
were .69 and .94, respectively (Fornell and Larcker,1981). All of
these measures of reliability and validity suggested the measure
itself was acceptable, but for discussion, each item was examined
individually.
As mentioned in the literature review, the PRCA stage involved
creating two columns with dummy codes. In the first column low
attribute performance,or a score below the mean, was coded as
“1”, whereas all other ratings of attribute performance were coded
as “0.” In the second column, the high attribute performance was
coded as “1”,whereas all other ratings of attribute performance
were coded as “0.” The two dummy sets were then regressed against
a measure of overall satisfaction, resulting in two regression coeffi-
cients for each attribute. If a score was exactly the mean, it received
a (0,0) rating.The means for the items,along with the aforemen-
tioned wording can be found in Table 2.
4. Results
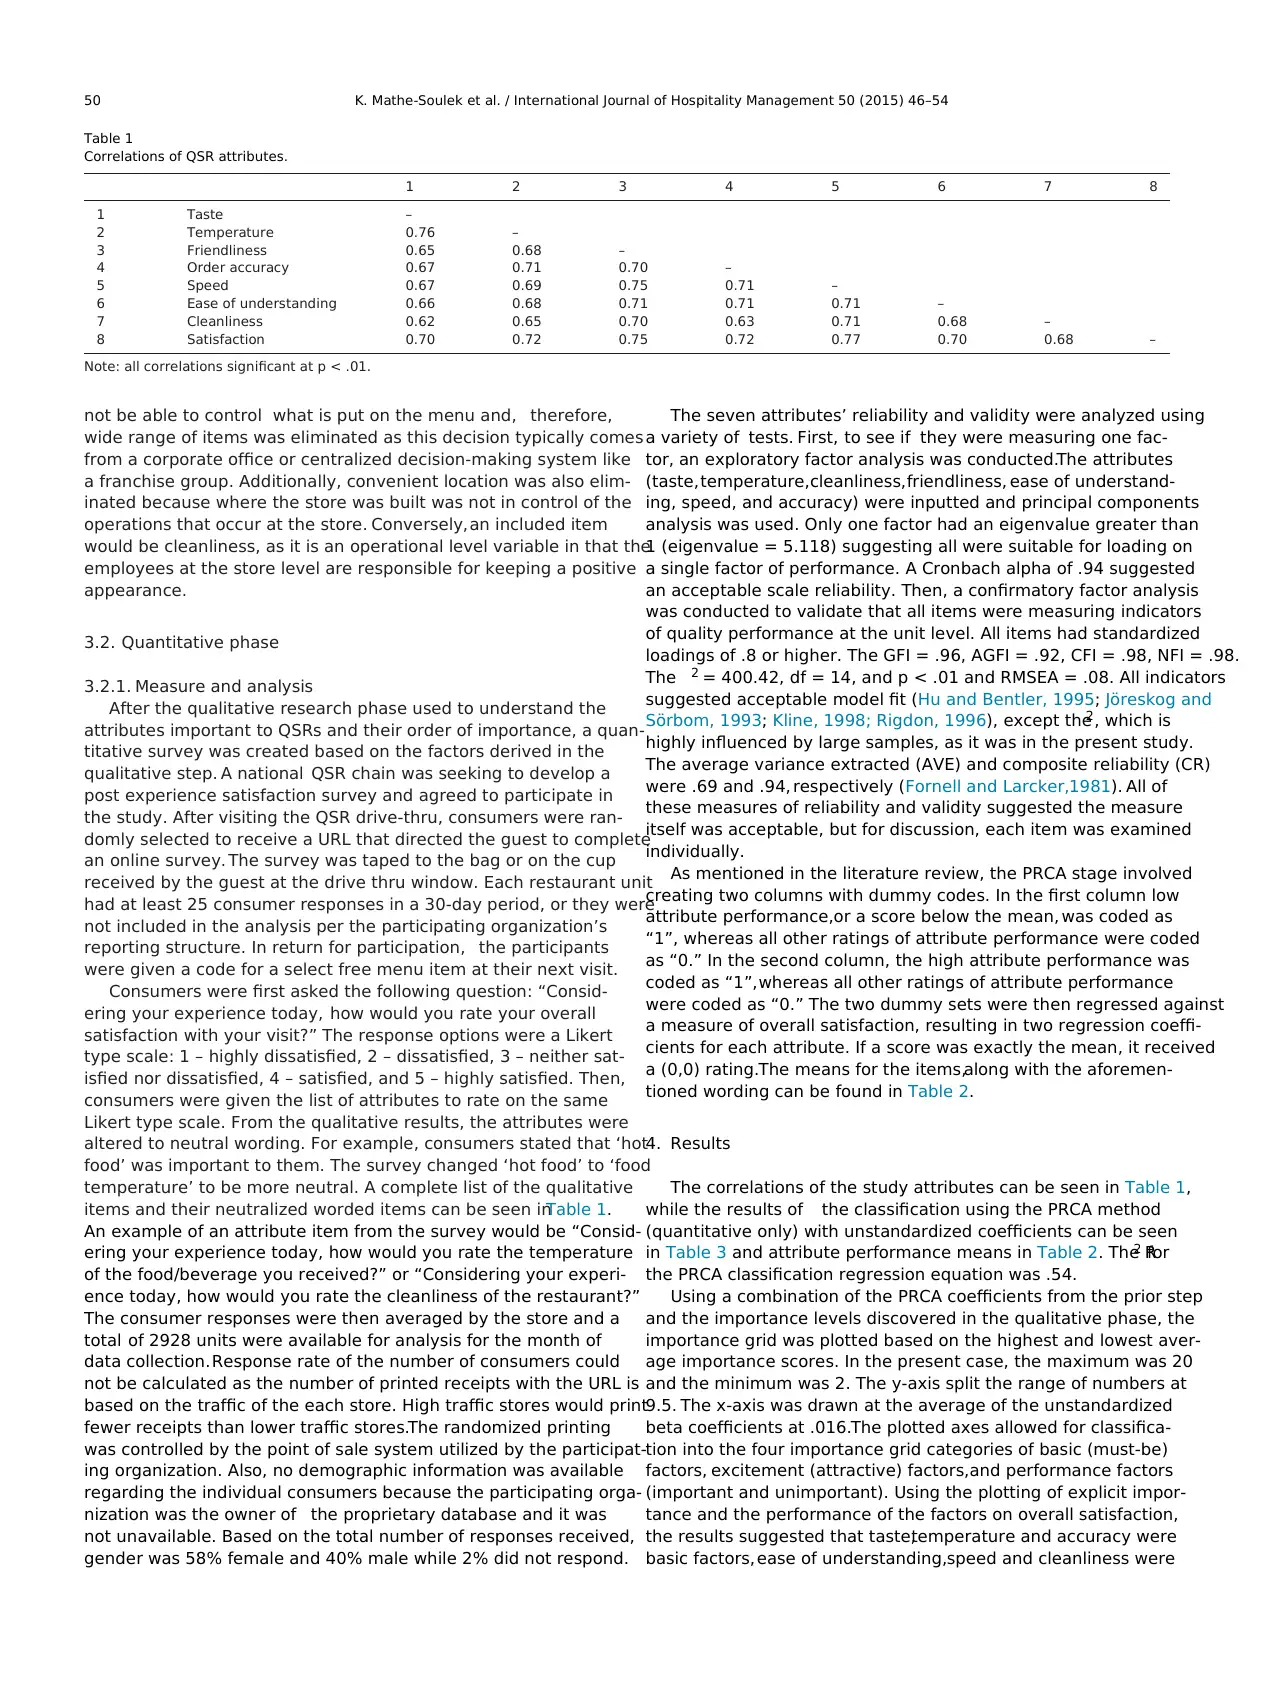
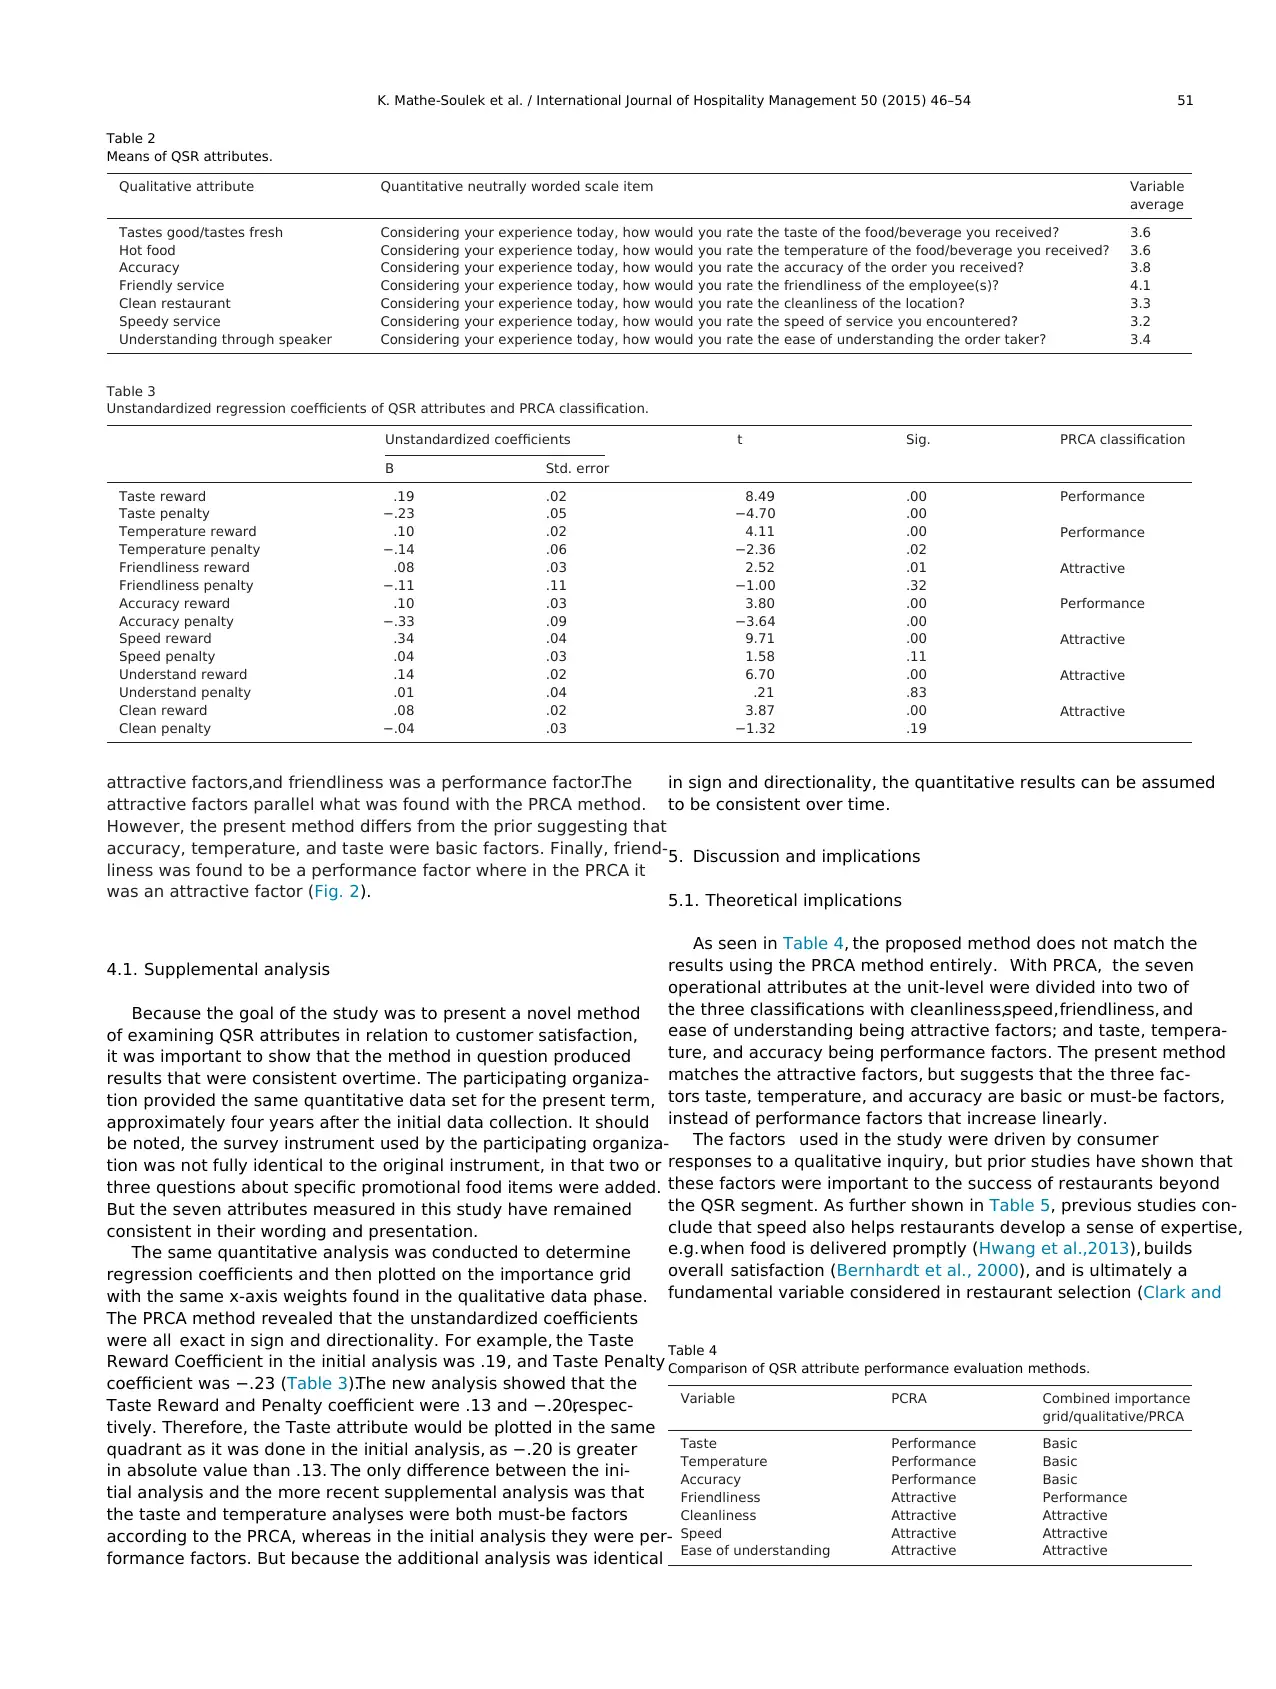
The correlations of the study attributes can be seen in Table 1,
while the results of the classification using the PRCA method
(quantitative only) with unstandardized coefficients can be seen
in Table 3 and attribute performance means in Table 2. The R2 for
the PRCA classification regression equation was .54.
Using a combination of the PRCA coefficients from the prior step
and the importance levels discovered in the qualitative phase, the
importance grid was plotted based on the highest and lowest aver-
age importance scores. In the present case, the maximum was 20
and the minimum was 2. The y-axis split the range of numbers at
9.5. The x-axis was drawn at the average of the unstandardized
beta coefficients at .016.The plotted axes allowed for classifica-
tion into the four importance grid categories of basic (must-be)
factors, excitement (attractive) factors,and performance factors
(important and unimportant). Using the plotting of explicit impor-
tance and the performance of the factors on overall satisfaction,
the results suggested that taste,temperature and accuracy were
basic factors, ease of understanding,speed and cleanliness were
Table 1
Correlations of QSR attributes.
1 2 3 4 5 6 7 8
1 Taste –
2 Temperature 0.76 –
3 Friendliness 0.65 0.68 –
4 Order accuracy 0.67 0.71 0.70 –
5 Speed 0.67 0.69 0.75 0.71 –
6 Ease of understanding 0.66 0.68 0.71 0.71 0.71 –
7 Cleanliness 0.62 0.65 0.70 0.63 0.71 0.68 –
8 Satisfaction 0.70 0.72 0.75 0.72 0.77 0.70 0.68 –
Note: all correlations significant at p < .01.
not be able to control what is put on the menu and, therefore,
wide range of items was eliminated as this decision typically comes
from a corporate office or centralized decision-making system like
a franchise group. Additionally, convenient location was also elim-
inated because where the store was built was not in control of the
operations that occur at the store. Conversely,an included item
would be cleanliness, as it is an operational level variable in that the
employees at the store level are responsible for keeping a positive
appearance.
3.2. Quantitative phase
3.2.1. Measure and analysis
After the qualitative research phase used to understand the
attributes important to QSRs and their order of importance, a quan-
titative survey was created based on the factors derived in the
qualitative step. A national QSR chain was seeking to develop a
post experience satisfaction survey and agreed to participate in
the study. After visiting the QSR drive-thru, consumers were ran-
domly selected to receive a URL that directed the guest to complete
an online survey. The survey was taped to the bag or on the cup
received by the guest at the drive thru window. Each restaurant unit
had at least 25 consumer responses in a 30-day period, or they were
not included in the analysis per the participating organization’s
reporting structure. In return for participation, the participants
were given a code for a select free menu item at their next visit.
Consumers were first asked the following question: “Consid-
ering your experience today, how would you rate your overall
satisfaction with your visit?” The response options were a Likert
type scale: 1 – highly dissatisfied, 2 – dissatisfied, 3 – neither sat-
isfied nor dissatisfied, 4 – satisfied, and 5 – highly satisfied. Then,
consumers were given the list of attributes to rate on the same
Likert type scale. From the qualitative results, the attributes were
altered to neutral wording. For example, consumers stated that ‘hot
food’ was important to them. The survey changed ‘hot food’ to ‘food
temperature’ to be more neutral. A complete list of the qualitative
items and their neutralized worded items can be seen inTable 1.
An example of an attribute item from the survey would be “Consid-
ering your experience today, how would you rate the temperature
of the food/beverage you received?” or “Considering your experi-
ence today, how would you rate the cleanliness of the restaurant?”
The consumer responses were then averaged by the store and a
total of 2928 units were available for analysis for the month of
data collection.Response rate of the number of consumers could
not be calculated as the number of printed receipts with the URL is
based on the traffic of the each store. High traffic stores would print
fewer receipts than lower traffic stores.The randomized printing
was controlled by the point of sale system utilized by the participat-
ing organization. Also, no demographic information was available
regarding the individual consumers because the participating orga-
nization was the owner of the proprietary database and it was
not unavailable. Based on the total number of responses received,
gender was 58% female and 40% male while 2% did not respond.
The seven attributes’ reliability and validity were analyzed using
a variety of tests. First, to see if they were measuring one fac-
tor, an exploratory factor analysis was conducted.The attributes
(taste,temperature,cleanliness,friendliness, ease of understand-
ing, speed, and accuracy) were inputted and principal components
analysis was used. Only one factor had an eigenvalue greater than
1 (eigenvalue = 5.118) suggesting all were suitable for loading on
a single factor of performance. A Cronbach alpha of .94 suggested
an acceptable scale reliability. Then, a confirmatory factor analysis
was conducted to validate that all items were measuring indicators
of quality performance at the unit level. All items had standardized
loadings of .8 or higher. The GFI = .96, AGFI = .92, CFI = .98, NFI = .98.
The 2 = 400.42, df = 14, and p < .01 and RMSEA = .08. All indicators
suggested acceptable model fit (Hu and Bentler, 1995; Jöreskog and
Sörbom, 1993; Kline, 1998; Rigdon, 1996), except the2, which is
highly influenced by large samples, as it was in the present study.
The average variance extracted (AVE) and composite reliability (CR)
were .69 and .94, respectively (Fornell and Larcker,1981). All of
these measures of reliability and validity suggested the measure
itself was acceptable, but for discussion, each item was examined
individually.
As mentioned in the literature review, the PRCA stage involved
creating two columns with dummy codes. In the first column low
attribute performance,or a score below the mean, was coded as
“1”, whereas all other ratings of attribute performance were coded
as “0.” In the second column, the high attribute performance was
coded as “1”,whereas all other ratings of attribute performance
were coded as “0.” The two dummy sets were then regressed against
a measure of overall satisfaction, resulting in two regression coeffi-
cients for each attribute. If a score was exactly the mean, it received
a (0,0) rating.The means for the items,along with the aforemen-
tioned wording can be found in Table 2.
4. Results
The correlations of the study attributes can be seen in Table 1,
while the results of the classification using the PRCA method
(quantitative only) with unstandardized coefficients can be seen
in Table 3 and attribute performance means in Table 2. The R2 for
the PRCA classification regression equation was .54.
Using a combination of the PRCA coefficients from the prior step
and the importance levels discovered in the qualitative phase, the
importance grid was plotted based on the highest and lowest aver-
age importance scores. In the present case, the maximum was 20
and the minimum was 2. The y-axis split the range of numbers at
9.5. The x-axis was drawn at the average of the unstandardized
beta coefficients at .016.The plotted axes allowed for classifica-
tion into the four importance grid categories of basic (must-be)
factors, excitement (attractive) factors,and performance factors
(important and unimportant). Using the plotting of explicit impor-
tance and the performance of the factors on overall satisfaction,
the results suggested that taste,temperature and accuracy were
basic factors, ease of understanding,speed and cleanliness were
⊘ This is a preview!⊘
Do you want full access?
Subscribe today to unlock all pages.
Trusted by 1+ million students worldwide
K. Mathe-Soulek et al. / International Journal of Hospitality Management 50 (2015) 46–54 51
Table 2
Means of QSR attributes.
Qualitative attribute Quantitative neutrally worded scale item Variable
average
Tastes good/tastes fresh Considering your experience today, how would you rate the taste of the food/beverage you received? 3.6
Hot food Considering your experience today, how would you rate the temperature of the food/beverage you received? 3.6
Accuracy Considering your experience today, how would you rate the accuracy of the order you received? 3.8
Friendly service Considering your experience today, how would you rate the friendliness of the employee(s)? 4.1
Clean restaurant Considering your experience today, how would you rate the cleanliness of the location? 3.3
Speedy service Considering your experience today, how would you rate the speed of service you encountered? 3.2
Understanding through speaker Considering your experience today, how would you rate the ease of understanding the order taker? 3.4
Table 3
Unstandardized regression coefficients of QSR attributes and PRCA classification.
Unstandardized coefficients t Sig. PRCA classification
B Std. error
Taste reward .19 .02 8.49 .00 Performance
Taste penalty −.23 .05 −4.70 .00
Temperature reward .10 .02 4.11 .00 Performance
Temperature penalty −.14 .06 −2.36 .02
Friendliness reward .08 .03 2.52 .01 Attractive
Friendliness penalty −.11 .11 −1.00 .32
Accuracy reward .10 .03 3.80 .00 Performance
Accuracy penalty −.33 .09 −3.64 .00
Speed reward .34 .04 9.71 .00 Attractive
Speed penalty .04 .03 1.58 .11
Understand reward .14 .02 6.70 .00 Attractive
Understand penalty .01 .04 .21 .83
Clean reward .08 .02 3.87 .00 Attractive
Clean penalty −.04 .03 −1.32 .19
attractive factors,and friendliness was a performance factor.The
attractive factors parallel what was found with the PRCA method.
However, the present method differs from the prior suggesting that
accuracy, temperature, and taste were basic factors. Finally, friend-
liness was found to be a performance factor where in the PRCA it
was an attractive factor (Fig. 2).
4.1. Supplemental analysis
Because the goal of the study was to present a novel method
of examining QSR attributes in relation to customer satisfaction,
it was important to show that the method in question produced
results that were consistent overtime. The participating organiza-
tion provided the same quantitative data set for the present term,
approximately four years after the initial data collection. It should
be noted, the survey instrument used by the participating organiza-
tion was not fully identical to the original instrument, in that two or
three questions about specific promotional food items were added.
But the seven attributes measured in this study have remained
consistent in their wording and presentation.
The same quantitative analysis was conducted to determine
regression coefficients and then plotted on the importance grid
with the same x-axis weights found in the qualitative data phase.
The PRCA method revealed that the unstandardized coefficients
were all exact in sign and directionality. For example, the Taste
Reward Coefficient in the initial analysis was .19, and Taste Penalty
coefficient was −.23 (Table 3).The new analysis showed that the
Taste Reward and Penalty coefficient were .13 and −.20,respec-
tively. Therefore, the Taste attribute would be plotted in the same
quadrant as it was done in the initial analysis, as −.20 is greater
in absolute value than .13. The only difference between the ini-
tial analysis and the more recent supplemental analysis was that
the taste and temperature analyses were both must-be factors
according to the PRCA, whereas in the initial analysis they were per-
formance factors. But because the additional analysis was identical
in sign and directionality, the quantitative results can be assumed
to be consistent over time.
5. Discussion and implications
5.1. Theoretical implications
As seen in Table 4, the proposed method does not match the
results using the PRCA method entirely. With PRCA, the seven
operational attributes at the unit-level were divided into two of
the three classifications with cleanliness,speed,friendliness, and
ease of understanding being attractive factors; and taste, tempera-
ture, and accuracy being performance factors. The present method
matches the attractive factors, but suggests that the three fac-
tors taste, temperature, and accuracy are basic or must-be factors,
instead of performance factors that increase linearly.
The factors used in the study were driven by consumer
responses to a qualitative inquiry, but prior studies have shown that
these factors were important to the success of restaurants beyond
the QSR segment. As further shown in Table 5, previous studies con-
clude that speed also helps restaurants develop a sense of expertise,
e.g.when food is delivered promptly (Hwang et al.,2013), builds
overall satisfaction (Bernhardt et al., 2000), and is ultimately a
fundamental variable considered in restaurant selection (Clark and
Table 4
Comparison of QSR attribute performance evaluation methods.
Variable PCRA Combined importance
grid/qualitative/PRCA
Taste Performance Basic
Temperature Performance Basic
Accuracy Performance Basic
Friendliness Attractive Performance
Cleanliness Attractive Attractive
Speed Attractive Attractive
Ease of understanding Attractive Attractive
Paraphrase This Document
Need a fresh take? Get an instant paraphrase of this document with our AI Paraphraser
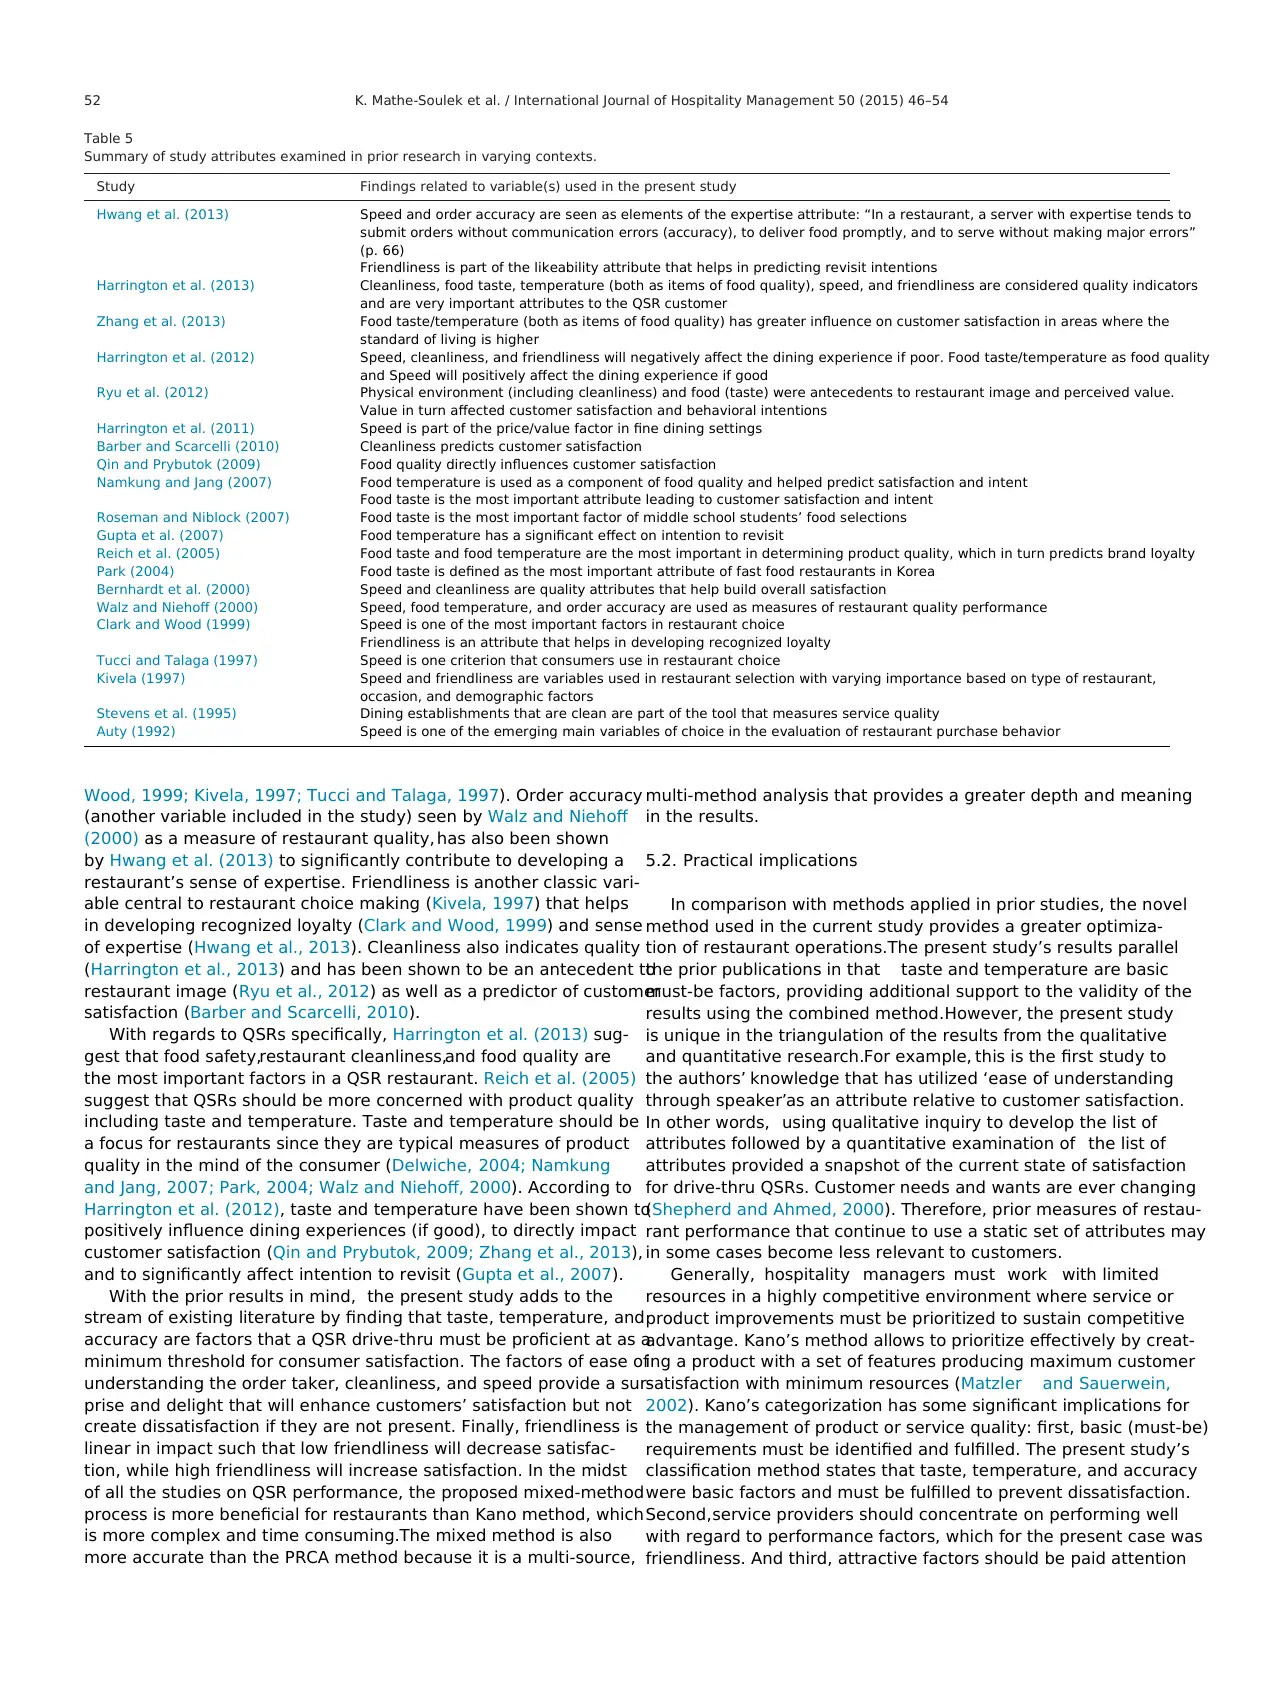
52 K. Mathe-Soulek et al. / International Journal of Hospitality Management 50 (2015) 46–54
Table 5
Summary of study attributes examined in prior research in varying contexts.
Study Findings related to variable(s) used in the present study
Hwang et al. (2013) Speed and order accuracy are seen as elements of the expertise attribute: “In a restaurant, a server with expertise tends to
submit orders without communication errors (accuracy), to deliver food promptly, and to serve without making major errors”
(p. 66)
Friendliness is part of the likeability attribute that helps in predicting revisit intentions
Harrington et al. (2013) Cleanliness, food taste, temperature (both as items of food quality), speed, and friendliness are considered quality indicators
and are very important attributes to the QSR customer
Zhang et al. (2013) Food taste/temperature (both as items of food quality) has greater influence on customer satisfaction in areas where the
standard of living is higher
Harrington et al. (2012) Speed, cleanliness, and friendliness will negatively affect the dining experience if poor. Food taste/temperature as food quality
and Speed will positively affect the dining experience if good
Ryu et al. (2012) Physical environment (including cleanliness) and food (taste) were antecedents to restaurant image and perceived value.
Value in turn affected customer satisfaction and behavioral intentions
Harrington et al. (2011) Speed is part of the price/value factor in fine dining settings
Barber and Scarcelli (2010) Cleanliness predicts customer satisfaction
Qin and Prybutok (2009) Food quality directly influences customer satisfaction
Namkung and Jang (2007) Food temperature is used as a component of food quality and helped predict satisfaction and intent
Food taste is the most important attribute leading to customer satisfaction and intent
Roseman and Niblock (2007) Food taste is the most important factor of middle school students’ food selections
Gupta et al. (2007) Food temperature has a significant effect on intention to revisit
Reich et al. (2005) Food taste and food temperature are the most important in determining product quality, which in turn predicts brand loyalty
Park (2004) Food taste is defined as the most important attribute of fast food restaurants in Korea
Bernhardt et al. (2000) Speed and cleanliness are quality attributes that help build overall satisfaction
Walz and Niehoff (2000) Speed, food temperature, and order accuracy are used as measures of restaurant quality performance
Clark and Wood (1999) Speed is one of the most important factors in restaurant choice
Friendliness is an attribute that helps in developing recognized loyalty
Tucci and Talaga (1997) Speed is one criterion that consumers use in restaurant choice
Kivela (1997) Speed and friendliness are variables used in restaurant selection with varying importance based on type of restaurant,
occasion, and demographic factors
Stevens et al. (1995) Dining establishments that are clean are part of the tool that measures service quality
Auty (1992) Speed is one of the emerging main variables of choice in the evaluation of restaurant purchase behavior
Wood, 1999; Kivela, 1997; Tucci and Talaga, 1997). Order accuracy
(another variable included in the study) seen by Walz and Niehoff
(2000) as a measure of restaurant quality, has also been shown
by Hwang et al. (2013) to significantly contribute to developing a
restaurant’s sense of expertise. Friendliness is another classic vari-
able central to restaurant choice making (Kivela, 1997) that helps
in developing recognized loyalty (Clark and Wood, 1999) and sense
of expertise (Hwang et al., 2013). Cleanliness also indicates quality
(Harrington et al., 2013) and has been shown to be an antecedent to
restaurant image (Ryu et al., 2012) as well as a predictor of customer
satisfaction (Barber and Scarcelli, 2010).
With regards to QSRs specifically, Harrington et al. (2013) sug-
gest that food safety,restaurant cleanliness,and food quality are
the most important factors in a QSR restaurant. Reich et al. (2005)
suggest that QSRs should be more concerned with product quality
including taste and temperature. Taste and temperature should be
a focus for restaurants since they are typical measures of product
quality in the mind of the consumer (Delwiche, 2004; Namkung
and Jang, 2007; Park, 2004; Walz and Niehoff, 2000). According to
Harrington et al. (2012), taste and temperature have been shown to
positively influence dining experiences (if good), to directly impact
customer satisfaction (Qin and Prybutok, 2009; Zhang et al., 2013),
and to significantly affect intention to revisit (Gupta et al., 2007).
With the prior results in mind, the present study adds to the
stream of existing literature by finding that taste, temperature, and
accuracy are factors that a QSR drive-thru must be proficient at as a
minimum threshold for consumer satisfaction. The factors of ease of
understanding the order taker, cleanliness, and speed provide a sur-
prise and delight that will enhance customers’ satisfaction but not
create dissatisfaction if they are not present. Finally, friendliness is
linear in impact such that low friendliness will decrease satisfac-
tion, while high friendliness will increase satisfaction. In the midst
of all the studies on QSR performance, the proposed mixed-method
process is more beneficial for restaurants than Kano method, which
is more complex and time consuming.The mixed method is also
more accurate than the PRCA method because it is a multi-source,
multi-method analysis that provides a greater depth and meaning
in the results.
5.2. Practical implications
In comparison with methods applied in prior studies, the novel
method used in the current study provides a greater optimiza-
tion of restaurant operations.The present study’s results parallel
the prior publications in that taste and temperature are basic
must-be factors, providing additional support to the validity of the
results using the combined method.However, the present study
is unique in the triangulation of the results from the qualitative
and quantitative research.For example, this is the first study to
the authors’ knowledge that has utilized ‘ease of understanding
through speaker’as an attribute relative to customer satisfaction.
In other words, using qualitative inquiry to develop the list of
attributes followed by a quantitative examination of the list of
attributes provided a snapshot of the current state of satisfaction
for drive-thru QSRs. Customer needs and wants are ever changing
(Shepherd and Ahmed, 2000). Therefore, prior measures of restau-
rant performance that continue to use a static set of attributes may
in some cases become less relevant to customers.
Generally, hospitality managers must work with limited
resources in a highly competitive environment where service or
product improvements must be prioritized to sustain competitive
advantage. Kano’s method allows to prioritize effectively by creat-
ing a product with a set of features producing maximum customer
satisfaction with minimum resources (Matzler and Sauerwein,
2002). Kano’s categorization has some significant implications for
the management of product or service quality: first, basic (must-be)
requirements must be identified and fulfilled. The present study’s
classification method states that taste, temperature, and accuracy
were basic factors and must be fulfilled to prevent dissatisfaction.
Second,service providers should concentrate on performing well
with regard to performance factors, which for the present case was
friendliness. And third, attractive factors should be paid attention
K. Mathe-Soulek et al. / International Journal of Hospitality Management 50 (2015) 46–54 53
to as those produce a pleasant surprise for the customer and help to
stand out from the competition. In other words, speed, cleanliness,
and ease of understanding will surprise and delight customers, they
will improve satisfaction if present but will not increase dissatis-
faction if not present.
The present study helps to extend the quality attributes litera-
ture with the present method in multiple ways. First, this method is
one of the first to triangulate a qualitative approach and a quantita-
tive approach. Mikuli´c and Prebeˇzac (2011) explored five methods
in a review of quality attributes classification. The current study
combines three of those methods (qualitative data methods, impor-
tance grid, and PRCA), which helps to eliminate common method
variance that can occur when using a single sample to evaluate both
importance and performance attributes.As mentioned before,in
future research,hospitality operators and hospitality researchers
should utilize the same approach, as consumer trends and expec-
tations are likely to change over time.
5.3. Future research and limitations
There are several future research possibilities based on the
results of the current study. Specifically, interaction effects should
be explored as that could create a better understanding of unit
level operations. Specifically, Harrington et al. (2011) suggest that
speed of service is part of the value factor in fine dining restau-
rants. Future studies should examine how factors such as value and
speed or cleanliness and taste interact with each other in predicting
customer satisfaction.
Moreover, managerial qualities that affect the restaurant opera-
tions should also be examined. Specifically, motivational processes
from managers may differ in how a restaurant functions.Specif-
ically, regulatory focus theory that is composed of two distinct
processes (promotion focus and prevention focus), may shed new
light on which attributes are focused on more often. A promotion
focused individual focuses on achievement and production effi-
ciency; whereas a prevention focus individual focuses on safety and
accuracy (Higgins, 1998; Wallace and Chen, 2006). For a restaurant,
should practitioners attempt to fulfill customer orders as accurately
as possible at the expense of speed or cleanliness of a restaurant,
and miss on the extra satisfaction to be gained? Or should they
focus on speedy service that will provide a memorable experience
at the chance of a missed item in an order? As Chitturi et al. (2008)
state that customers want more than satisfaction, they want to be
delighted in exchange for loyalty to the organization.Because of
the impact a leader can when creating climate based on regulatory
focus (Wallace and Chen,2006), understanding how a restaurant
operates based on a prevention or promotion focus and the result-
ing satisfaction is warranted.
The current study is not without limitations. First, the factors
excluded from the analysis (convenient location,wide variety of
items, and low cost) are important factors to consider in restaurant
choice. Because the present study examined only the unit-level fac-
tors, there is a need to explore these attributes further to parallel
work by Harrington et al. (2013), which included a more extensive
list of attributes. Additionally, each variable is measured using a
single indicator. The use of multiple indicators is often used for the
sake of increased reliability of the measure, however, some service
researchers claim that increasing the number of items contributes
very little to the information obtained from the original, or first
item (Drolet and Morrison, 2001). Moreover, the present study only
examines consumer drive-thru experiences. For the present study,
it may be a limiting factor that cleanliness is judged by a drive-thru
customer. However, several studies report that consumers consider
the cleanliness of exterior spaces of restaurants (e.g. restrooms, out-
doors) to be an indicator of both kitchen conditions and the overall
service quality experience (Barber and Scarcelli,2010; Blackiston
and Evans, 2004; Scarcelli, 2007). Barber et al. (2011) stress the fact
that consumers evaluate dining experiences through aspects that
look beyond the obvious dining room servicescape and food and
service quality, and that minor elements such as lack of cleanli-
ness of a counter surface or availability of drying materials in the
restroom often lead to an expressed willingness to not return to a
restaurant (irrespective of dining room features or food or service
quality). Further, consumers have the ability to see some elements
of the restaurant through the drive-thru window in addition to
external features providing an acceptable evaluation of the features
of the restaurant.The current study has also made an attempt to
ensure that the proposed method is consistent over time by collect-
ing the same data four years after the initial analysis. With this in
mind, it is prudent to note that consumer groups have been known
to provide information that does not reflect their actual attitudes
and behaviors (Lutz, 2015), which is why preserving attributes over
time, like the present study, should provide greater validity.
References
Anderson, E.W., Mittal, V., 2000. Strengthening the satisfaction-profit chain. J. Serv.
Res. 3, 107–120.
Auty, S., 1992. Consumer choice and segmentation in the restaurant industry. Serv.
Ind. J. 12 (3), 324–339.
Barber, N., Goodman, R.J., Goh, B.K., 2011. Restaurant consumers repeat patronage:
a service quality concern. Int. J. Hosp. Manag. 30 (2), 329–336.
Barber, N., Scarcelli, J.M., 2010. Enhancing the assessment of tangible service
quality through the creation of a cleanliness measurement scale. Manag. Serv.
Qual. 20 (1), 70–88.
Bartikowski, B., Llosa, S., 2003. Identifying Satisfiers, Dissatisfiers, Criticals, and
Neutrals in Customer Satisfaction. Euromed Ecole de Management, Marseille.
Bernhardt, K.L., Donthu, N., Kennett, P.A., 2000. A longitudinal analysis of
satisfaction and profitability. J. Bus. Res. 47 (2), 161–171.
Blackiston, H., Evans, C., 2004. The lavatory laboratory. Restaur. Hosp. 88 (5),
142–144.
Brandt, R.D., 1988. How service marketers can identify value-enhancing service
element. J. Serv. Mark. 2 (3), 35–41.
Busacca, B., Padula, G., 2005. Understanding the relationship between attribute
performance and overall satisfaction: theory, measurement and implications.
Mark. Intell. Plann. 23 (6), 543–561.
Cadotte, E.R., Turgeon, N., 1988. Key factors in guest satisfaction. Cornell Hotel
Restaur. Admin. Q. 28 (4), 45–51.
Chen, L.F., 2012. A novel approach to regression analysis for the classification of
quality attributes in the Kano model: an empirical test in the food and
beverage industry. Omega 40 (5), 651–659.
Chitturi, R., Raghunathan, R., Mahajan, V., 2008. Delight by design: the role of
hedonic versus utilitarian benefits. J. Mark. 72 (3), 48–63.
Clark, M.A., Wood, R.C., 1999. Consumer loyalty in the restaurant industry: a
preliminary exploration of the issues. Br. Food J. 101 (4), 317–327.
Creswell, J.W., Clark, V.L.P., 2007. Designing and Conducting Mixed Methods
Research. Sage Publications, Thousand Oaks, California.
Delwiche, J., 2004. The impact of perceptual interactions on perceived flavor. Food
Qual. Prefer. 15 (2), 137–146.
Deng, W., 2007. Using a revised importance–performance analysis approach: the
case of Taiwanese hot springs tourism. Tour. Manag. 28, 1274–1284.
Deng, W.J., Chen, W.C., Pei, W., 2008. Back-propagation neural network based
importance–performance analysis for determining critical service attributes.
Expert Syst. Appl. 34, 1115–1125.
DiPietro, R.B., Parsa, H.G., Gregory, A., 2011. Restaurant QSC inspections and
financial performance: an empirical investigation. Int. J. Contemp. Hosp.
Manag. 23 (7), 982–999.
Drolet, A.L., Morrison, D., 2001. Do we really need multiple-item measures in
service research? J. Serv. Res. 3, 196–204.
Fornell, C., Larcker, D.F., 1981. Evaluating structural equation models with
unobservable variables and measurement error. J. Mark. Res. 18 (1), 39–50.
Gupta, S., McLaughlin, E., Gomez, M., 2007. Guest satisfaction and restaurant
performance. Cornell Hotel Restaur. Adm. Q. 48 (3), 284–298.
Harrington, R.J., Ottenbacher, M.C., Kendall, K.W., 2011. Fine-dining restaurant
selection: direct and moderating effects of customer attributes. J. Foodserv.
Bus. Res. 14 (3), 272–289.
Harrington, R.J., Ottenbacher, M.C., Staggs, A., Powell, F.A., 2012. Generation Y
consumers key restaurant attributes affecting positive and negative
experiences. J. Hosp. Tour. Res. 36 (4), 431–449.
Harrington, R.J., Ottenbacher, M.C., Way, K.A., 2013. QSR choice: key restaurant
attributes and the roles of gender, age and dining frequency. J. Qual. Assur.
Hosp. Tour. 14 (1), 81–100.
Herzberg, F., 1967. Work and the Nature of Man. The World Publishing Company,
Cleveland, OH.
Higgins, E.T., 1998. Promotion and prevention: regulatory focus as a motivational
principle. Adv. Exp. Soc. Psychol. 30, 1–46.
⊘ This is a preview!⊘
Do you want full access?
Subscribe today to unlock all pages.
Trusted by 1+ million students worldwide
54 K. Mathe-Soulek et al. / International Journal of Hospitality Management 50 (2015) 46–54
Hu, L., Bentler, P.M., 1995. Evaluating model fit. In: Hoyle, R.H. (Ed.), Structural
Equation Modeling: Concepts, Issues, and Applications. Sage, Thousand Oaks,
CA, pp. 76–99.
Hui, M.K., Zhao, X., Fan, X., Au, K., 2005. When does the service process matter? A
test of two comparing theories. J. Consum. Res. 31 (2), 465–475.
Hussey, J., Hussey, R., 1997. Business Research. A Practical Guide for
Undergraduate and Postgraduate Students. Macmillan Business, London.
Hwang, J., Kim, S.S., Hyun, S.S., 2013. The role of server–patron mutual disclosure
in the formation of rapport with and revisit intentions of patrons at full-service
restaurants: the moderating roles of marital status and educational level. Int. J.
Hosp. Manag. 33, 64–75.
Johnson, R.B., Onwuegbuzie, A.J., 2004. Mixed methods research: a research
paradigm whose time has come. Educ. Res. 33 (7), 14–26.
Jöreskog, K.G., Sörbom, D., 1993. LISREL 8: Structural equation modeling with the
SIMPLIS command language. Scientific Software International.
Kano, N., Seraku, N., Takahashi, F., Tsuji, S., 1984. Attractive quality and must-be
quality. Hinshitsu J. Jpn. Soc. Qual. Control 14, 39–48.
Kano, N., 2001. Life cycle and creation of attractive quality. In: Paper Presented at
the 4th International Quality Management and Organizational Development
Conference, Linköping University, Linköping.
Kivela, J.J., 1997. Restaurant marketing: selection and segmentation in Hong Kong.
Int. J. Contemp. Hosp. Manag. 9 (3), 116–123.
Kline, R.B., 1998. Principles and Practice of Structural Equation Modeling. Guilford
Press, New York.
KSDK, 2013. Consumers filling out receipt surveys, http://www.ksdk.com/story/
money/2013/10/19/3040831/ (accessed 22.01.15).
Lin, S.P., Yang, C.L., Chan, Y.H., Sheu, C., 2010. Refining Kano’s quality
attributes-satisfaction model: a moderated regression approach. Int. J. Prod.
Econ. 126, 255–263.
Löfgren, M., Witell, L., 2008. Two decades of using Kano’s theory of attractive
quality: a literature review. Qual. Manag. J. 15 (1), 59–75.
Lutz, A., 2015. Millennials are lying about what they want to eat, and it’s
destroying fast food, Retrieved from http://www.businessinsider.com/
millennials-fast-food-habits-2015-6 (accessed 25.06.15).
Mangan, J., Lalwani, C., Gardner, B., 2004. Combining quantitative and qualitative
methodologies in logistics research. Int. J. Phys. Distrib. Log. Manag. 34 (7),
565–578.
Martilla, J.A., James, J.C., 1977. Importance–performance analysis. J. Mark. 41 (1),
77–79.
Mathe, K., (doctoral dissertation) 2011. An individual, unit, and
organizational-level examination of perceived external prestige, psychological
capital, and psychological empowerment in quick service restaurants.
Oklahoma State University, Stillwater, available from ProQuest Dissertations
(UMI No. 3495875).
Matzler, K., Bailom, F., Hinterhuber, H., Renzl, B., Pichler, J., 2004. The asymmetric
relationship between attribute-level performance and overall customer
satisfaction: a reconsideration of the importance–performance analysis. Ind.
Mark. Manag. 33, 271–277.
Matzler, K., Hinterhuber, H., 1998. How to make product development projects
more successful by integrating Kano’s model of customer satisfaction into
quality function deployment. Technovation 18 (1), 5–38.
Matzler, K., Sauerwein, E., 2002. The factor structure of customer satisfaction: an
empirical test of the importance grid and the penalty–reward-contrast
analysis. Int. J. Serv. Ind. Manag. 13 (4), 314–332.
Matzler, K., Sauerwein, E., Heischmidt, A., 2003. Importance–performance analysis
revisited: the role of the factor structure of customer satisfaction. Serv. Ind. J.
23 (2), 112–129.
Mikuli ´c, J., Prebeˇzac, D., 2011. A critical review of techniques for classifying quality
attributes in the Kano model. Manag. Serv. 21 (1), 46–66.
Mittal, V.R., Ross, W.T., Baldasare, P.M., 1998. The asymmetric impact on negative
and positive attribute-level performance on overall satisfaction and
repurchase intentions. J. Mark. 62 (1), 33–47.
Namkung, Y., Jang, S., 2007. Does food quality really matter in restaurants? Its
impact on customer satisfaction and behavioral intentions. J. Hosp. Tour. Res.
31 (3), 387–409.
Oh, H., 2001. Revisiting importance–performance analysis. Tour. Manag. 22,
617–627.
Oliver, R.L., 1997. Satisfaction. A Behavioral Perspective on the Consumer.
Irwin/McGraw-Hill, Boston.
Park, C., 2004. Efficient or enjoyable? Consumer values of eating-out and fast food
restaurant consumption in Korea. Int. J. Hosp. Manag. 23 (1), 87–94.
Qin, H., Prybutok, V.R., 2009. Service quality, customer satisfaction, and behavioral
intentions in fast-food restaurants. Int. J. Qual. Serv. Sci. 1 (1), 78–95.
QSR Magazine, 2012a. Quick-service industry to grow by 4.9 percent in 2013,
Retrieved from http://www.qsrmagazine.com/news/quick-service-industry-
grow-49-percent-2013 (accessed 27.08.13).
QSR Magazine, 2012b. 2012 QSR Drive-thru study, Retrieved from http://www.
qsrmagazine.com/reports/2012-qsr-drive-thru-study (accessed 29.12.13).
Parasuraman, A., Zeithaml, V.A., Berry, L.L., 1988. Servqual: A Multiple-Item Scale
For Measuring Consumer Perc. J. Retail. 64 (1), 12.
Reich, A.Z., McCleary, K.W., Tepannon, Y., Weaver, P.A., 2005. The impact of
product and service quality on brand loyalty. J. Foodserv. Bus. Res. 8 (3),
35–53.
Rigdon, E., 1996. CFI versus RMSEA: a comparison of two fit indices for structural
equation modeling. Struct. Equ. Model. 3, 369–379.
Robinson, 2007. Review of the Book: Designing and Conducting Mixed Methods
Research., http://dx.doi.org/10.1111/j.1753-6405.2007.00096.x
Roseman, M., Niblock, J.R., 2007. A Culinary Approach to Healthy Menu Items. J.
Culinary Sci. Tech. 5 (1), 75–90.
Ryu, K., Lee, H.R., Kim, W.G., 2012. The influence of the quality of the physical
environment, food, and service on restaurant image, customer perceived value,
customer satisfaction, and behavioral intentions. Int. J. Contemp. Hosp. Manag.
24 (2), 200–223.
Scarcelli, J., (masters thesis) 2007. Clean restaurant restrooms: do they indicate a
clean kitchen. Purdue University, West Lafayette, IN.
Shepherd, C., Ahmed, P.K., 2000. From product innovation to solutions innovation:
a new paradigm for competitive advantage. Eur. J. Innov. Manag. 3 (2),
100–106.
Slevitch, L., Oh, H., 2010. Asymmetric relationship between attribute performance
and customer satisfaction: a new perspective. Int. J. Hosp. Manag. 29,
559–569.
Stevens, P., Knutson, B., Patton, M., 1995. DINESERV: a tool for measuring service
quality in restaurants. Cornell Hotel Restaur. Adm. Q. 36 (2), 5–60.
Szymanski, D.M., Hise, R.T., 2000. E-satisfaction: an initial examination. J. Retail. 76
(3), 309–322.
Ting, S.C., Chen, C.N., 2002. The asymmetrical and nonlinear effects of store quality
attributes on customer satisfaction. Total Qual. Manag. 13 (4), 547–569.
Tucci, L.A., Talaga, J., 1997. Service guarantees and consumers’ evaluation of
services. J. Serv. Mark. 11 (1), 10–18.
Vavra, T.G., 1997. Improving Your Measurement of Customer Satisfaction: A Guide
to Creating, Conducting Analyzing and Reporting Customer Satisfaction
Measurement Program. ASQC Quality Press, Milwaukee, WI.
Walz, S.M., Niehoff, B.P., 2000. Organizational citizenship behaviors: their
relationship to organizational effectiveness. J. Hosp. Tour. Res. 24 (3), 301–319.
Wallace, C., Chen, G., 2006. A multilevel integration of personality, climate,
self-regulation, and performance. Pers. Psychol. 59 (3), 529–557.
Zhang, Z., Zhang, Z., Law, R., 2013. Regional effects on customer satisfaction with
restaurants. Int. J. Contemp. Hosp. Manag. 25 (5), 705–722.
View publication statsView publication stats
1 out of 10
Your All-in-One AI-Powered Toolkit for Academic Success.
+13062052269
info@desklib.com
Available 24*7 on WhatsApp / Email
![[object Object]](/_next/static/media/star-bottom.7253800d.svg)
Unlock your academic potential
Copyright © 2020–2026 A2Z Services. All Rights Reserved. Developed and managed by ZUCOL.