Financial Crisis Analysis and Risk Management
VerifiedAdded on 2020/06/03
|29
|3940
|49
AI Summary
This assignment requires students to delve into the causes and consequences of the 2008 global financial crisis. It involves analyzing various factors that contributed to the crisis, evaluating its impact on different sectors and economies, and exploring risk management strategies employed to mitigate future crises. Furthermore, students will apply the Capital Asset Pricing Model (CAPM) to calculate the expected return for a portfolio of companies based on their risk profiles.
Contribute Materials
Your contribution can guide someone’s learning journey. Share your
documents today.

INTERNATIONAL INVESTMENT
Secure Best Marks with AI Grader
Need help grading? Try our AI Grader for instant feedback on your assignments.
TABLE OF CONTENTS
INTRODUCTION.......................................................................................................................................................................................1
QUESTION 1..............................................................................................................................................................................................1
Assessing the causes of global crisis.......................................................................................................................................................1
QUESTION 2..............................................................................................................................................................................................6
Critically analyzing the impact of global crisis on financial market.......................................................................................................6
Use of monetary and fiscal policy.........................................................................................................................................................12
Performance of economy since 2009.....................................................................................................................................................13
CONCLUSION..........................................................................................................................................................................................20
REFERENCES..........................................................................................................................................................................................21
APPENDIX................................................................................................................................................................................................23
INTRODUCTION
International investment may be served as a strategy that is undertaken by an investor with the motive to select globally best
securities. Hence, international investment includes mutual funds, American Depository receipt, mutual funds etc. on which high level
of emphasis is laid by the investors with the motive to generate high margin. Now, for making high value addition in money investors
make more focus on investing money in riskier securities. This in turn enables them to generate high margin as compared to other
securities. However, when investors trade or deal at global level them overall economic condition has high level of impact on the
return generated by investors. In this, report will present the reasons due to which situation of crisis occurred. Besides this, it will
provide deeper insight about the extent to which condition of crisis has placed on financial market. Further, it also depicts the manner
in which fiscal and monetary policies have an impact on the recovery of nation’s economy.
QUESTION 1
Assessing the causes of global crisis
Global financial crisis comes in existence due to many reasons and one of them was that one easy terms and conditions debt
was given to the people and business firms in the USA. Due to this reason people consistently keeps on purchasing properties at fast
rate. People give houses on rent and due to some reason suddenly in property market price of real estate properties start declining
(Blau, Ferber. and Winkler, 2013). Due to all these reasons number of defaulters also increase in the nation. All these things lead to
growing NPA in the nation and due to non-receipt of payment banks earn less profit in the business which lead to liquidation of
Merrill Lynch and Layman brothers which were one of leading banks of USA. In era of globalization economies of multiple nations
are interrelated to each other and negative trend in USA affected overall economic growth globally (Richardson, 2016). This heavily
affects its GDP growth rate and led to elevation in unemployment rate in the nation.From assessment, it has been identified that there
are several causes due to which crisis situation occurred in the period of 2007-09 (Patel, 2016). Main causes which are responsible for
the recessionary period are enumerated below:
High lending: Banking institutions lay high level of emphasis on lending money to others with the aim to create more funds.
Hence, in the period of 2007, with the aim to create huge sum of money focus was laid by bank on offering new and high loans
(Schiek, 2016). The below mentioned graph clearly presents that in the period of 7 years banks doubled the amount of money
which in turn resulted into heavy debt in the economy.
Secure Best Marks with AI Grader
Need help grading? Try our AI Grader for instant feedback on your assignments.
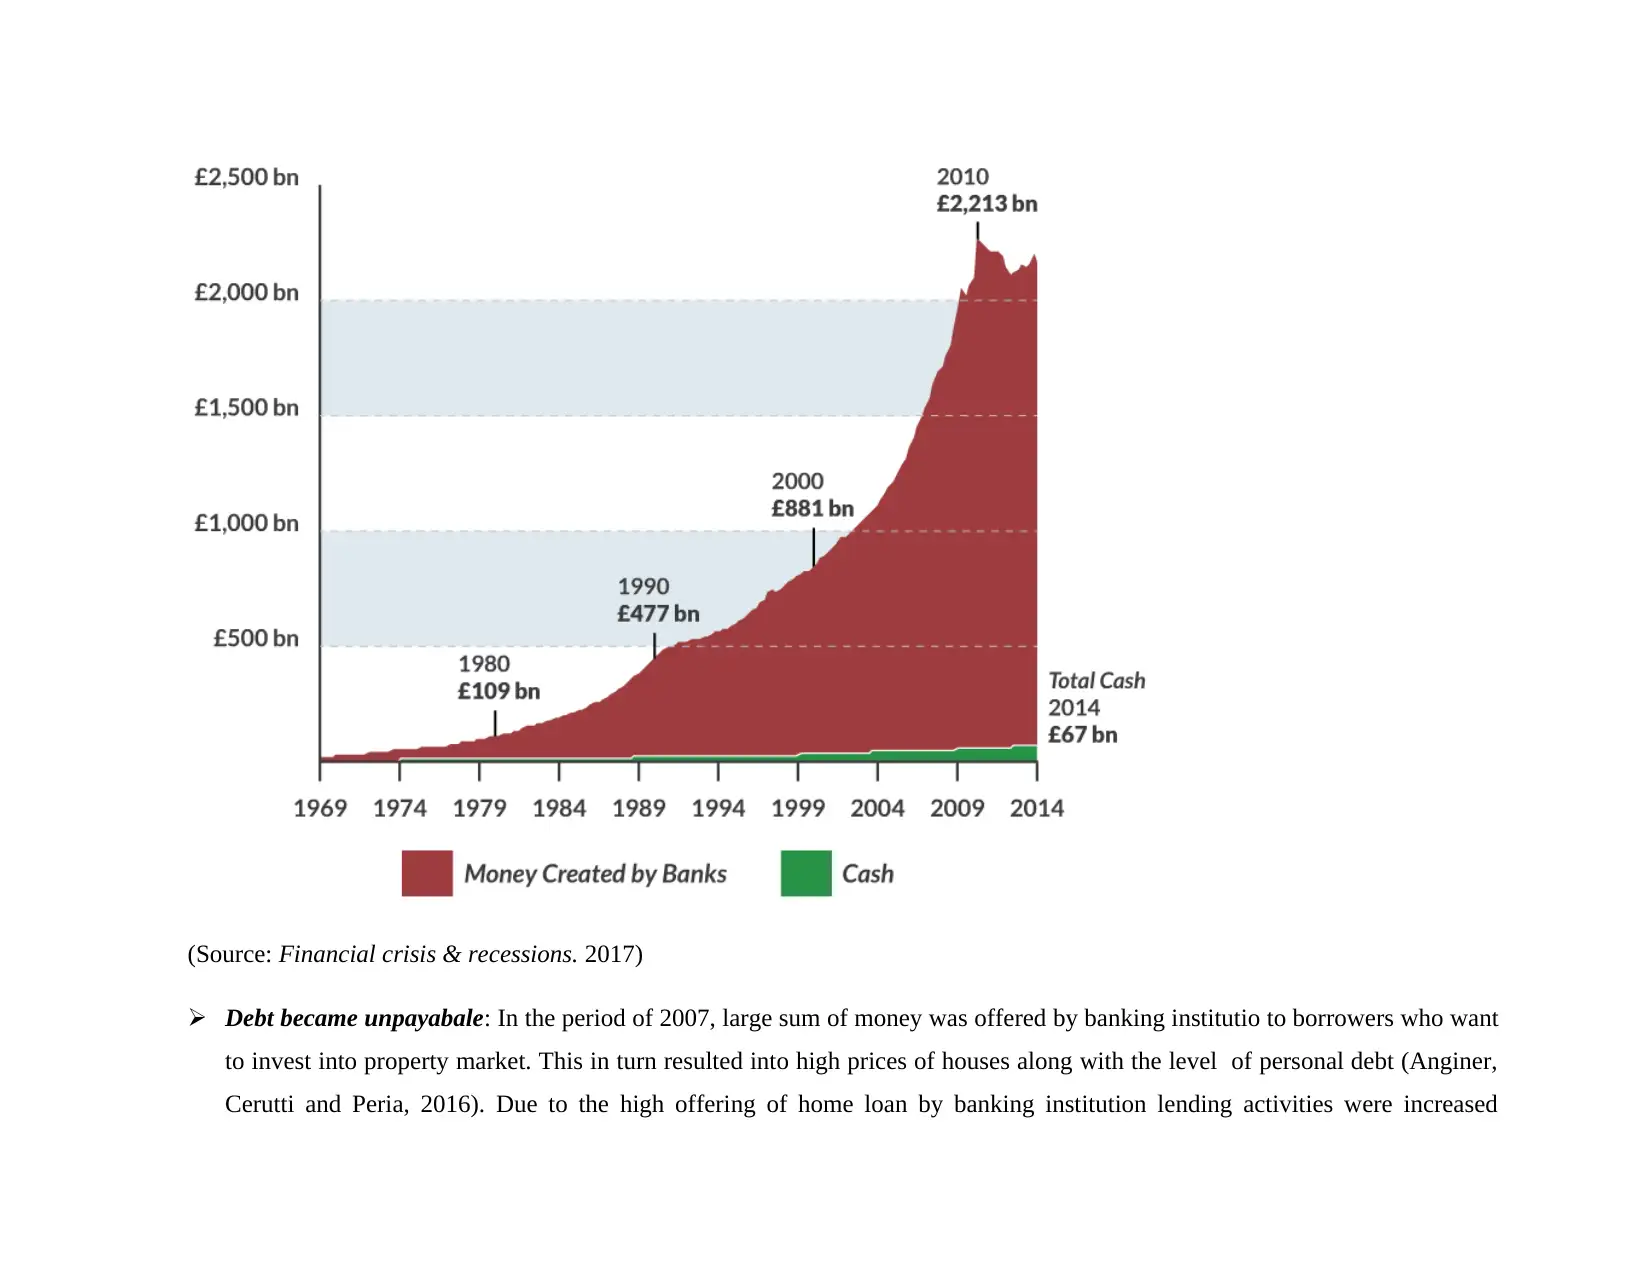
(Source: Financial crisis & recessions. 2017)
Debt became unpayabale: In the period of 2007, large sum of money was offered by banking institutio to borrowers who want
to invest into property market. This in turn resulted into high prices of houses along with the level of personal debt (Anginer,
Cerutti and Peria, 2016). Due to the high offering of home loan by banking institution lending activities were increased
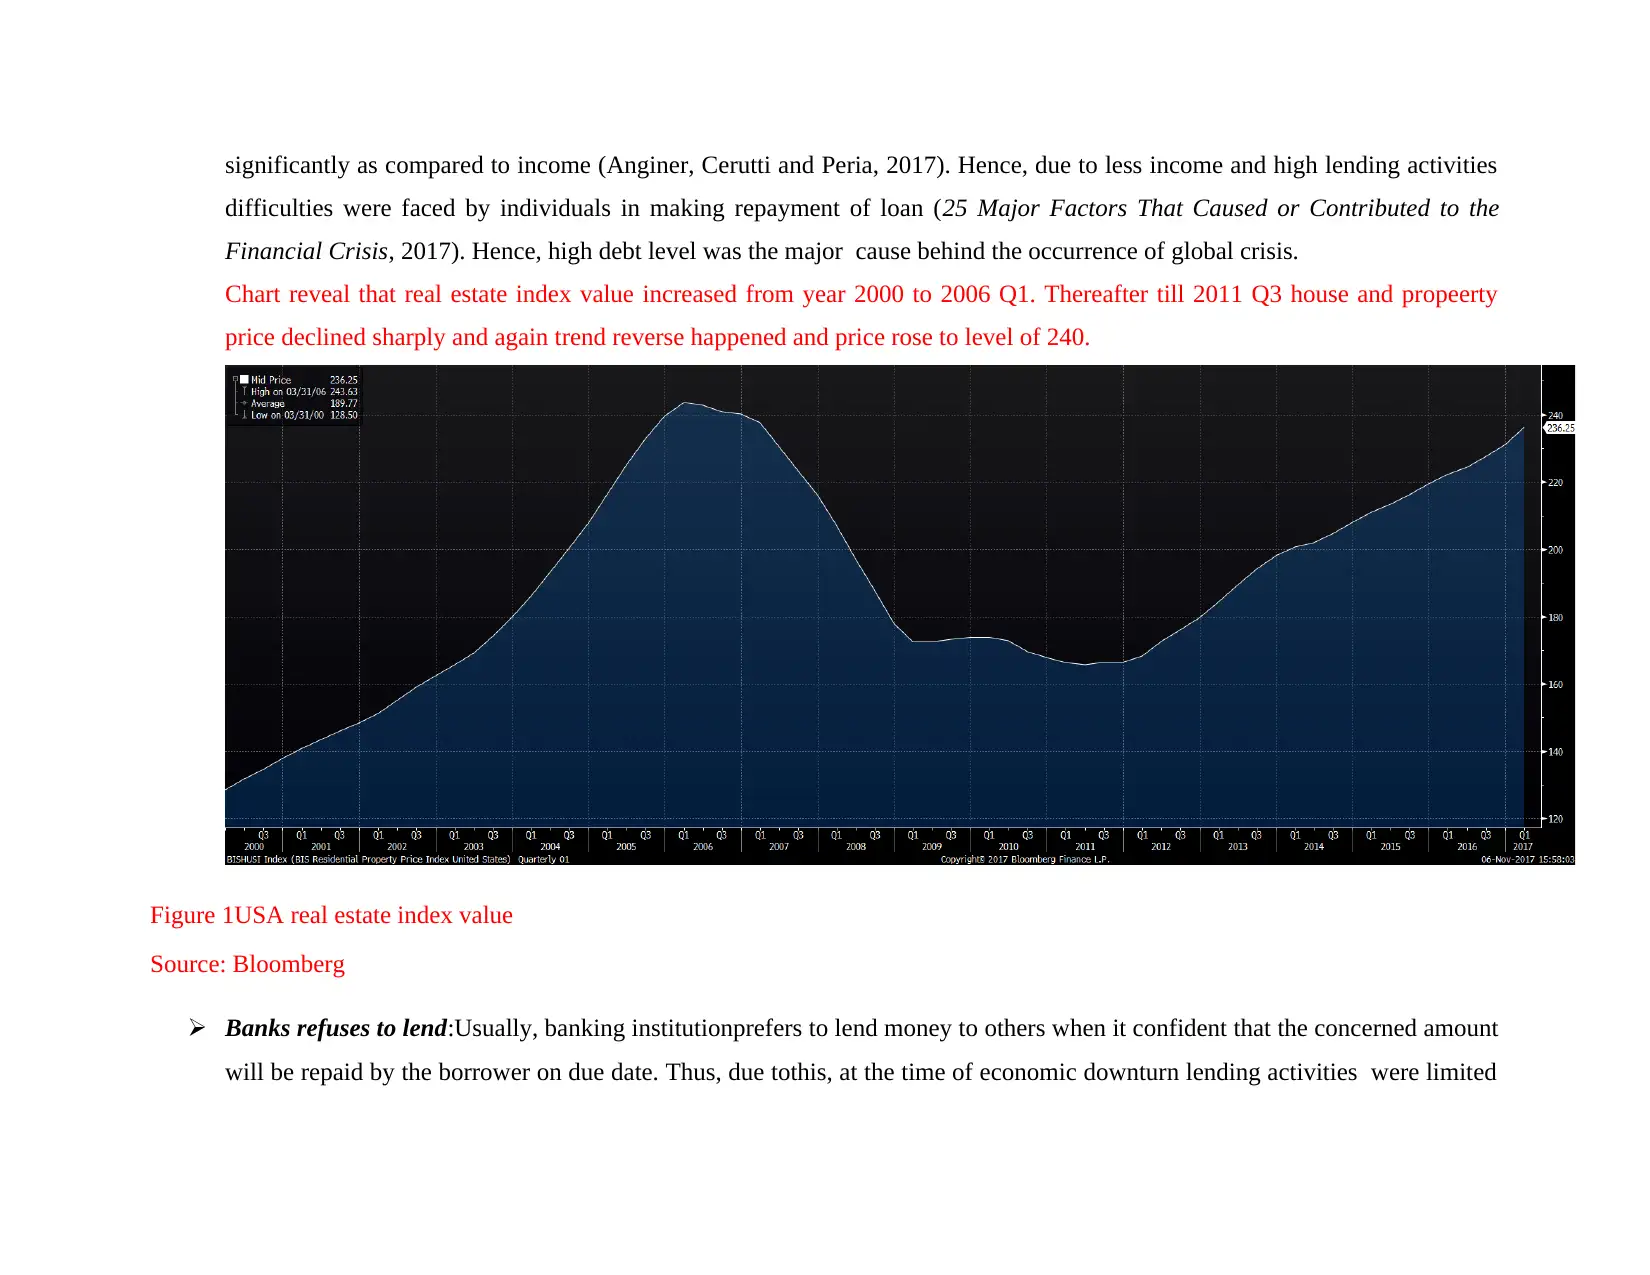
significantly as compared to income (Anginer, Cerutti and Peria, 2017). Hence, due to less income and high lending activities
difficulties were faced by individuals in making repayment of loan (25 Major Factors That Caused or Contributed to the
Financial Crisis, 2017). Hence, high debt level was the major cause behind the occurrence of global crisis.
Chart reveal that real estate index value increased from year 2000 to 2006 Q1. Thereafter till 2011 Q3 house and propeerty
price declined sharply and again trend reverse happened and price rose to level of 240.
Figure 1USA real estate index value
Source: Bloomberg
Banks refuses to lend:Usually, banking institutionprefers to lend money to others when it confident that the concerned amount
will be repaid by the borrower on due date. Thus, due tothis, at the time of economic downturn lending activities were limited
by banking institution (Stiles, 2016). Such aspect has placed negative impact on thegrowth and development of different
sectors. Moreover for expansionbusiness unit requires enough money. In addition to this, customers prefer to inverst money in
the luxurious product only when they have high disposable income or other sources. Decrease in the level of lending has
placed negative impact onthe development of organizations.
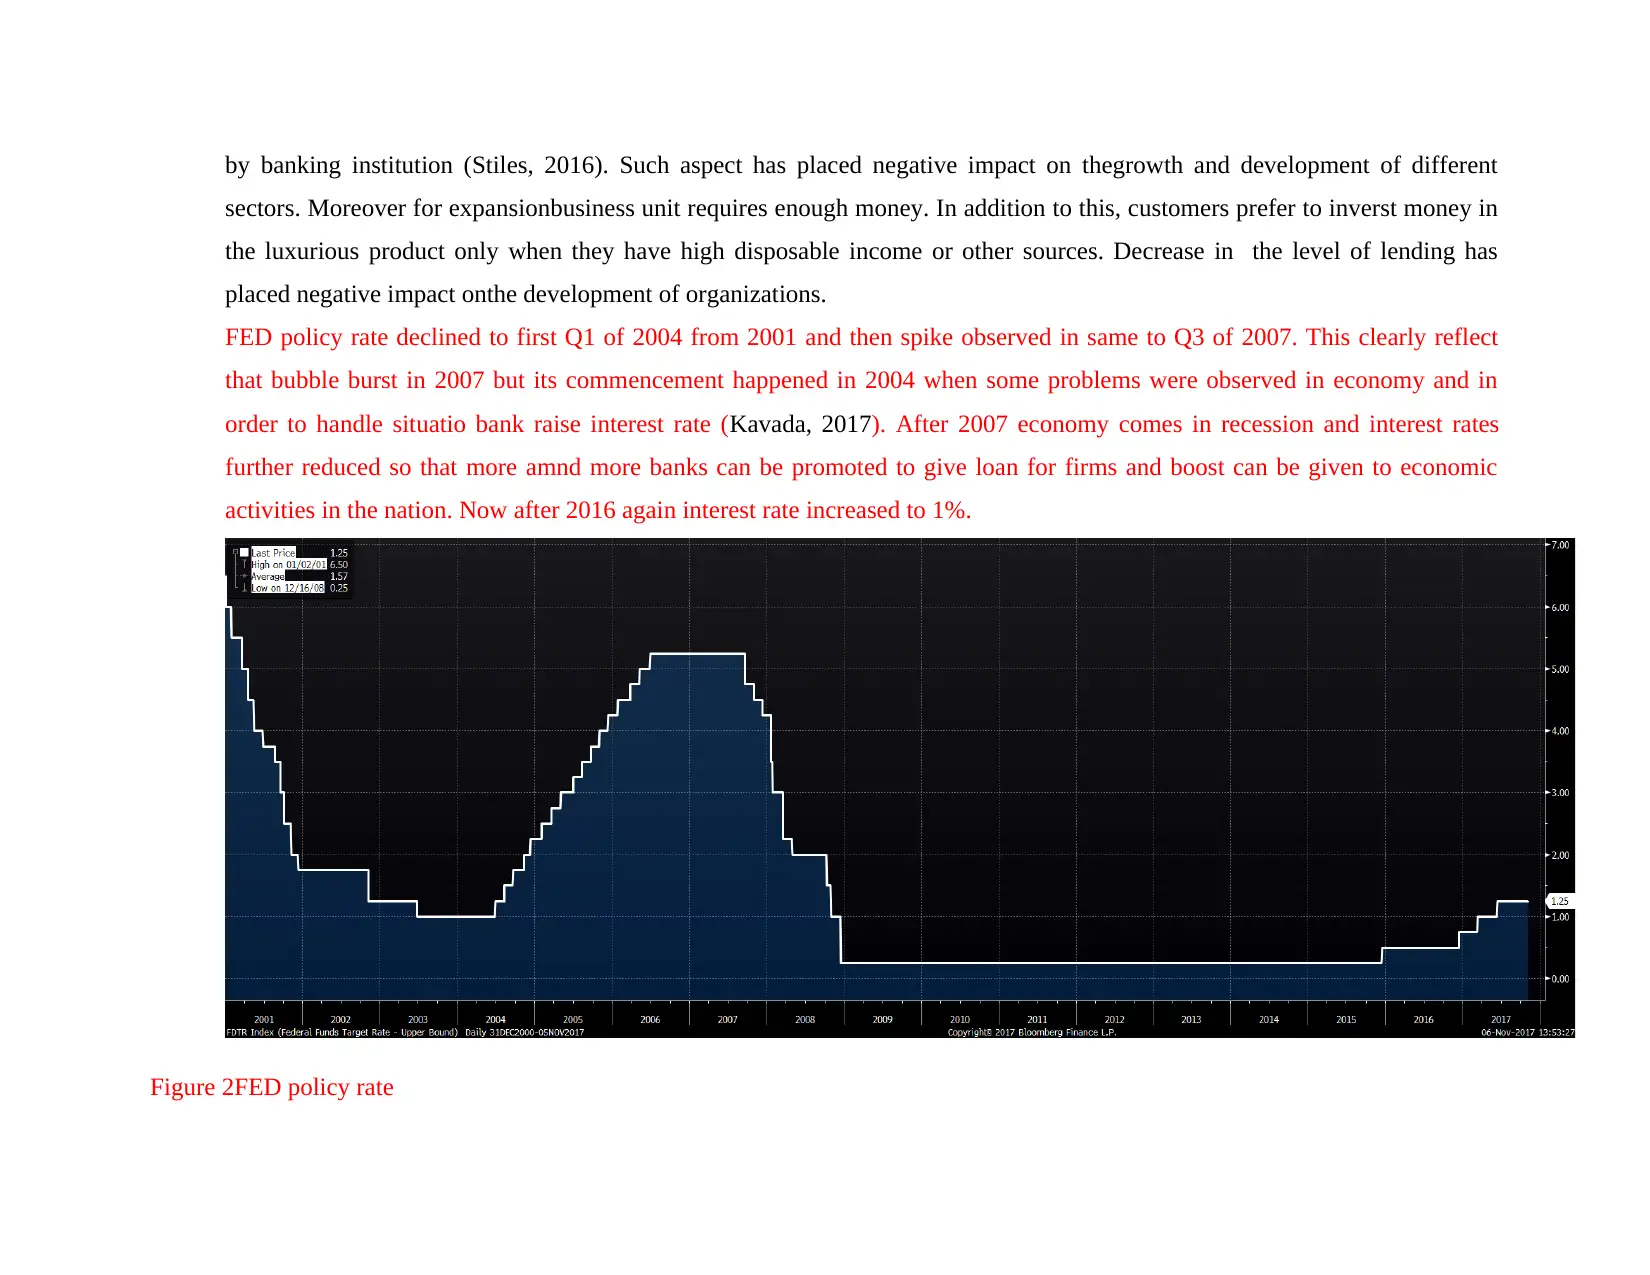
FED policy rate declined to first Q1 of 2004 from 2001 and then spike observed in same to Q3 of 2007. This clearly reflect
that bubble burst in 2007 but its commencement happened in 2004 when some problems were observed in economy and in
order to handle situatio bank raise interest rate (Kavada, 2017). After 2007 economy comes in recession and interest rates
further reduced so that more amnd more banks can be promoted to give loan for firms and boost can be given to economic
activities in the nation. Now after 2016 again interest rate increased to 1%.
Figure 2FED policy rate
sectors. Moreover for expansionbusiness unit requires enough money. In addition to this, customers prefer to inverst money in
the luxurious product only when they have high disposable income or other sources. Decrease in the level of lending has
placed negative impact onthe development of organizations.
FED policy rate declined to first Q1 of 2004 from 2001 and then spike observed in same to Q3 of 2007. This clearly reflect
that bubble burst in 2007 but its commencement happened in 2004 when some problems were observed in economy and in
order to handle situatio bank raise interest rate (Kavada, 2017). After 2007 economy comes in recession and interest rates
further reduced so that more amnd more banks can be promoted to give loan for firms and boost can be given to economic
activities in the nation. Now after 2016 again interest rate increased to 1%.
Figure 2FED policy rate
Paraphrase This Document
Need a fresh take? Get an instant paraphrase of this document with our AI Paraphraser
Source: Bloomberg
QUESTION 2
Critically analyzing the impact of global crisis on financial market
With the motive to assess the impact of global financial crisis onstock market 5 companies from different sectors have been
selected such as tourism, development, hospitality, retail and insurance. In this regard, for analyzing performance of stock market in
the context global recession both pre and post crisis evaluations have been done. The rationale behind doing such evaluation is to
assess thelevel to which return associated with the different types of firm affected due to the crisis.
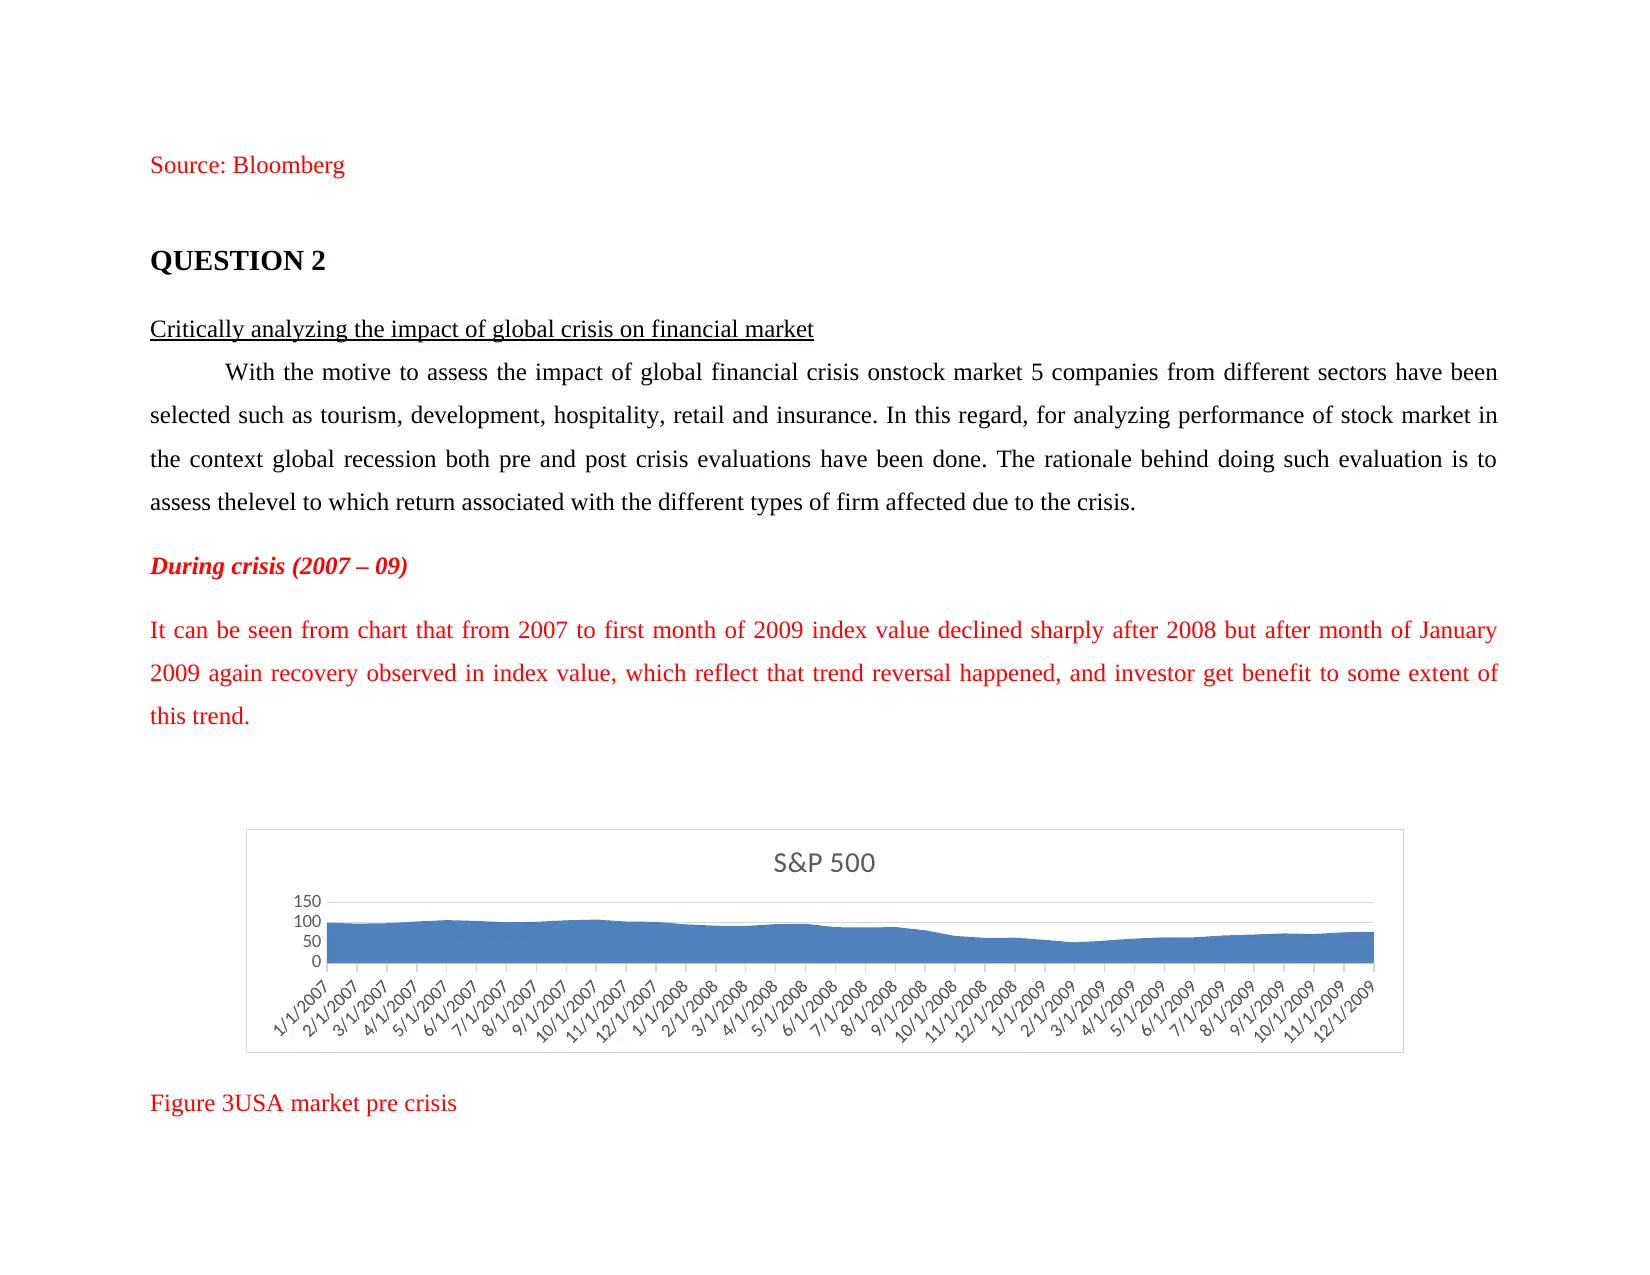
During crisis (2007 – 09)
It can be seen from chart that from 2007 to first month of 2009 index value declined sharply after 2008 but after month of January
2009 again recovery observed in index value, which reflect that trend reversal happened, and investor get benefit to some extent of
this trend.
0
50
100
150
S&P 500
Figure 3USA market pre crisis
QUESTION 2
Critically analyzing the impact of global crisis on financial market
With the motive to assess the impact of global financial crisis onstock market 5 companies from different sectors have been
selected such as tourism, development, hospitality, retail and insurance. In this regard, for analyzing performance of stock market in
the context global recession both pre and post crisis evaluations have been done. The rationale behind doing such evaluation is to
assess thelevel to which return associated with the different types of firm affected due to the crisis.
During crisis (2007 – 09)
It can be seen from chart that from 2007 to first month of 2009 index value declined sharply after 2008 but after month of January
2009 again recovery observed in index value, which reflect that trend reversal happened, and investor get benefit to some extent of
this trend.
0
50
100
150
S&P 500
Figure 3USA market pre crisis
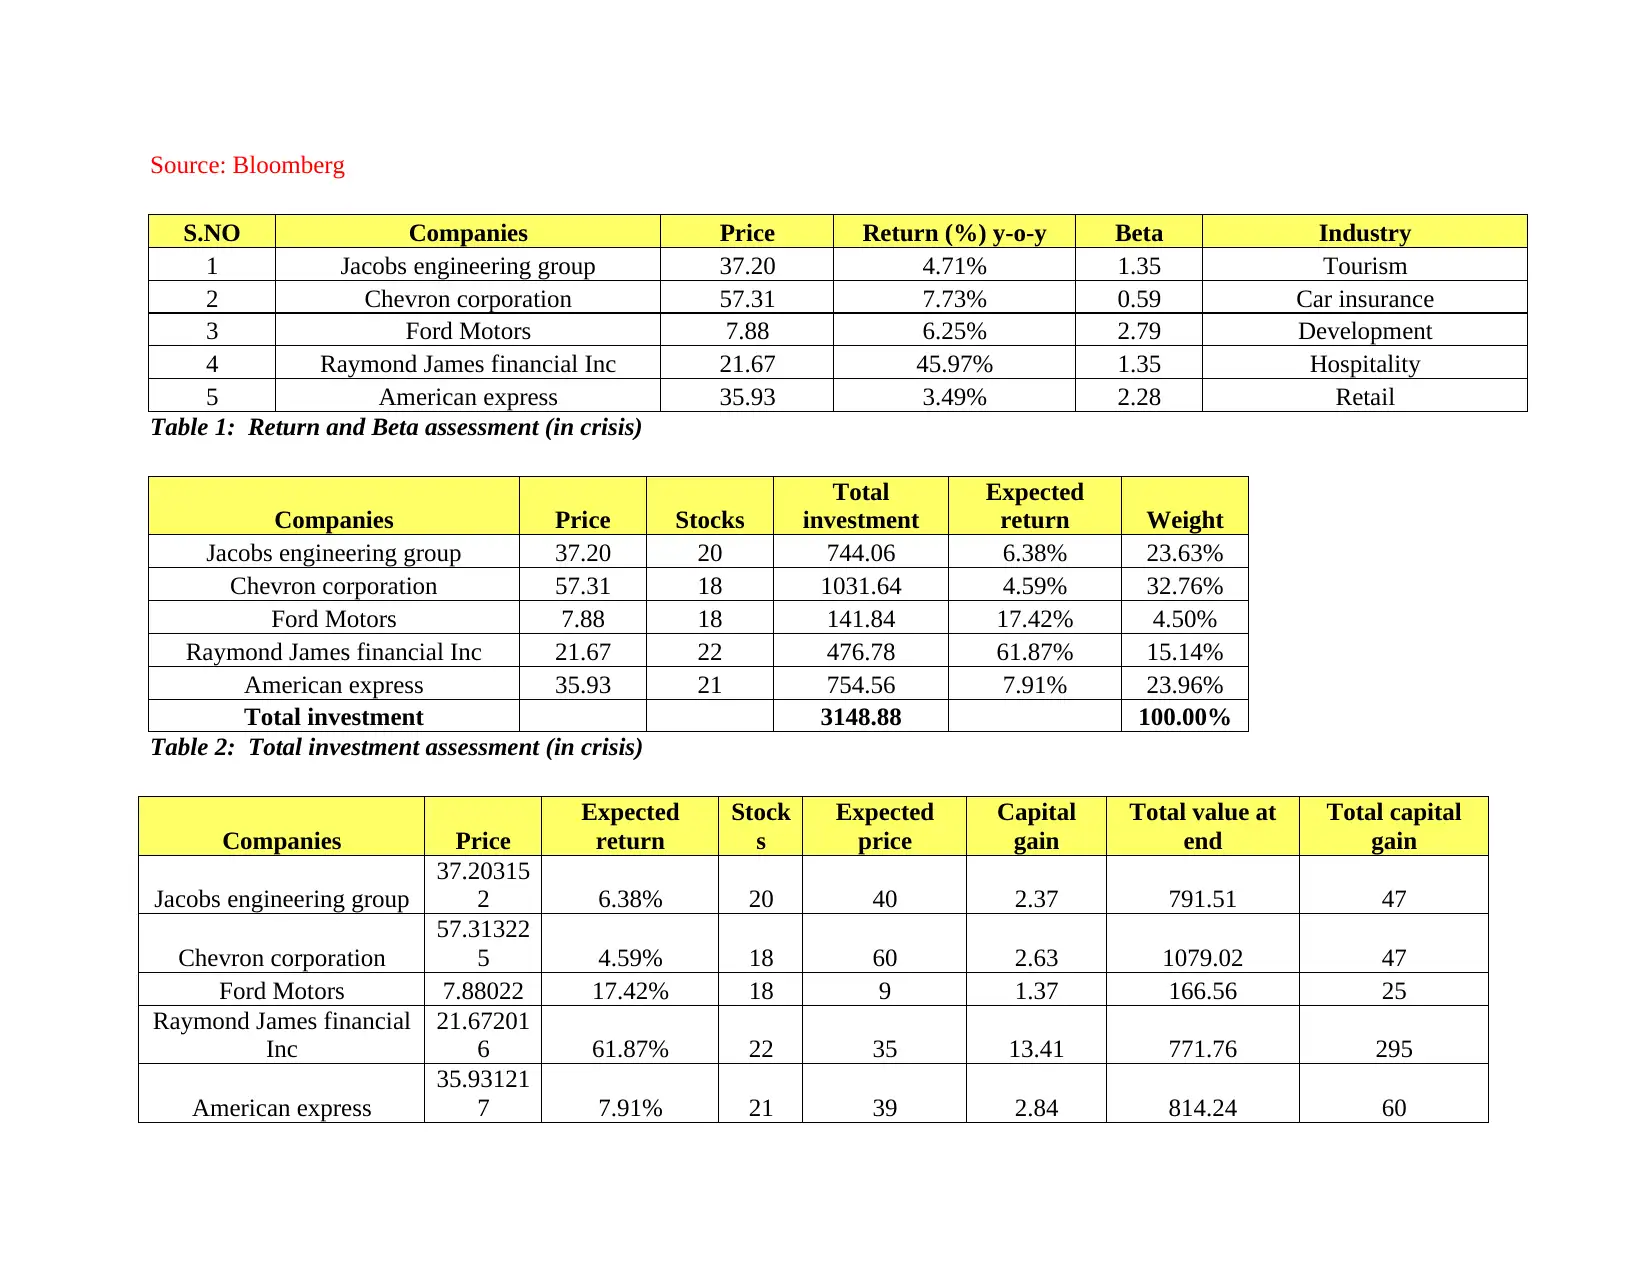
Source: Bloomberg
S.NO Companies Price Return (%) y-o-y Beta Industry
1 Jacobs engineering group 37.20 4.71% 1.35 Tourism
2 Chevron corporation 57.31 7.73% 0.59 Car insurance
3 Ford Motors 7.88 6.25% 2.79 Development
4 Raymond James financial Inc 21.67 45.97% 1.35 Hospitality
5 American express 35.93 3.49% 2.28 Retail
Table 1: Return and Beta assessment (in crisis)
Companies Price Stocks
Total
investment
Expected
return Weight
Jacobs engineering group 37.20 20 744.06 6.38% 23.63%
Chevron corporation 57.31 18 1031.64 4.59% 32.76%
Ford Motors 7.88 18 141.84 17.42% 4.50%
Raymond James financial Inc 21.67 22 476.78 61.87% 15.14%
American express 35.93 21 754.56 7.91% 23.96%
Total investment 3148.88 100.00%
Table 2: Total investment assessment (in crisis)
Companies Price
Expected
return
Stock
s
Expected
price
Capital
gain
Total value at
end
Total capital
gain
Jacobs engineering group
37.20315
2 6.38% 20 40 2.37 791.51 47
Chevron corporation
57.31322
5 4.59% 18 60 2.63 1079.02 47
Ford Motors 7.88022 17.42% 18 9 1.37 166.56 25
Raymond James financial
Inc
21.67201
6 61.87% 22 35 13.41 771.76 295
American express
35.93121
7 7.91% 21 39 2.84 814.24 60
474
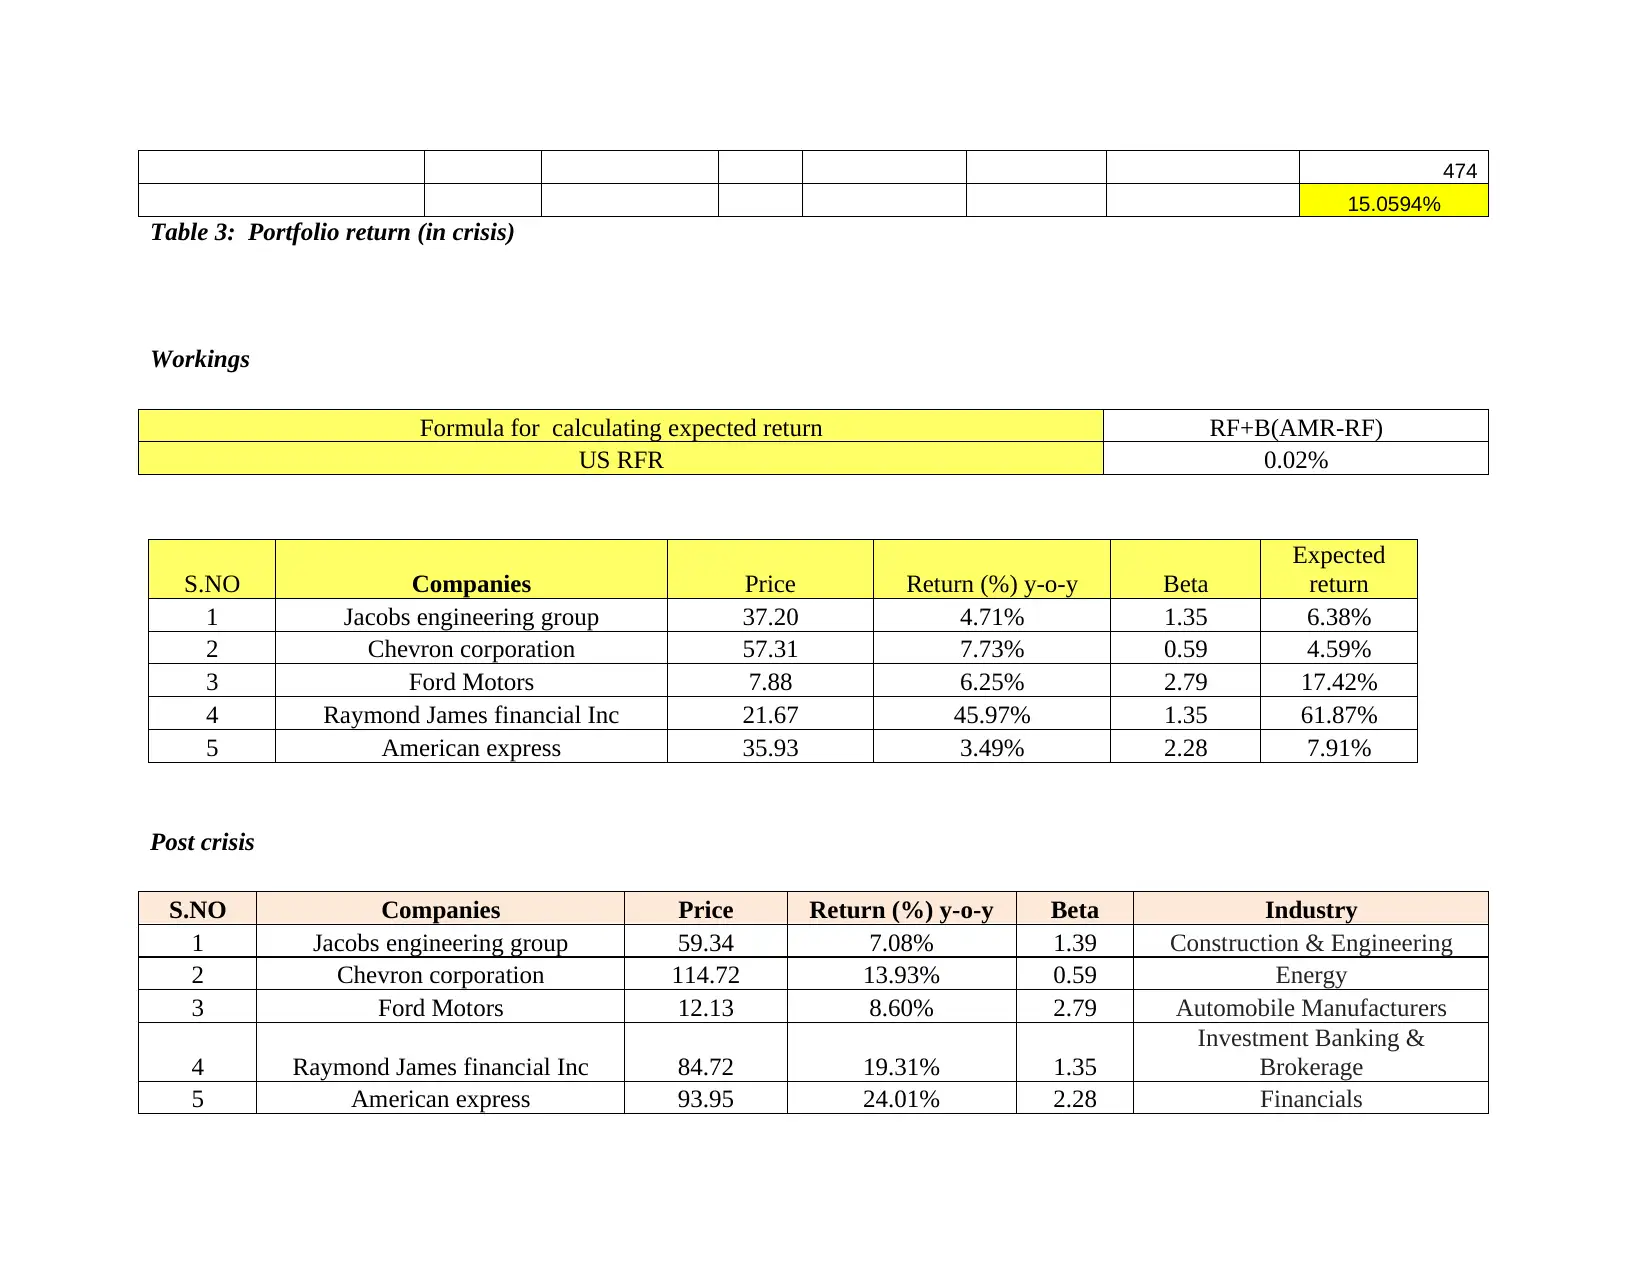
15.0594%
Table 3: Portfolio return (in crisis)
Workings
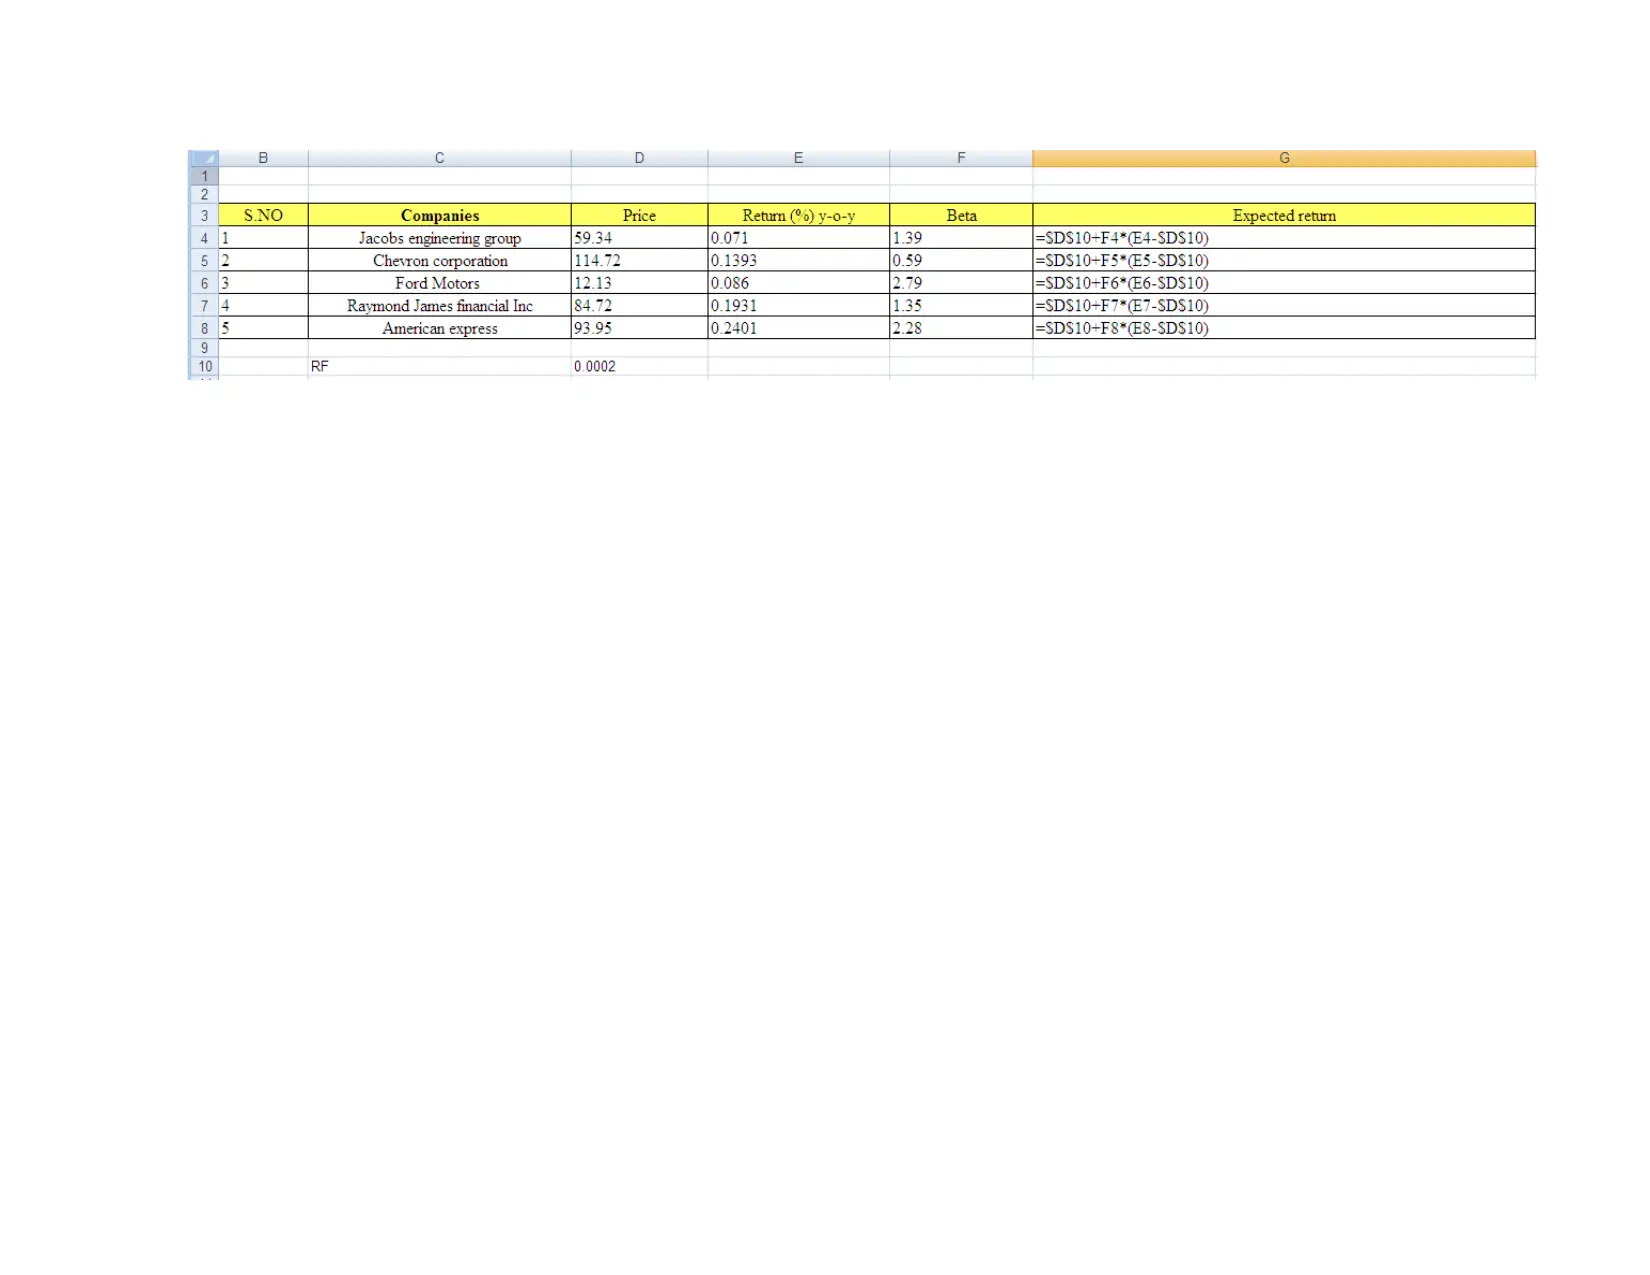
Formula for calculating expected return RF+B(AMR-RF)
US RFR 0.02%
S.NO Companies Price Return (%) y-o-y Beta
Expected
return
1 Jacobs engineering group 37.20 4.71% 1.35 6.38%
2 Chevron corporation 57.31 7.73% 0.59 4.59%
3 Ford Motors 7.88 6.25% 2.79 17.42%
4 Raymond James financial Inc 21.67 45.97% 1.35 61.87%
5 American express 35.93 3.49% 2.28 7.91%
Post crisis
S.NO Companies Price Return (%) y-o-y Beta Industry
1 Jacobs engineering group 59.34 7.08% 1.39 Construction & Engineering
2 Chevron corporation 114.72 13.93% 0.59 Energy
3 Ford Motors 12.13 8.60% 2.79 Automobile Manufacturers
4 Raymond James financial Inc 84.72 19.31% 1.35
Investment Banking &
Brokerage
5 American express 93.95 24.01% 2.28 Financials
15.0594%
Table 3: Portfolio return (in crisis)
Workings
Formula for calculating expected return RF+B(AMR-RF)
US RFR 0.02%
S.NO Companies Price Return (%) y-o-y Beta
Expected
return
1 Jacobs engineering group 37.20 4.71% 1.35 6.38%
2 Chevron corporation 57.31 7.73% 0.59 4.59%
3 Ford Motors 7.88 6.25% 2.79 17.42%
4 Raymond James financial Inc 21.67 45.97% 1.35 61.87%
5 American express 35.93 3.49% 2.28 7.91%
Post crisis
S.NO Companies Price Return (%) y-o-y Beta Industry
1 Jacobs engineering group 59.34 7.08% 1.39 Construction & Engineering
2 Chevron corporation 114.72 13.93% 0.59 Energy
3 Ford Motors 12.13 8.60% 2.79 Automobile Manufacturers
4 Raymond James financial Inc 84.72 19.31% 1.35
Investment Banking &
Brokerage
5 American express 93.95 24.01% 2.28 Financials
Secure Best Marks with AI Grader
Need help grading? Try our AI Grader for instant feedback on your assignments.
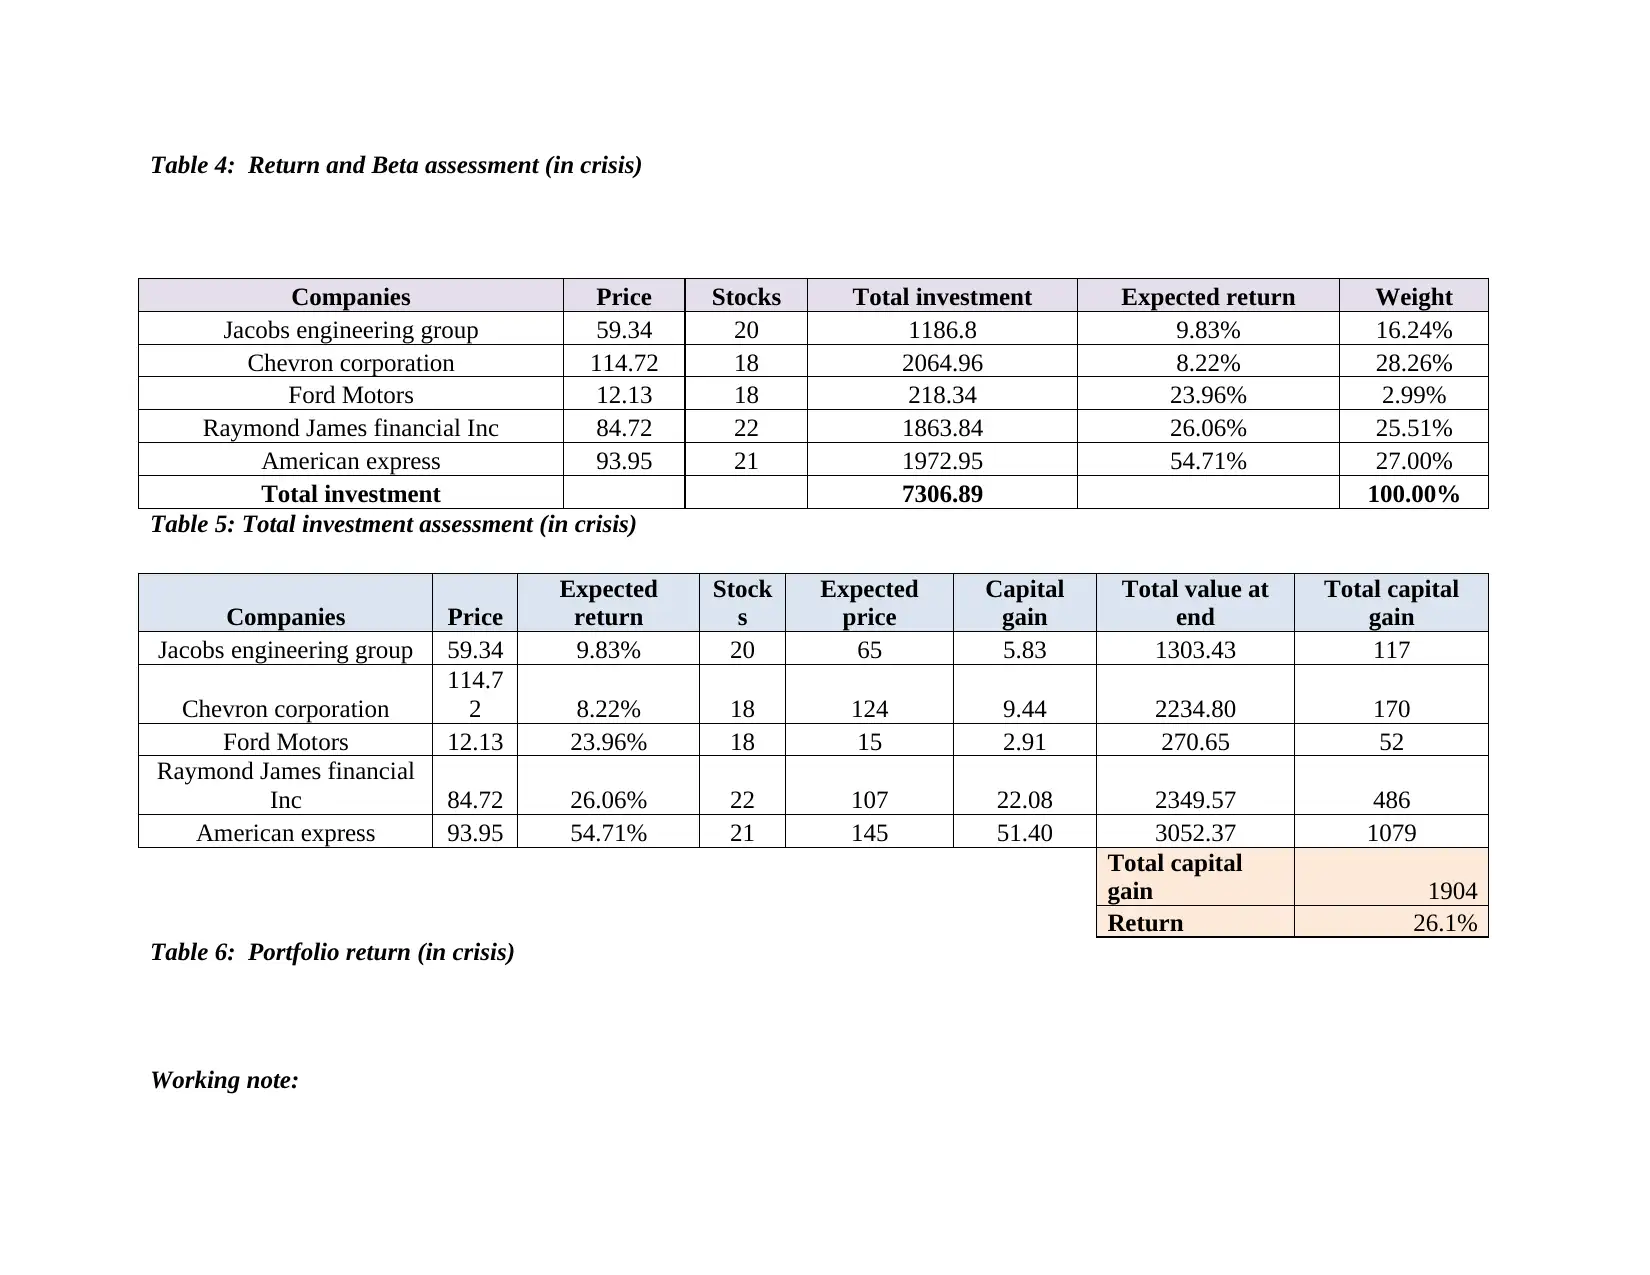
Table 4: Return and Beta assessment (in crisis)
Companies Price Stocks Total investment Expected return Weight
Jacobs engineering group 59.34 20 1186.8 9.83% 16.24%
Chevron corporation 114.72 18 2064.96 8.22% 28.26%
Ford Motors 12.13 18 218.34 23.96% 2.99%
Raymond James financial Inc 84.72 22 1863.84 26.06% 25.51%
American express 93.95 21 1972.95 54.71% 27.00%
Total investment 7306.89 100.00%
Table 5: Total investment assessment (in crisis)
Companies Price
Expected
return
Stock
s
Expected
price
Capital
gain
Total value at
end
Total capital
gain
Jacobs engineering group 59.34 9.83% 20 65 5.83 1303.43 117
Chevron corporation
114.7
2 8.22% 18 124 9.44 2234.80 170
Ford Motors 12.13 23.96% 18 15 2.91 270.65 52
Raymond James financial
Inc 84.72 26.06% 22 107 22.08 2349.57 486
American express 93.95 54.71% 21 145 51.40 3052.37 1079
Total capital
gain 1904
Return 26.1%
Table 6: Portfolio return (in crisis)
Working note:
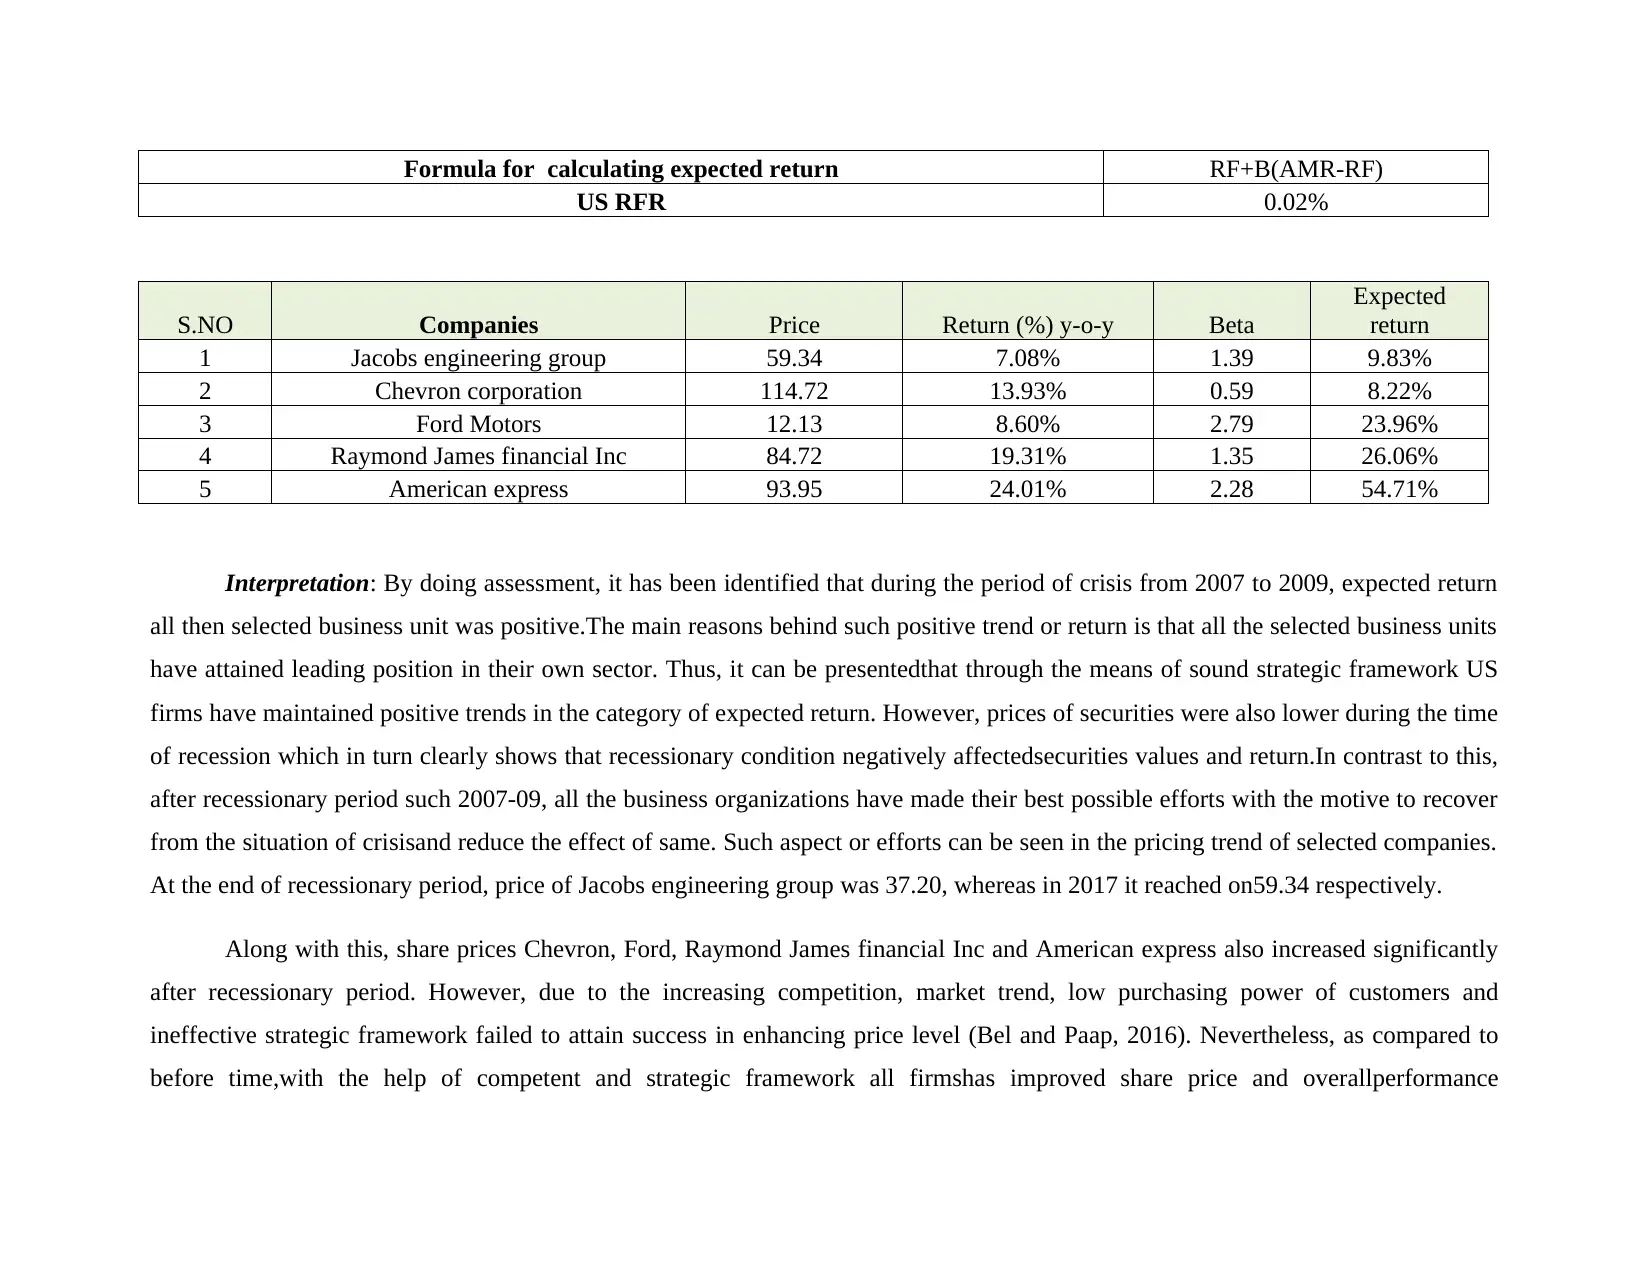
Formula for calculating expected return RF+B(AMR-RF)
US RFR 0.02%
S.NO Companies Price Return (%) y-o-y Beta
Expected
return
1 Jacobs engineering group 59.34 7.08% 1.39 9.83%
2 Chevron corporation 114.72 13.93% 0.59 8.22%
3 Ford Motors 12.13 8.60% 2.79 23.96%
4 Raymond James financial Inc 84.72 19.31% 1.35 26.06%
5 American express 93.95 24.01% 2.28 54.71%
Interpretation: By doing assessment, it has been identified that during the period of crisis from 2007 to 2009, expected return
all then selected business unit was positive.The main reasons behind such positive trend or return is that all the selected business units
have attained leading position in their own sector. Thus, it can be presentedthat through the means of sound strategic framework US
firms have maintained positive trends in the category of expected return. However, prices of securities were also lower during the time
of recession which in turn clearly shows that recessionary condition negatively affectedsecurities values and return.In contrast to this,
after recessionary period such 2007-09, all the business organizations have made their best possible efforts with the motive to recover
from the situation of crisisand reduce the effect of same. Such aspect or efforts can be seen in the pricing trend of selected companies.
At the end of recessionary period, price of Jacobs engineering group was 37.20, whereas in 2017 it reached on59.34 respectively.
Along with this, share prices Chevron, Ford, Raymond James financial Inc and American express also increased significantly
after recessionary period. However, due to the increasing competition, market trend, low purchasing power of customers and
ineffective strategic framework failed to attain success in enhancing price level (Bel and Paap, 2016). Nevertheless, as compared to
before time,with the help of competent and strategic framework all firmshas improved share price and overallperformance
significantly. The above mentioned calculation shows thatat thetime of crisis return of such portfolio was 15.06%. On the other side,
after crisis (from 2010 to 2017) return of such concerned portfolio accounts for 26.1%. The rationale behind such high return of
portfolio, after the period of crisis is that all the companies are performing well is financial market and having sound strategic
framework as well as brand image.Thus, considering the overall evaluation, it can be presented that situation of crisis has significant
impact onfinancial market.
Paraphrase This Document
Need a fresh take? Get an instant paraphrase of this document with our AI Paraphraser
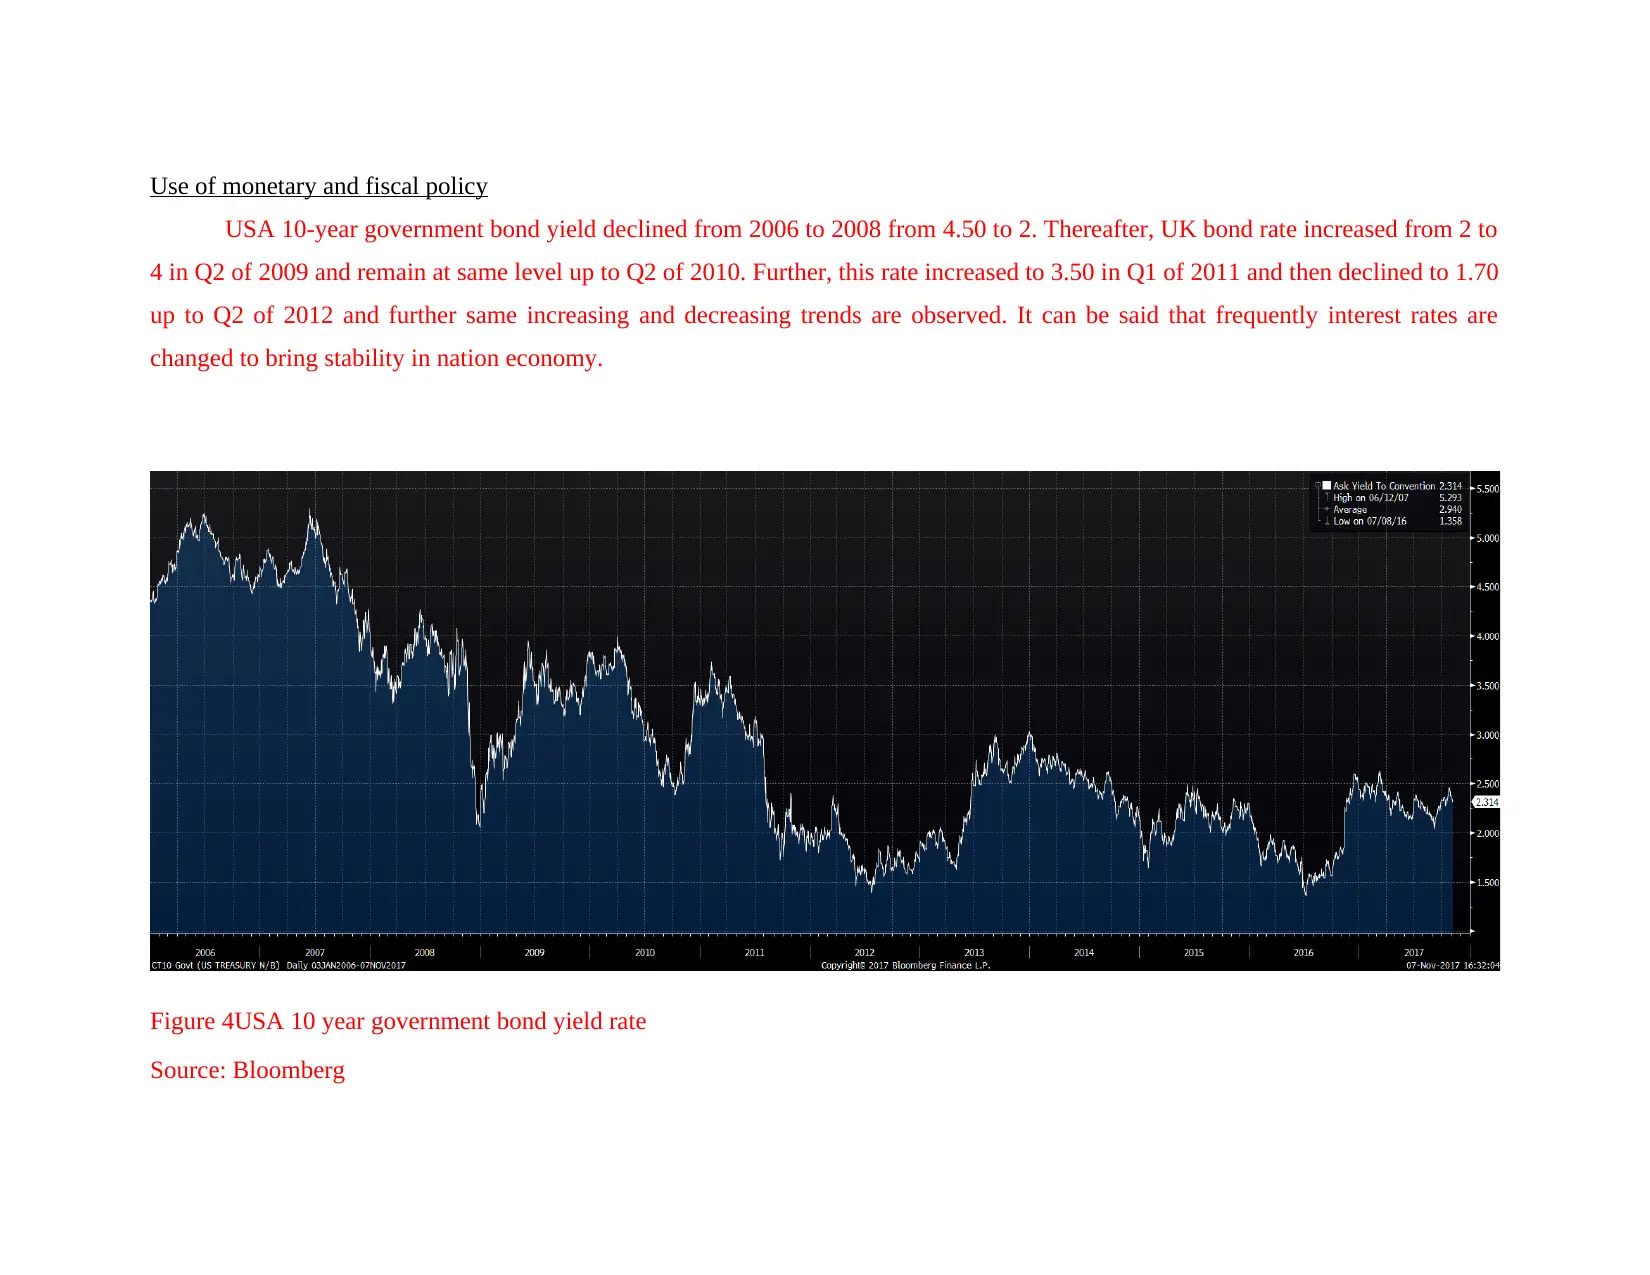
Use of monetary and fiscal policy
USA 10-year government bond yield declined from 2006 to 2008 from 4.50 to 2. Thereafter, UK bond rate increased from 2 to
4 in Q2 of 2009 and remain at same level up to Q2 of 2010. Further, this rate increased to 3.50 in Q1 of 2011 and then declined to 1.70
up to Q2 of 2012 and further same increasing and decreasing trends are observed. It can be said that frequently interest rates are
changed to bring stability in nation economy.
Figure 4USA 10 year government bond yield rate
Source: Bloomberg
Monetary and fiscal policy have due importance for US and it bring mentioned nation on growth path. As it can be observed
that monetary policy main components are interest rate change. Money supply has heavy impact on the US economy and it is interest
rate that brings change in money supply and brings balance in it. Excessive or decline in money supply lead to turmoil in economic
condition of the nation and monetary policy is the tool that help a nation a lot to solve specific problem. US central bank monitor
money supply and economic condition of the nation time to time and accordingly make changes in its interest rate structures. In case
money supply is less in the economy then in order to introduce fresh money in the economy interest rates are reduced. By doing so
more and more firms are motivated to take bank loan at cheaper rate so that firms can be motivated to boost economic activity in the
nation and more and more employment can be provided to the people (Ahmad, Bordignon and Brosio, 2016). US government
consistently make changes in its interest rate and by doing so bring economy back on track. Currently, however GDP growth rate of
the nation is low but inflation is in control. Gradually, interest rates will start showing their positive impact and nation economy
growth will accelerate.
Fiscal policy play a more important role in bringing economy back on track. Under fiscal policy nation government make
heavy expenditure on its general public and under quantitative easing program more and more benefits were provided to the people. In
terms of education and medical bill expenditure huge support is given to the people. Hence, fiscal policy a lot to the government in
giving lots of support to the people (Mbanga and Darrat, 2016). It can be observed that by using fiscal policy expenditure from people
side is increased. Due to increase in expenditure or increase in demand firms start earning good amount of profit in their business.
Hence, this leads to increase in employment in the nation. Same thing is done by the US government and by supporting people boost
is given to demand in the market and this strategy to some extent bring economy on track. Hence, there is great use of monetary and
fiscal policy for the nation.
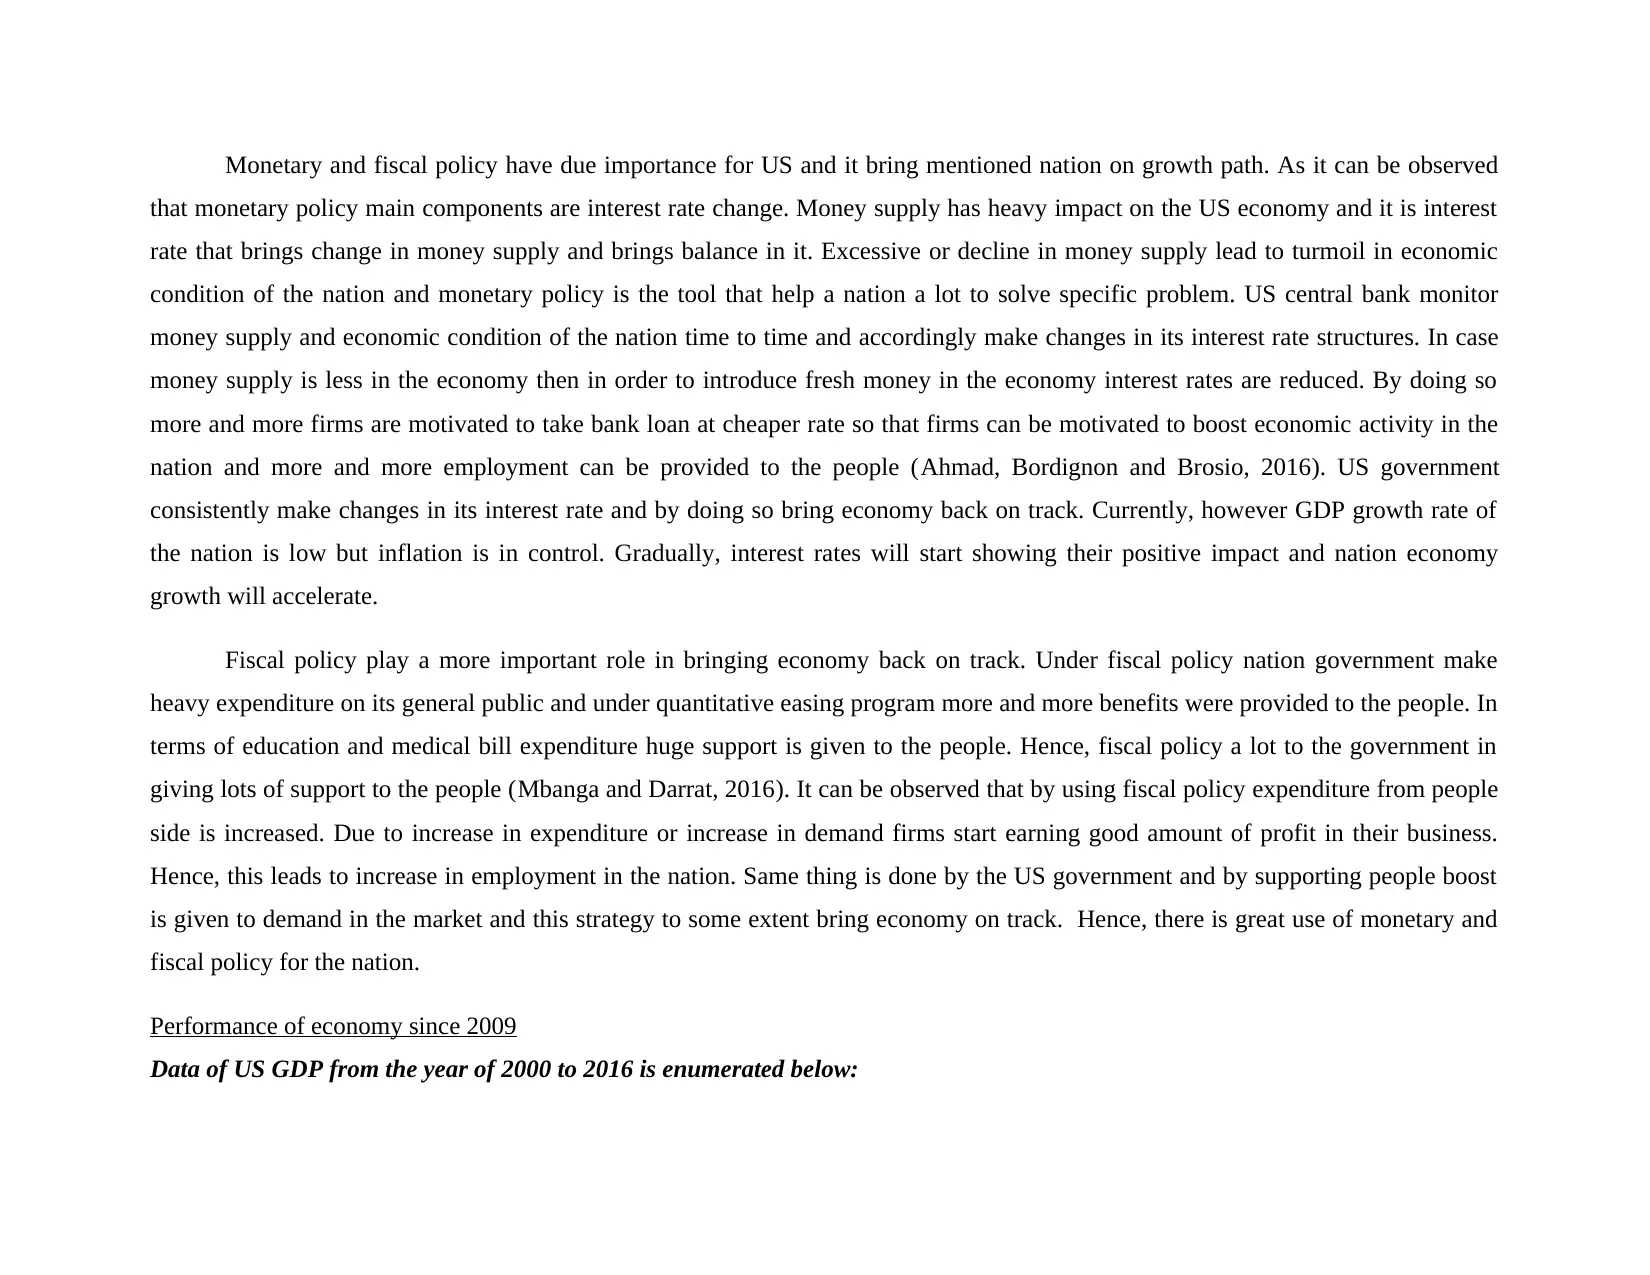
Performance of economy since 2009
Data of US GDP from the year of 2000 to 2016 is enumerated below:
that monetary policy main components are interest rate change. Money supply has heavy impact on the US economy and it is interest
rate that brings change in money supply and brings balance in it. Excessive or decline in money supply lead to turmoil in economic
condition of the nation and monetary policy is the tool that help a nation a lot to solve specific problem. US central bank monitor
money supply and economic condition of the nation time to time and accordingly make changes in its interest rate structures. In case
money supply is less in the economy then in order to introduce fresh money in the economy interest rates are reduced. By doing so
more and more firms are motivated to take bank loan at cheaper rate so that firms can be motivated to boost economic activity in the
nation and more and more employment can be provided to the people (Ahmad, Bordignon and Brosio, 2016). US government
consistently make changes in its interest rate and by doing so bring economy back on track. Currently, however GDP growth rate of
the nation is low but inflation is in control. Gradually, interest rates will start showing their positive impact and nation economy
growth will accelerate.
Fiscal policy play a more important role in bringing economy back on track. Under fiscal policy nation government make
heavy expenditure on its general public and under quantitative easing program more and more benefits were provided to the people. In
terms of education and medical bill expenditure huge support is given to the people. Hence, fiscal policy a lot to the government in
giving lots of support to the people (Mbanga and Darrat, 2016). It can be observed that by using fiscal policy expenditure from people
side is increased. Due to increase in expenditure or increase in demand firms start earning good amount of profit in their business.
Hence, this leads to increase in employment in the nation. Same thing is done by the US government and by supporting people boost
is given to demand in the market and this strategy to some extent bring economy on track. Hence, there is great use of monetary and
fiscal policy for the nation.
Performance of economy since 2009
Data of US GDP from the year of 2000 to 2016 is enumerated below:

Date
Last
Price
Last
Price
Secure Best Marks with AI Grader
Need help grading? Try our AI Grader for instant feedback on your assignments.

12/29/200
0 4.1
12/31/200
1 1
12/31/200
2 1.8
12/31/200
3 2.8
12/31/200
4 3.8
12/30/200
5 3.3
12/29/200
6 2.7
12/31/200
7 1.8
12/31/200
8 -0.3
12/31/200
9 -2.8
12/31/201
0 2.5
12/30/201
1 1.6
12/31/201
2 2.2
12/31/201
3 1.7
12/31/201
4 2.6
12/31/201
5 2.9
12/31/201 1.5
0 4.1
12/31/200
1 1
12/31/200
2 1.8
12/31/200
3 2.8
12/31/200
4 3.8
12/30/200
5 3.3
12/29/200
6 2.7
12/31/200
7 1.8
12/31/200
8 -0.3
12/31/200
9 -2.8
12/31/201
0 2.5
12/30/201
1 1.6
12/31/201
2 2.2
12/31/201
3 1.7
12/31/201
4 2.6
12/31/201
5 2.9
12/31/201 1.5
6
3/1/2007
5/1/2007
7/1/2007
9/1/2007
11/1/2007
1/1/2008
3/1/2008
5/1/2008
7/1/2008
9/1/2008
11/1/2008
1/1/2009
3/1/2009
5/1/2009
7/1/2009
9/1/2009
11/1/2009
97
98
99
100
101
102
103
104
105
GDP Evolution
3/1/2007
5/1/2007
7/1/2007
9/1/2007
11/1/2007
1/1/2008
3/1/2008
5/1/2008
7/1/2008
9/1/2008
11/1/2008
1/1/2009
3/1/2009
5/1/2009
7/1/2009
9/1/2009
11/1/2009
97
98
99
100
101
102
103
104
105
GDP Evolution
12/1/2009
3/1/2010
6/1/2010
9/1/2010
12/1/2010
3/1/2011
6/1/2011
9/1/2011
12/1/2011
3/1/2012
6/1/2012
9/1/2012
12/1/2012
3/1/2013
6/1/2013
9/1/2013
12/1/2013
3/1/2014
6/1/2014
9/1/2014
12/1/2014
3/1/2015
6/1/2015
9/1/2015
12/1/2015
3/1/2016
6/1/2016
9/1/2016
12/1/2016
3/1/2017
6/1/2017
9/1/2017
80
90
100
110
120
130
140
GDP Post Crisis Evolution
Paraphrase This Document
Need a fresh take? Get an instant paraphrase of this document with our AI Paraphraser
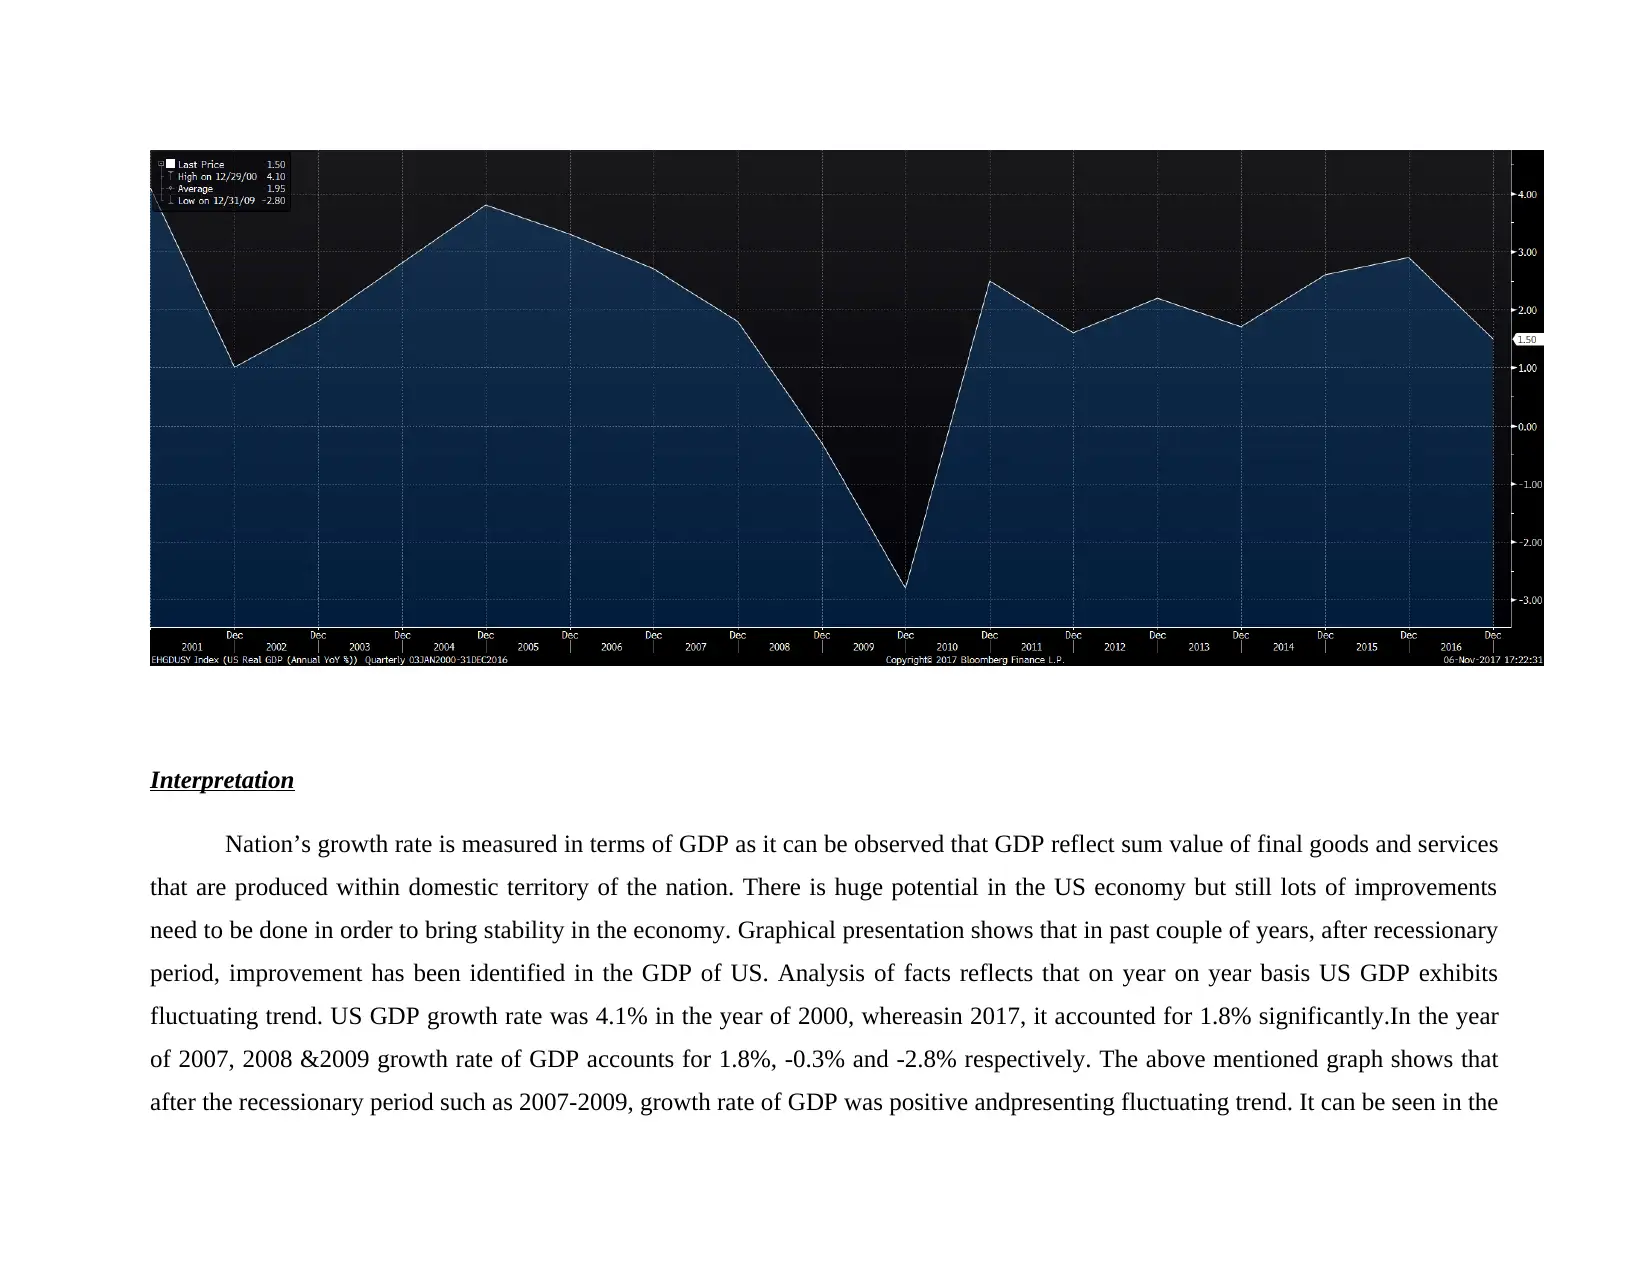
Interpretation
Nation’s growth rate is measured in terms of GDP as it can be observed that GDP reflect sum value of final goods and services
that are produced within domestic territory of the nation. There is huge potential in the US economy but still lots of improvements
need to be done in order to bring stability in the economy. Graphical presentation shows that in past couple of years, after recessionary
period, improvement has been identified in the GDP of US. Analysis of facts reflects that on year on year basis US GDP exhibits
fluctuating trend. US GDP growth rate was 4.1% in the year of 2000, whereasin 2017, it accounted for 1.8% significantly.In the year
of 2007, 2008 &2009 growth rate of GDP accounts for 1.8%, -0.3% and -2.8% respectively. The above mentioned graph shows that
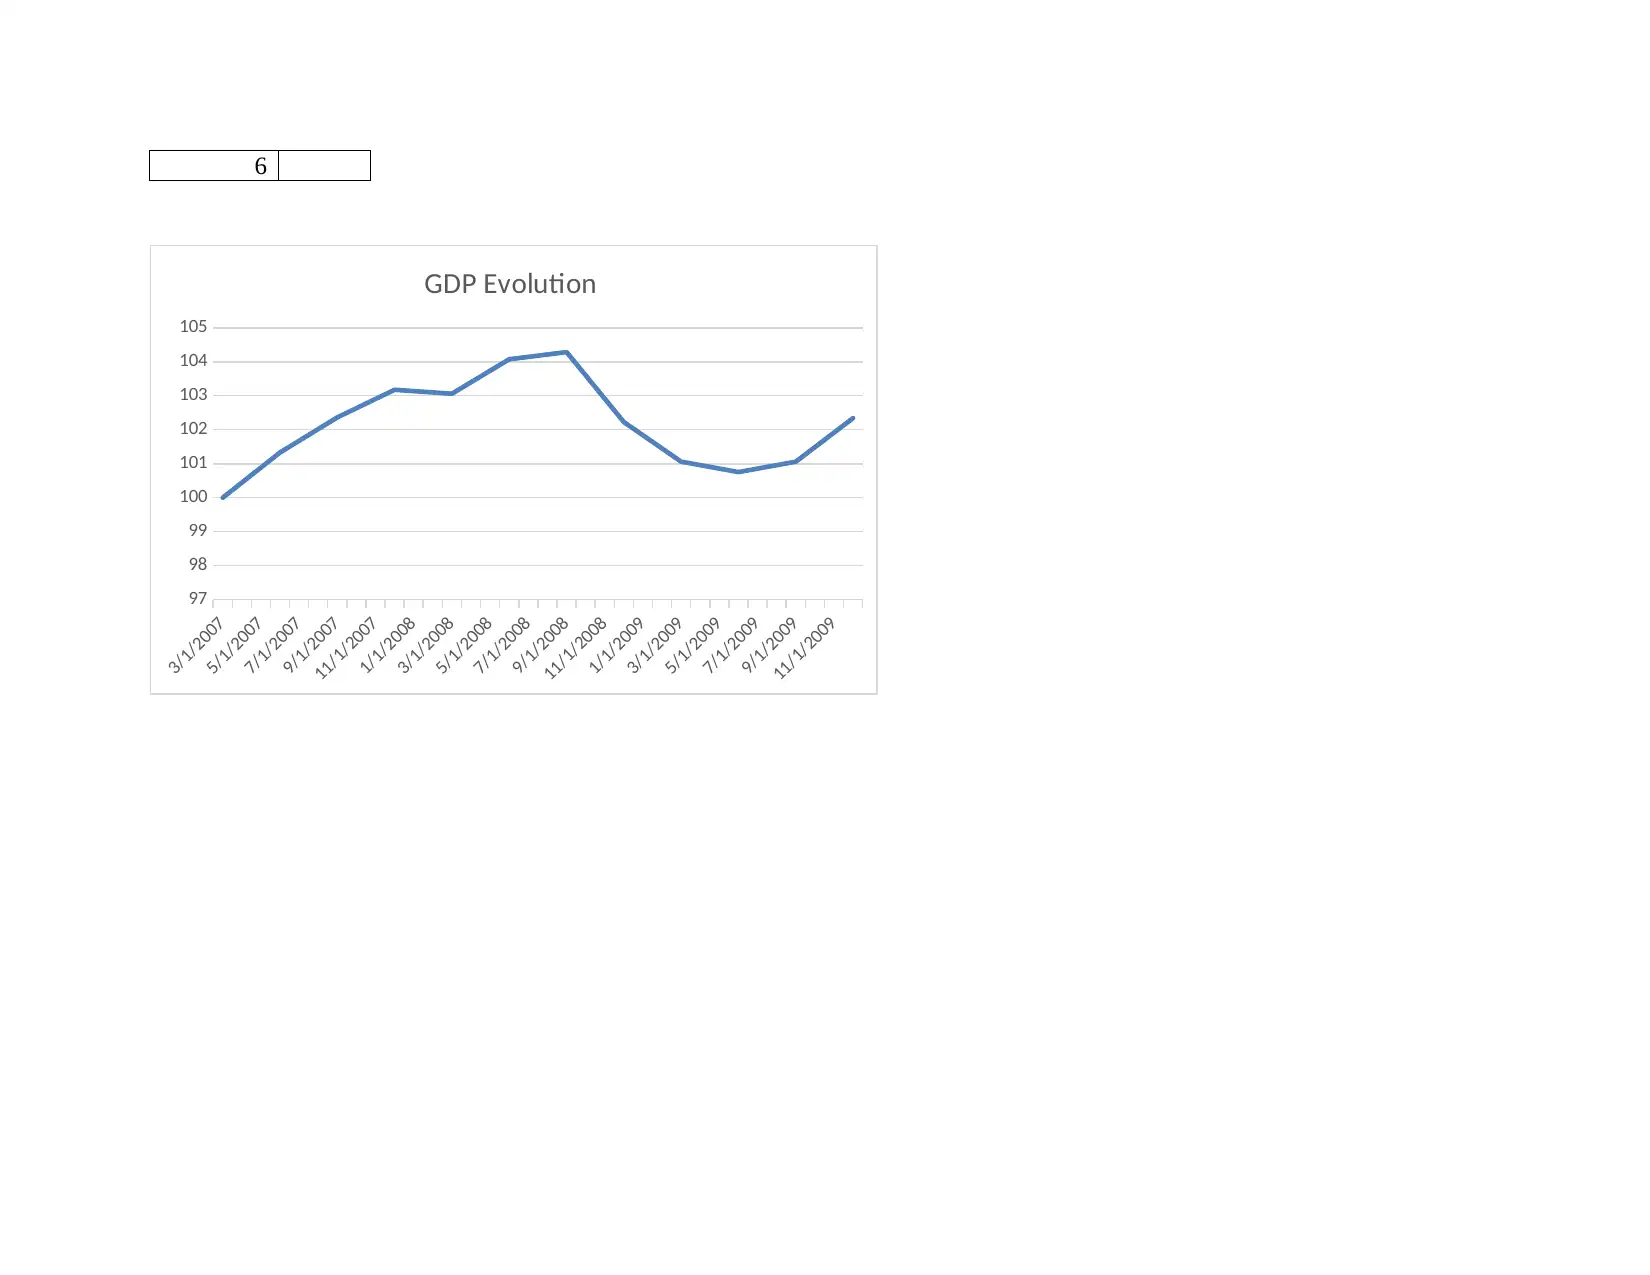
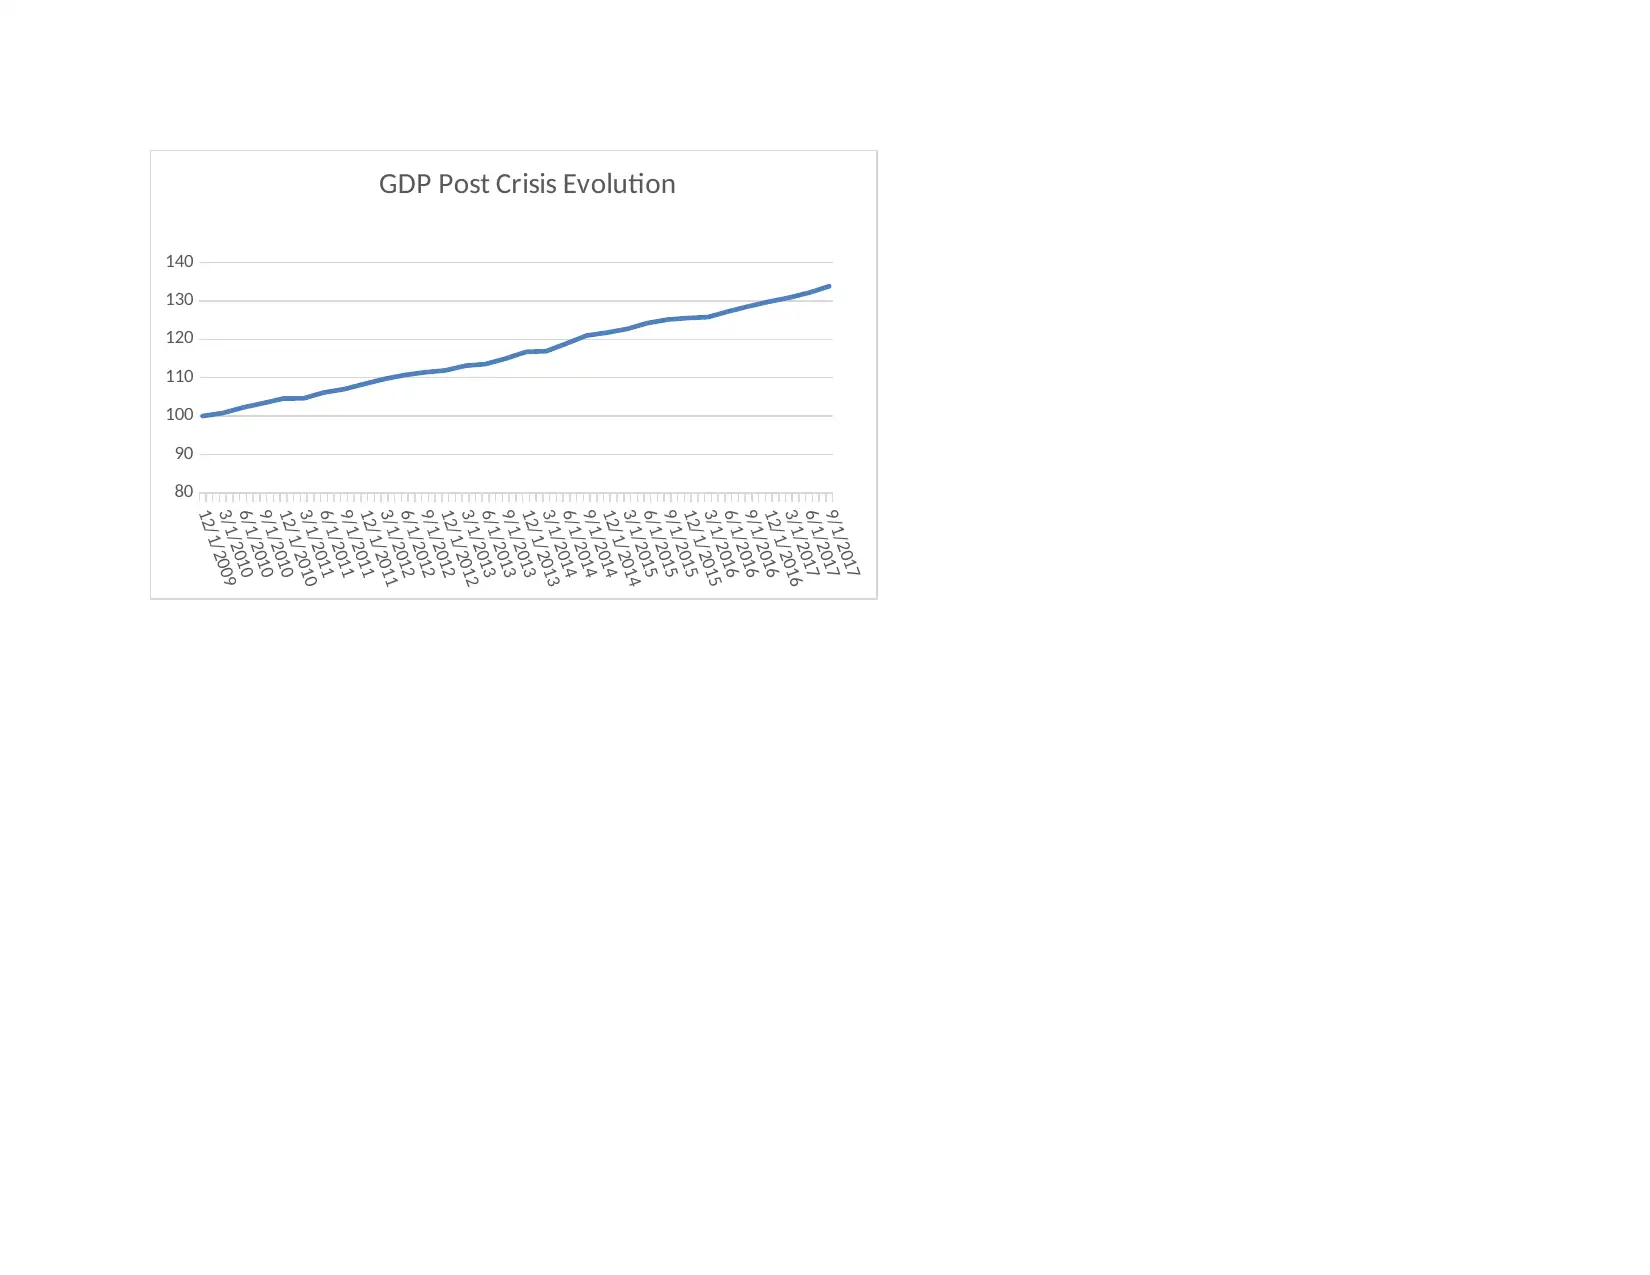
after the recessionary period such as 2007-2009, growth rate of GDP was positive andpresenting fluctuating trend. It can be seen in the
Nation’s growth rate is measured in terms of GDP as it can be observed that GDP reflect sum value of final goods and services
that are produced within domestic territory of the nation. There is huge potential in the US economy but still lots of improvements
need to be done in order to bring stability in the economy. Graphical presentation shows that in past couple of years, after recessionary
period, improvement has been identified in the GDP of US. Analysis of facts reflects that on year on year basis US GDP exhibits
fluctuating trend. US GDP growth rate was 4.1% in the year of 2000, whereasin 2017, it accounted for 1.8% significantly.In the year
of 2007, 2008 &2009 growth rate of GDP accounts for 1.8%, -0.3% and -2.8% respectively. The above mentioned graph shows that
after the recessionary period such as 2007-2009, growth rate of GDP was positive andpresenting fluctuating trend. It can be seen in the
graphical presentation that in 2010GDP growth rate was 2.5%, whereas in 2016 it accounted for 1.5%. From assessment, it has been
identifiedthat several initiatives have undertakenby US authorities with the motive to enhance purchasing power of customers,
reducing unemployment level and ensuring high level of growth through enhancing the level of public expenditure. As compared to
recessionary period, GDP growth rate is goodbut for stabilizing and enhancing the same US authorities are required to undertake
competent framework.
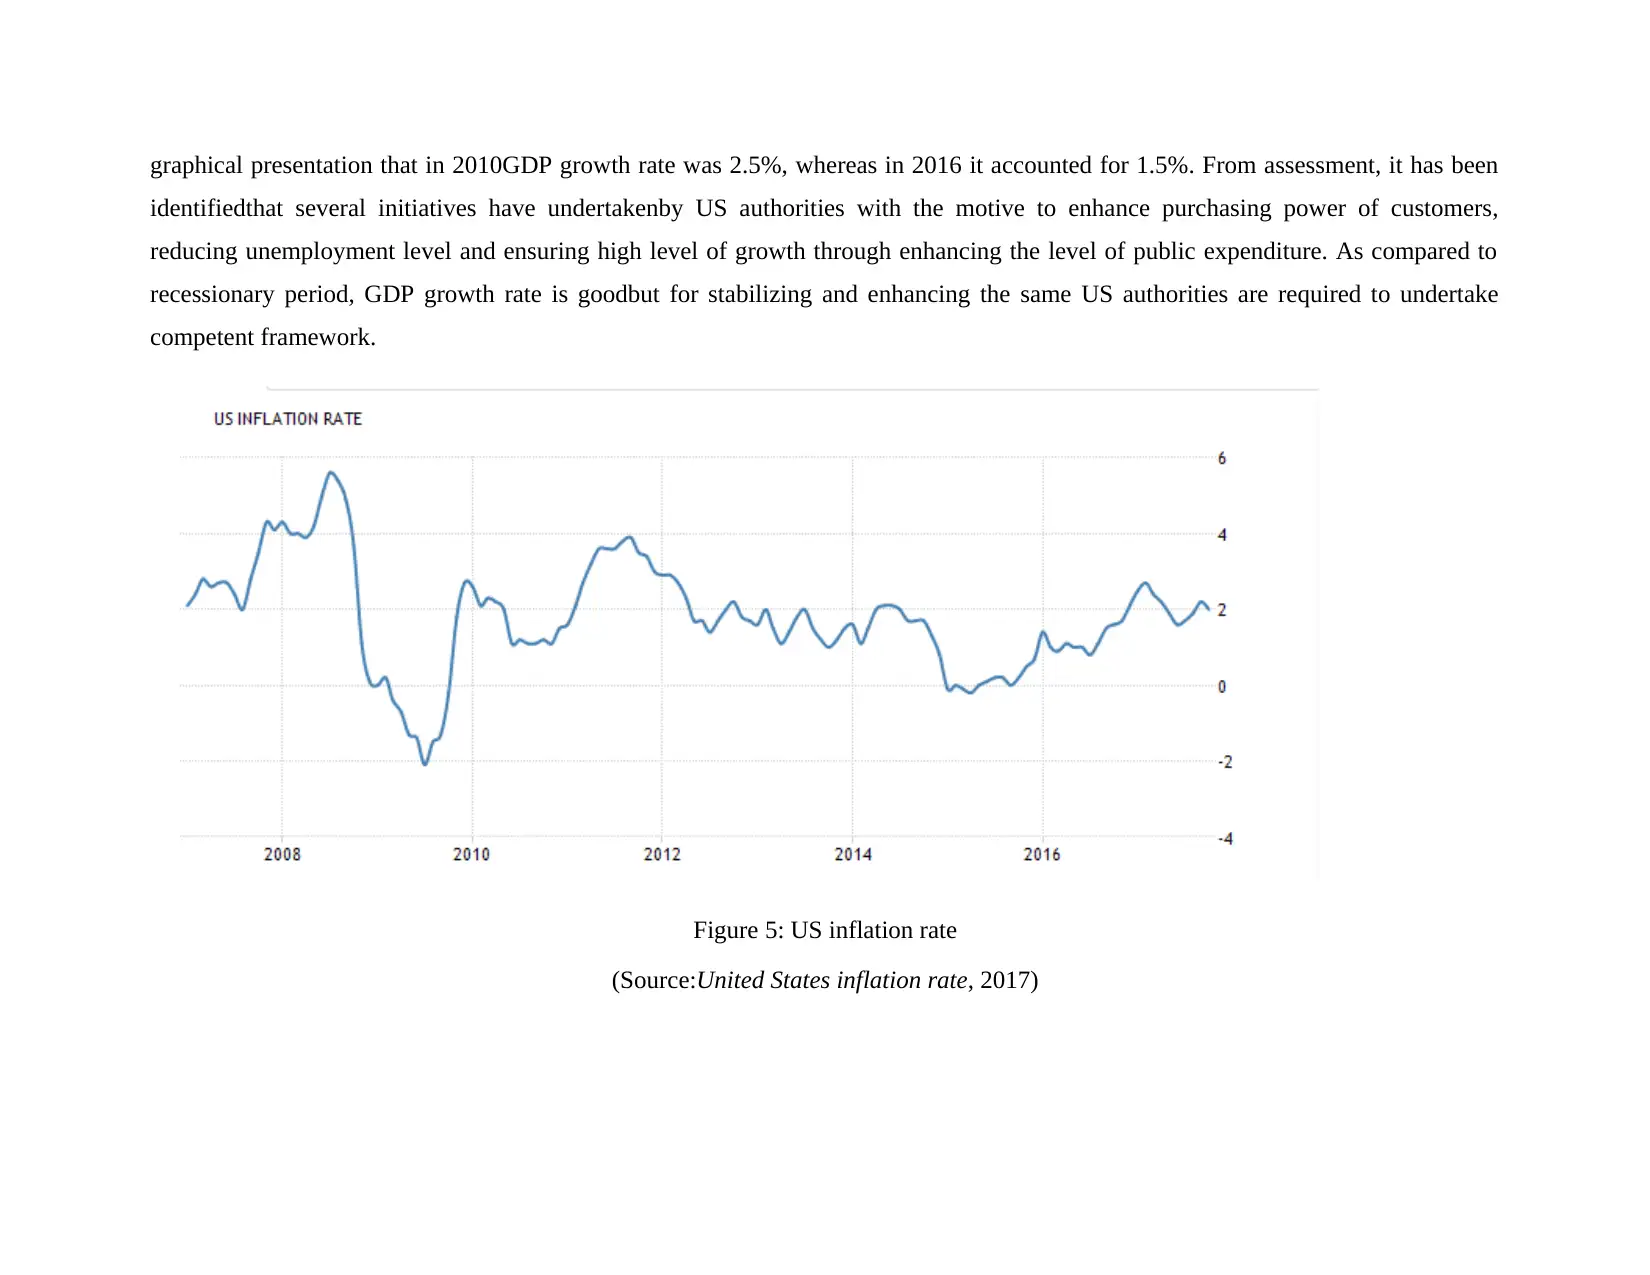
Figure 5: US inflation rate
(Source:United States inflation rate, 2017)
identifiedthat several initiatives have undertakenby US authorities with the motive to enhance purchasing power of customers,
reducing unemployment level and ensuring high level of growth through enhancing the level of public expenditure. As compared to
recessionary period, GDP growth rate is goodbut for stabilizing and enhancing the same US authorities are required to undertake
competent framework.
Figure 5: US inflation rate
(Source:United States inflation rate, 2017)
Inflation rate of US also keeps on fluctuating consistently and now it is on growth track which is not good. If inflation rate in
future will remain uncontrolled then it may create problem for nation. It can be seenthat since 2009 most of years US economy give
elegant performance as most of times inflation rate remain in control (Plakandaras and et.al., 2017).
Unemployment rate is declined from 2003 to 2007 but thereafter due to recession suddenly increase observed in
unemployment rate from 4% to 10% 2009. Government consistently take steps to improve economic condition of the nation and
providing support to the business firms. Hence, it can be said that measures taken by USA government prove effective (Nautz and
Strohsal, 2015).
Secure Best Marks with AI Grader
Need help grading? Try our AI Grader for instant feedback on your assignments.
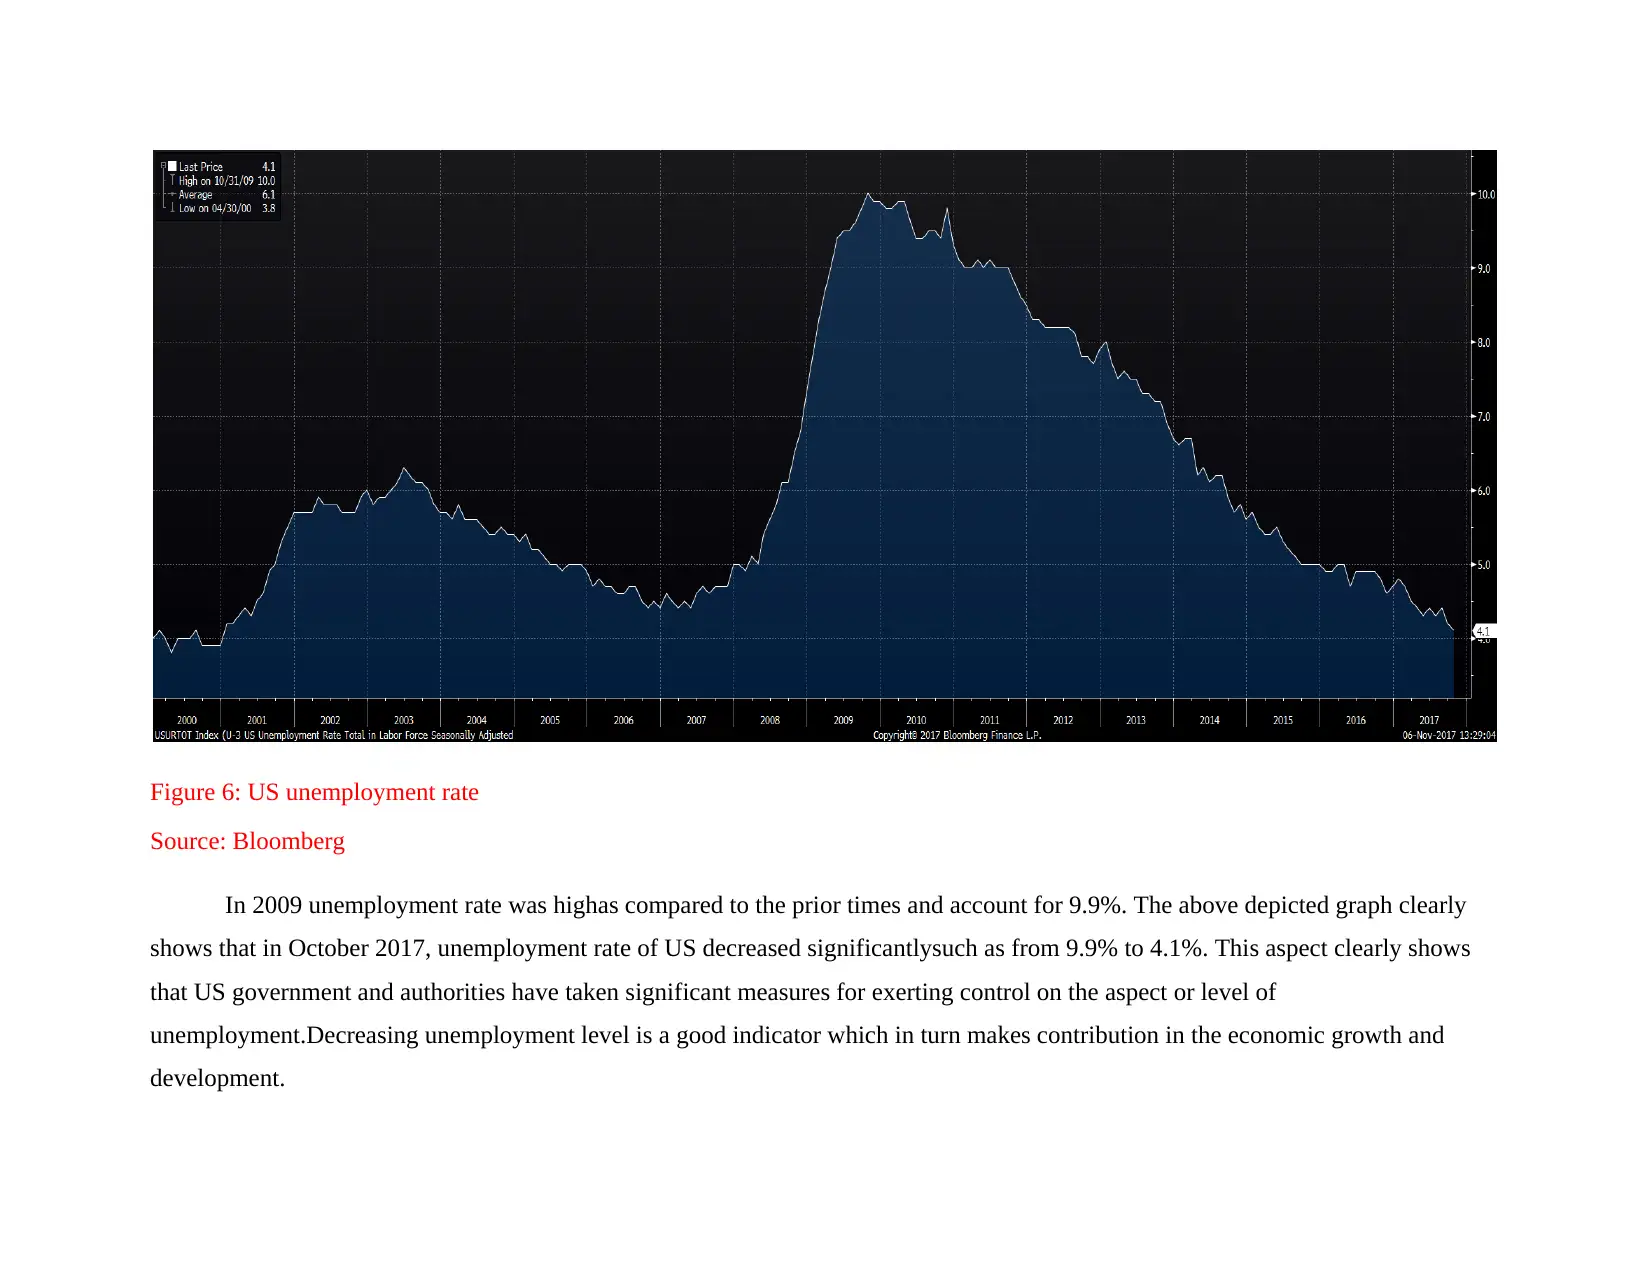
Figure 6: US unemployment rate
Source: Bloomberg
In 2009 unemployment rate was highas compared to the prior times and account for 9.9%. The above depicted graph clearly
shows that in October 2017, unemployment rate of US decreased significantlysuch as from 9.9% to 4.1%. This aspect clearly shows
that US government and authorities have taken significant measures for exerting control on the aspect or level of
unemployment.Decreasing unemployment level is a good indicator which in turn makes contribution in the economic growth and
development.
CONCLUSION
On the basis of above discussion it is concluded that US economic conditions are not stable and before recession also its GDP
increase or decrease at fast rate. In current time period also same trend is observed and GDP rate is also very low which reflect that
more efforts need to be made to bring stability in nation economy. Monetary and fiscal policy need to be improved and money supply
need to be balanced and main target must be to develop business friendly environment in the nation. By doing so economic growth
rate can be accelerated in the business.
REFERENCES
Books and Journals
Ahmad, E., Bordignon, M. and Brosio, G. eds., 2016. Multi-level Finance and the Euro Crisis: Causes and Effects. Edward Elgar
Publishing.
Anginer, D., Cerutti, E. and Peria, M. S. M., 2017. Foreign bank subsidiaries' default risk during the global crisis: What factors help
insulate affiliates from their parents?. Journal of Financial Intermediation. 29. pp.19-31.
Anginer, D., Cerutti, M. E. M. and Peria, M. M. S. M., 2016. Foreign Bank Subsidiaries’ Default Risk during the Global Crisis: What
Factors Help Insulate Affiliates from their Parents?. International Monetary Fund.
Bel, K. and Paap, R., 2016. Modeling the impact of forecast-based regime switches on US inflation. International Journal of
Forecasting, 32(4), pp.1306-1316.
Blau, F.D., Ferber, M.A. and Winkler, A.E., 2013. The economics of women, men and work. Pearson Higher Ed.
Kavada, A., 2017. Social Movements and the Global Crisis: Organising Communication for Change. Westminster Papers in
Communication and Culture. 12(1).
Mbanga, C. L. and Darrat, A. F., 2016. Fiscal policy and the US stock market. Review of Quantitative Finance and Accounting. 47(4).
pp.987-1002.
Nautz, D. and Strohsal, T., 2015. Are US inflation expectations re-anchored?. Economics Letters. 127. pp.6-9.
Paraphrase This Document
Need a fresh take? Get an instant paraphrase of this document with our AI Paraphraser
Patel, K. K., 2016. A GLOBAL CRISIS. Princeton University Press.
Plakandaras, V. and et.al., 2017. The Informational Content of the Term Spread in Forecasting the US Inflation Rate: A Nonlinear
Approach. Journal of Forecasting. 36(2). pp.109-121.
Richardson, K., 2016. Attracting and retaining foreign highly skilled staff in times of global crisis: a case study of Vancouver, British
Columbia's biotechnology sector. Population, Space and Place. 22(5). pp.428-440.
Schiek, D., 2016. The EU Economic and Social Model in the Global Crisis: Interdisciplinary Perspectives. Routledge.
Schumacher, E.F., 2011. Small is beautiful: A study of economics as if people mattered. Random House.
Stiles, E. E., 2016. Islam Is a Foreign Country: American Muslims and the Global Crisis of Authority by Zareena Grewal. New York:
New York University Press, 2013. 409 pp.
Online
25 Major Factors That Caused or Contributed to the Financial Crisis. 2017. [Online]. Available through:
<https://www.fool.com/investing/general/2015/02/28/25-major-factors-that-caused-or-contributed-to-the.aspx>.
Financial crisis & recessions. 2017. [Online]. Available through: <http://positivemoney.org/issues/recessions-crisis/>.
United statesinflation rate, 2017. [Online]. Available through:<https://ycharts.com/indicators/us_inflation_rate>.
APPENDIX
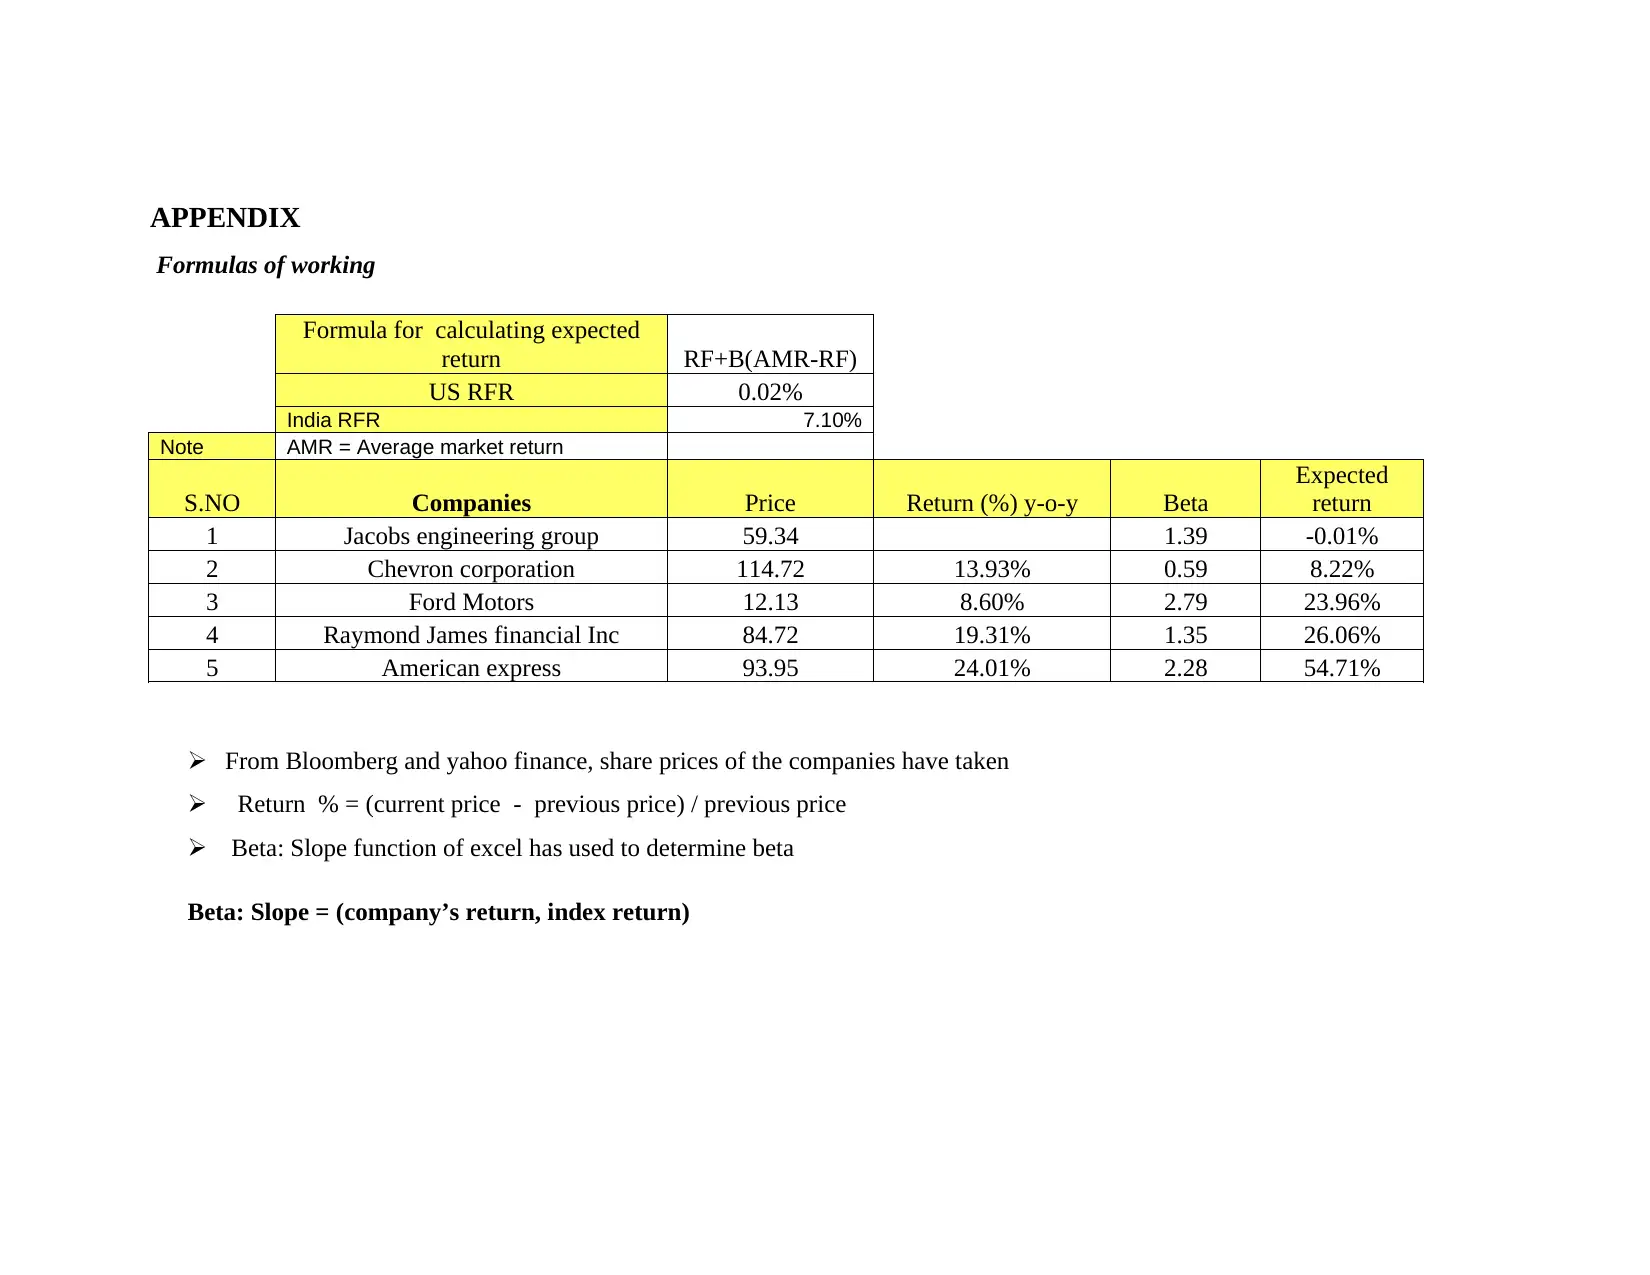
Formulas of working
Formula for calculating expected
return RF+B(AMR-RF)
US RFR 0.02%
India RFR 7.10%
Note AMR = Average market return
S.NO Companies Price Return (%) y-o-y Beta
Expected
return
1 Jacobs engineering group 59.34 1.39 -0.01%
2 Chevron corporation 114.72 13.93% 0.59 8.22%
3 Ford Motors 12.13 8.60% 2.79 23.96%
4 Raymond James financial Inc 84.72 19.31% 1.35 26.06%
5 American express 93.95 24.01% 2.28 54.71%
From Bloomberg and yahoo finance, share prices of the companies have taken
Return % = (current price - previous price) / previous price
Beta: Slope function of excel has used to determine beta
Beta: Slope = (company’s return, index return)
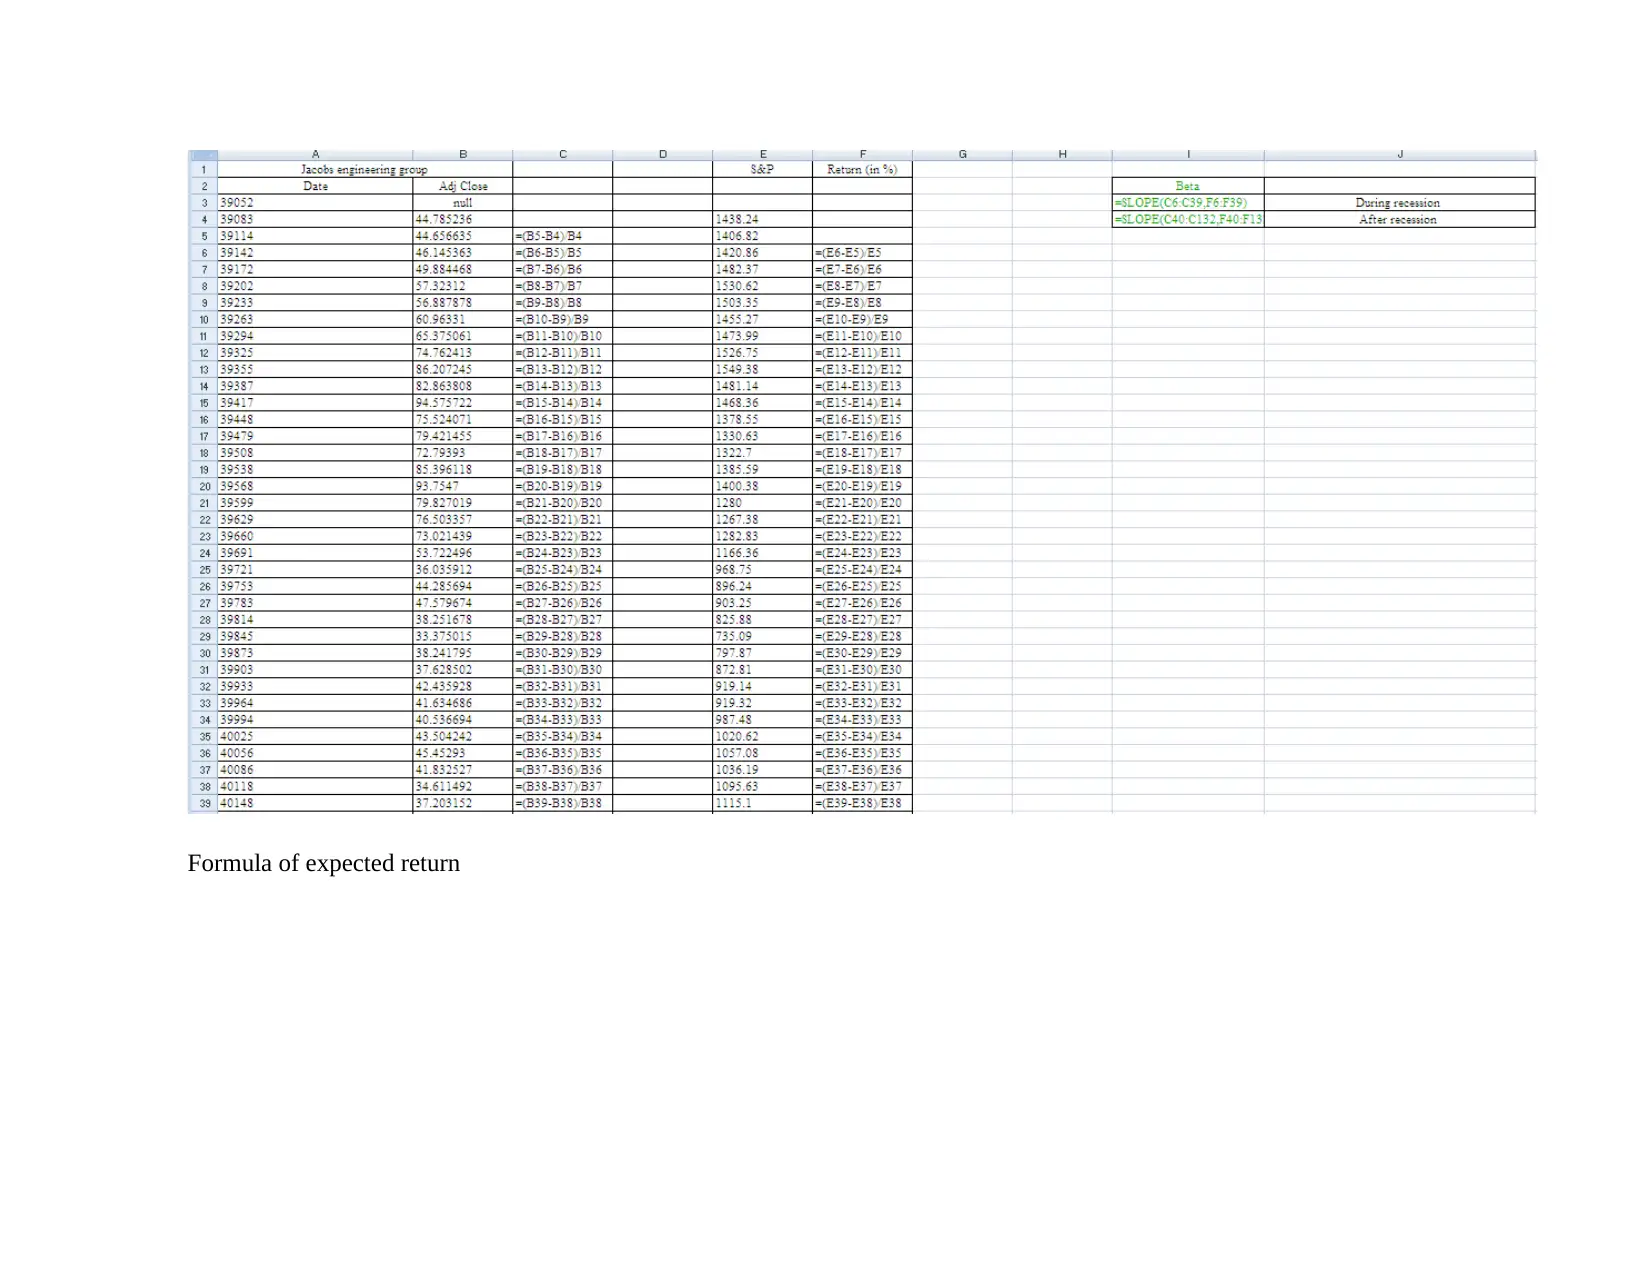
Formula of expected return
Secure Best Marks with AI Grader
Need help grading? Try our AI Grader for instant feedback on your assignments.
1 out of 29
Related Documents


Your All-in-One AI-Powered Toolkit for Academic Success.
+13062052269
info@desklib.com
Available 24*7 on WhatsApp / Email
![[object Object]](/_next/static/media/star-bottom.7253800d.svg)
Unlock your academic potential
© 2024 | Zucol Services PVT LTD | All rights reserved.