EGH404: Research in Engineering Practice - Assessment 2b Solution
VerifiedAdded on 2023/06/04
|25
|3850
|232
Homework Assignment
AI Summary
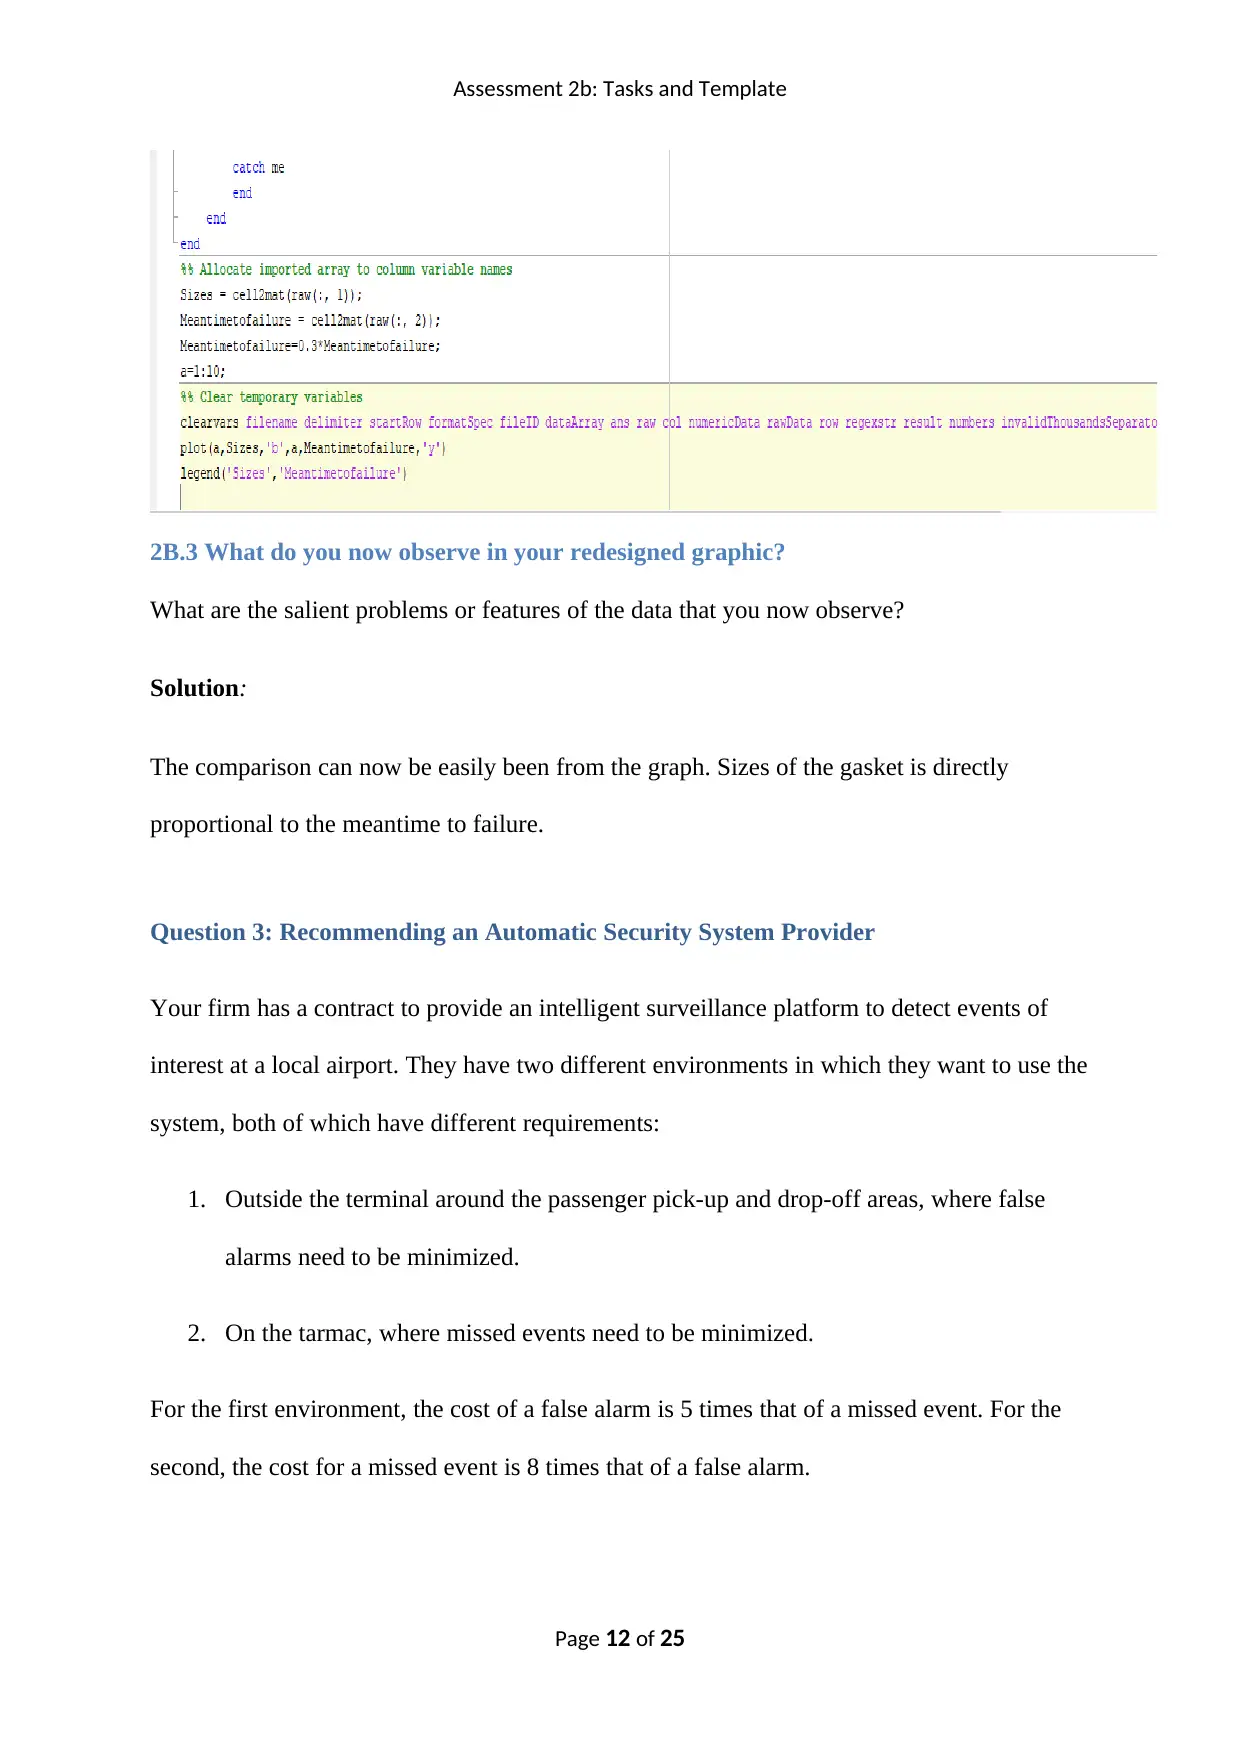
This document provides solutions to Assessment 2b for the course EGH404 Research in Engineering Practice. The assessment includes questions related to conditional probabilities in the context of border control systems using iris recognition, redesigning graphics for data visualization, and recommending an automatic security system provider based on ROC curve analysis. The solutions involve calculations using Bayes' rule, identification of flaws in data visualization, and performance assessment of security systems using metrics such as sensitivity, specificity, and AUC. Matlab code is provided to support the analysis and recommendations. Desklib offers this document along with a wealth of study resources including past papers and solved assignments to aid students in their academic pursuits.


1 out of 25
Related Documents


![Community Development Theory Assessment - [University Name]](/_next/image/?url=https%3A%2F%2Fdesklib.com%2Fmedia%2Fimages%2Fzf%2F1cd20c69ff594ecfb0cc0fa63f45c08a.jpg&w=256&q=75)


Your All-in-One AI-Powered Toolkit for Academic Success.
+13062052269
info@desklib.com
Available 24*7 on WhatsApp / Email
![[object Object]](/_next/static/media/star-bottom.7253800d.svg)
Copyright © 2020–2026 A2Z Services. All Rights Reserved. Developed and managed by ZUCOL.