Comprehensive Stock Market Analysis and Investment Strategies

Verified

Added on  2023/01/16

|7
|876
|87
Report
AI Summary
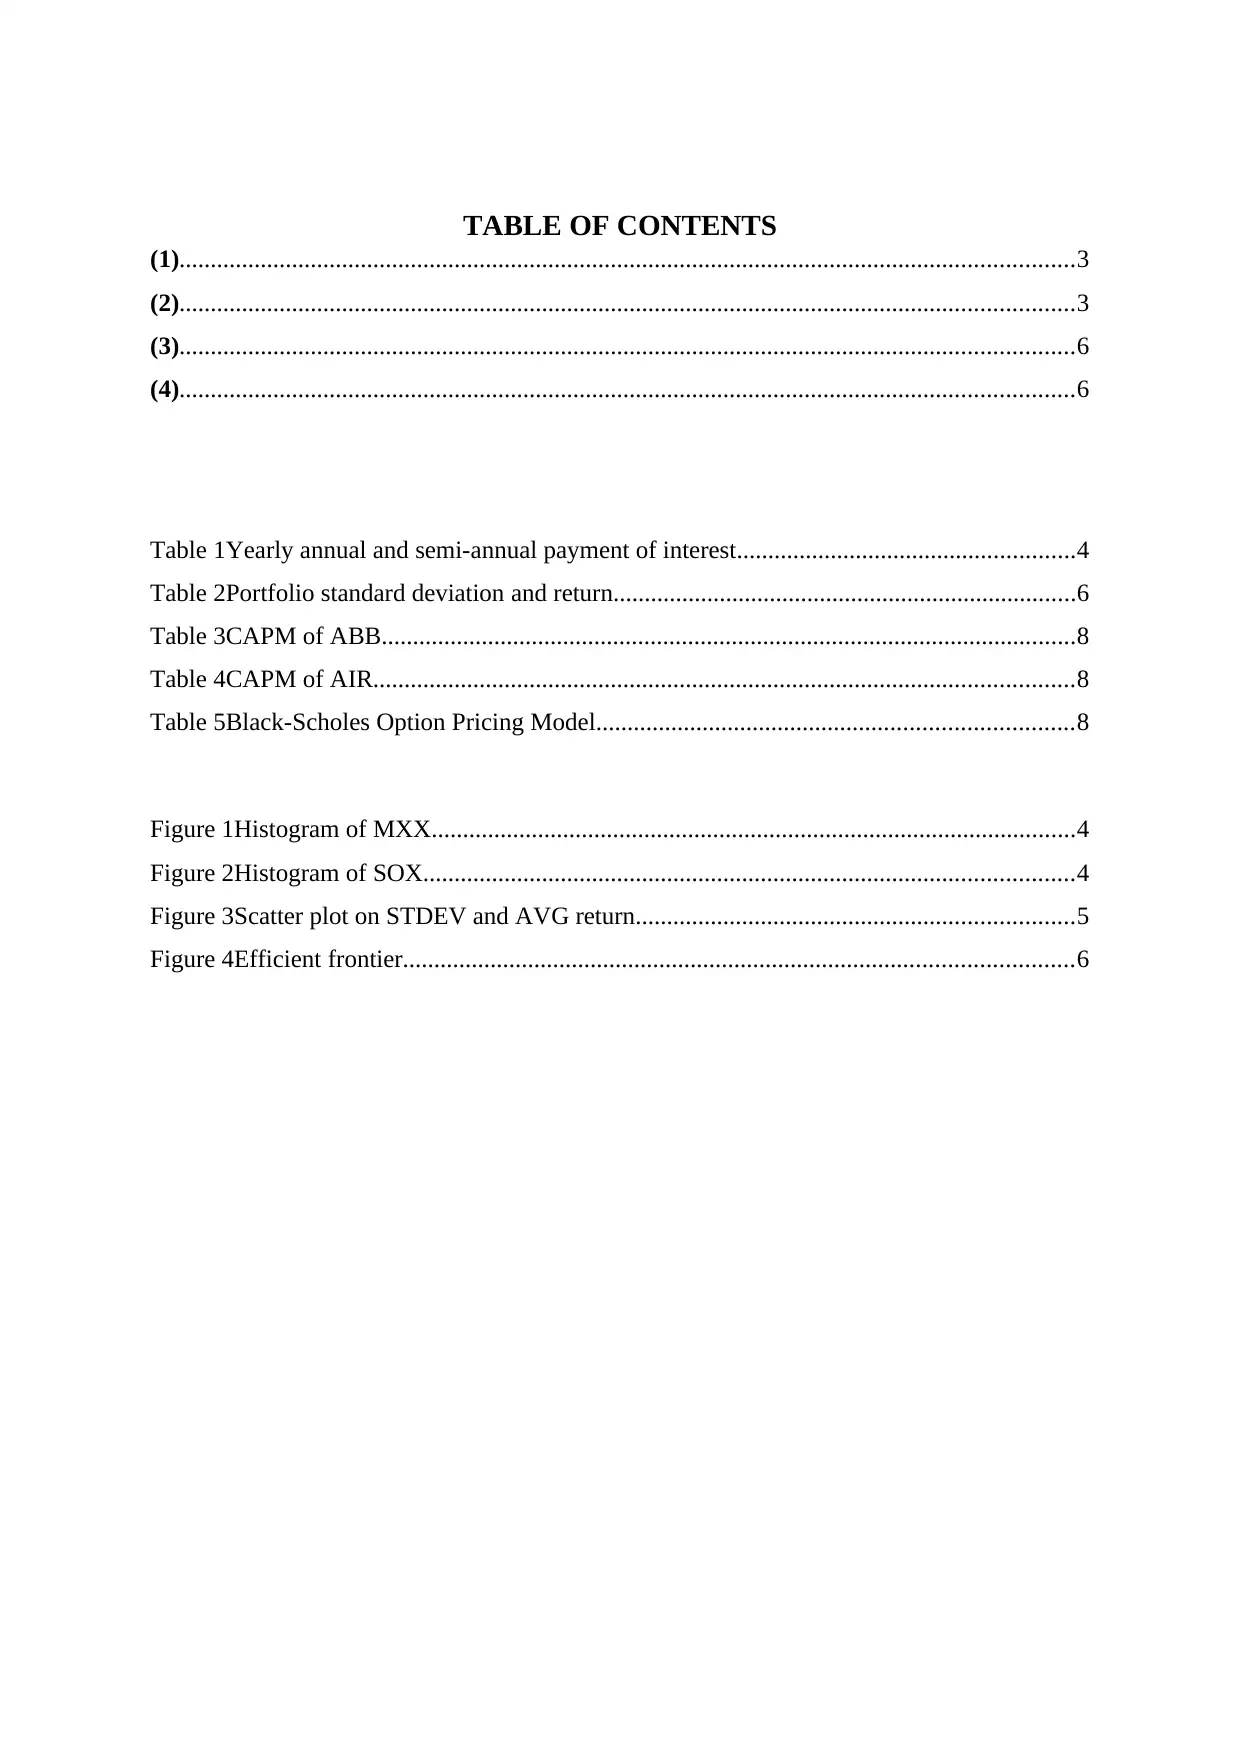
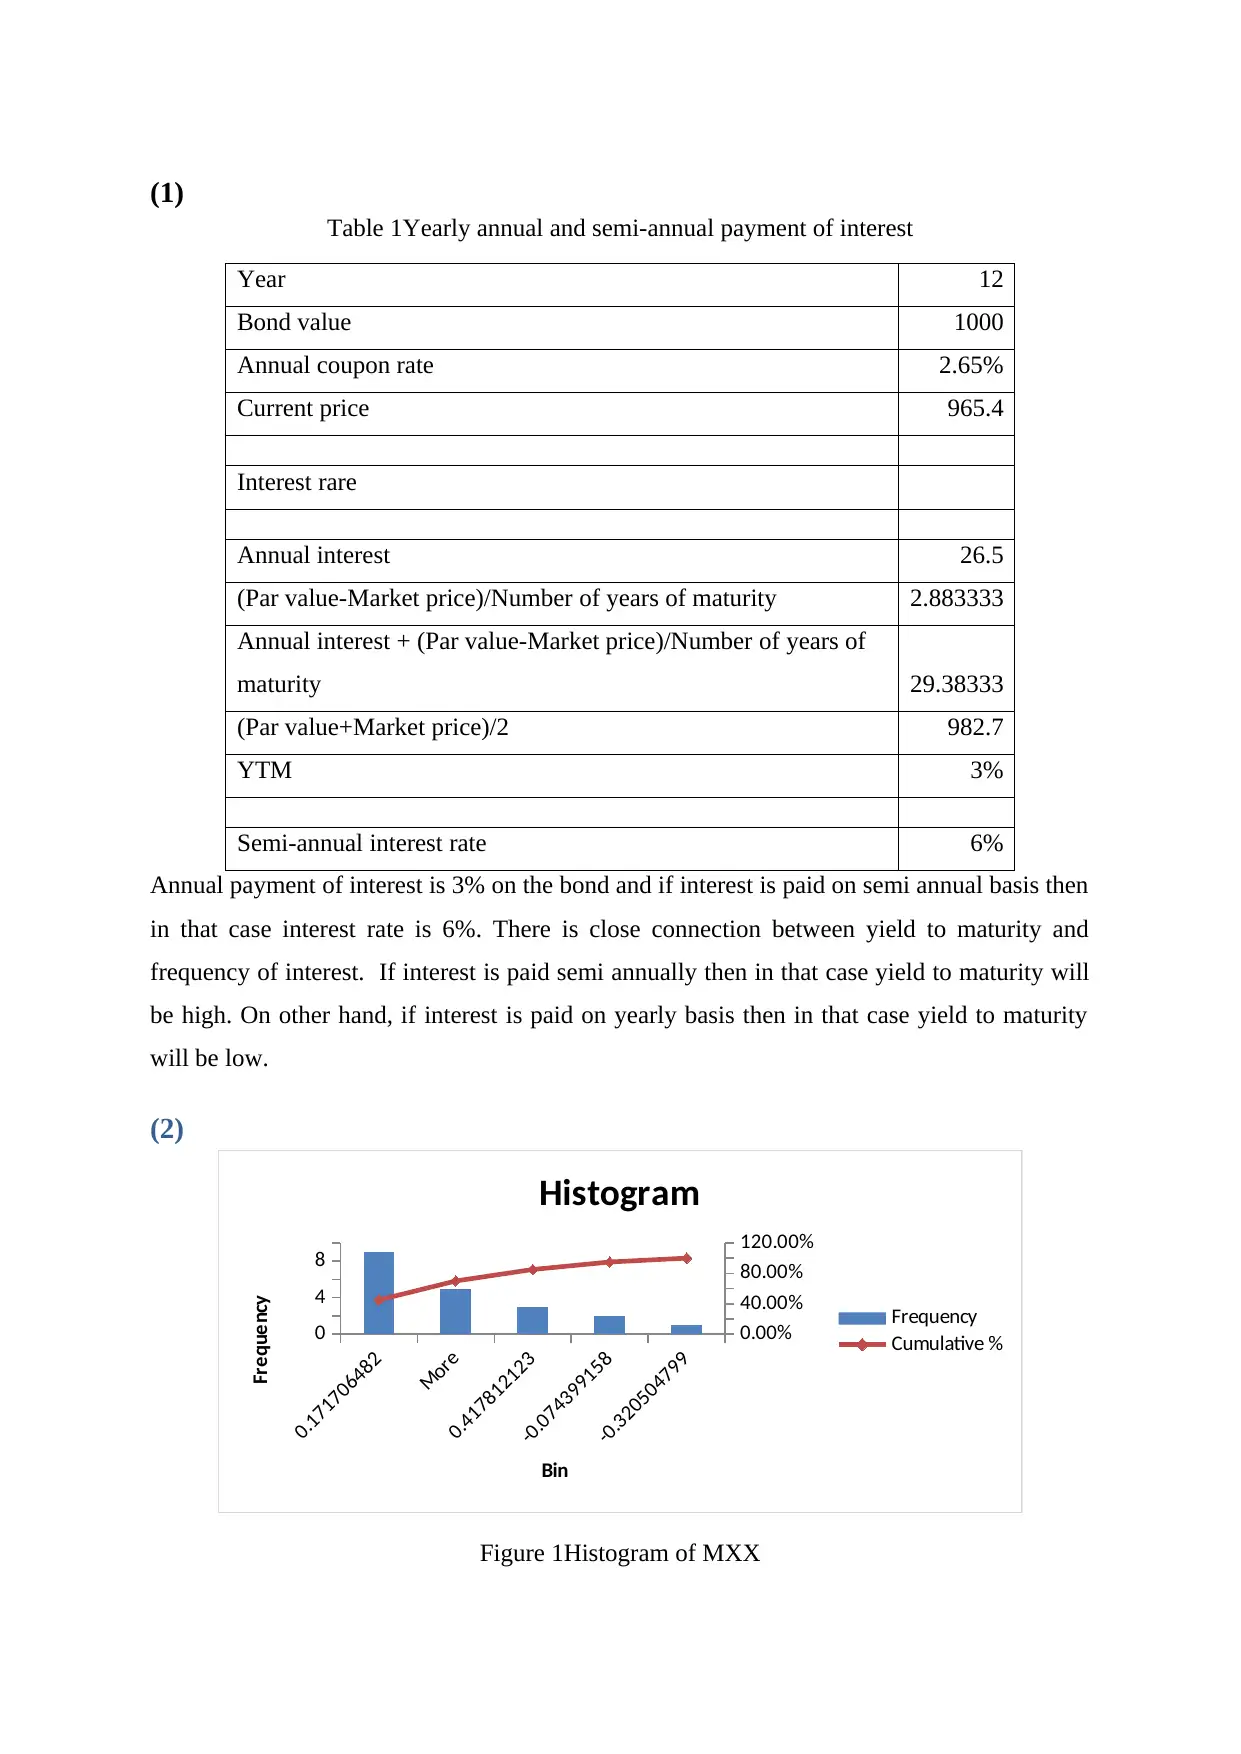
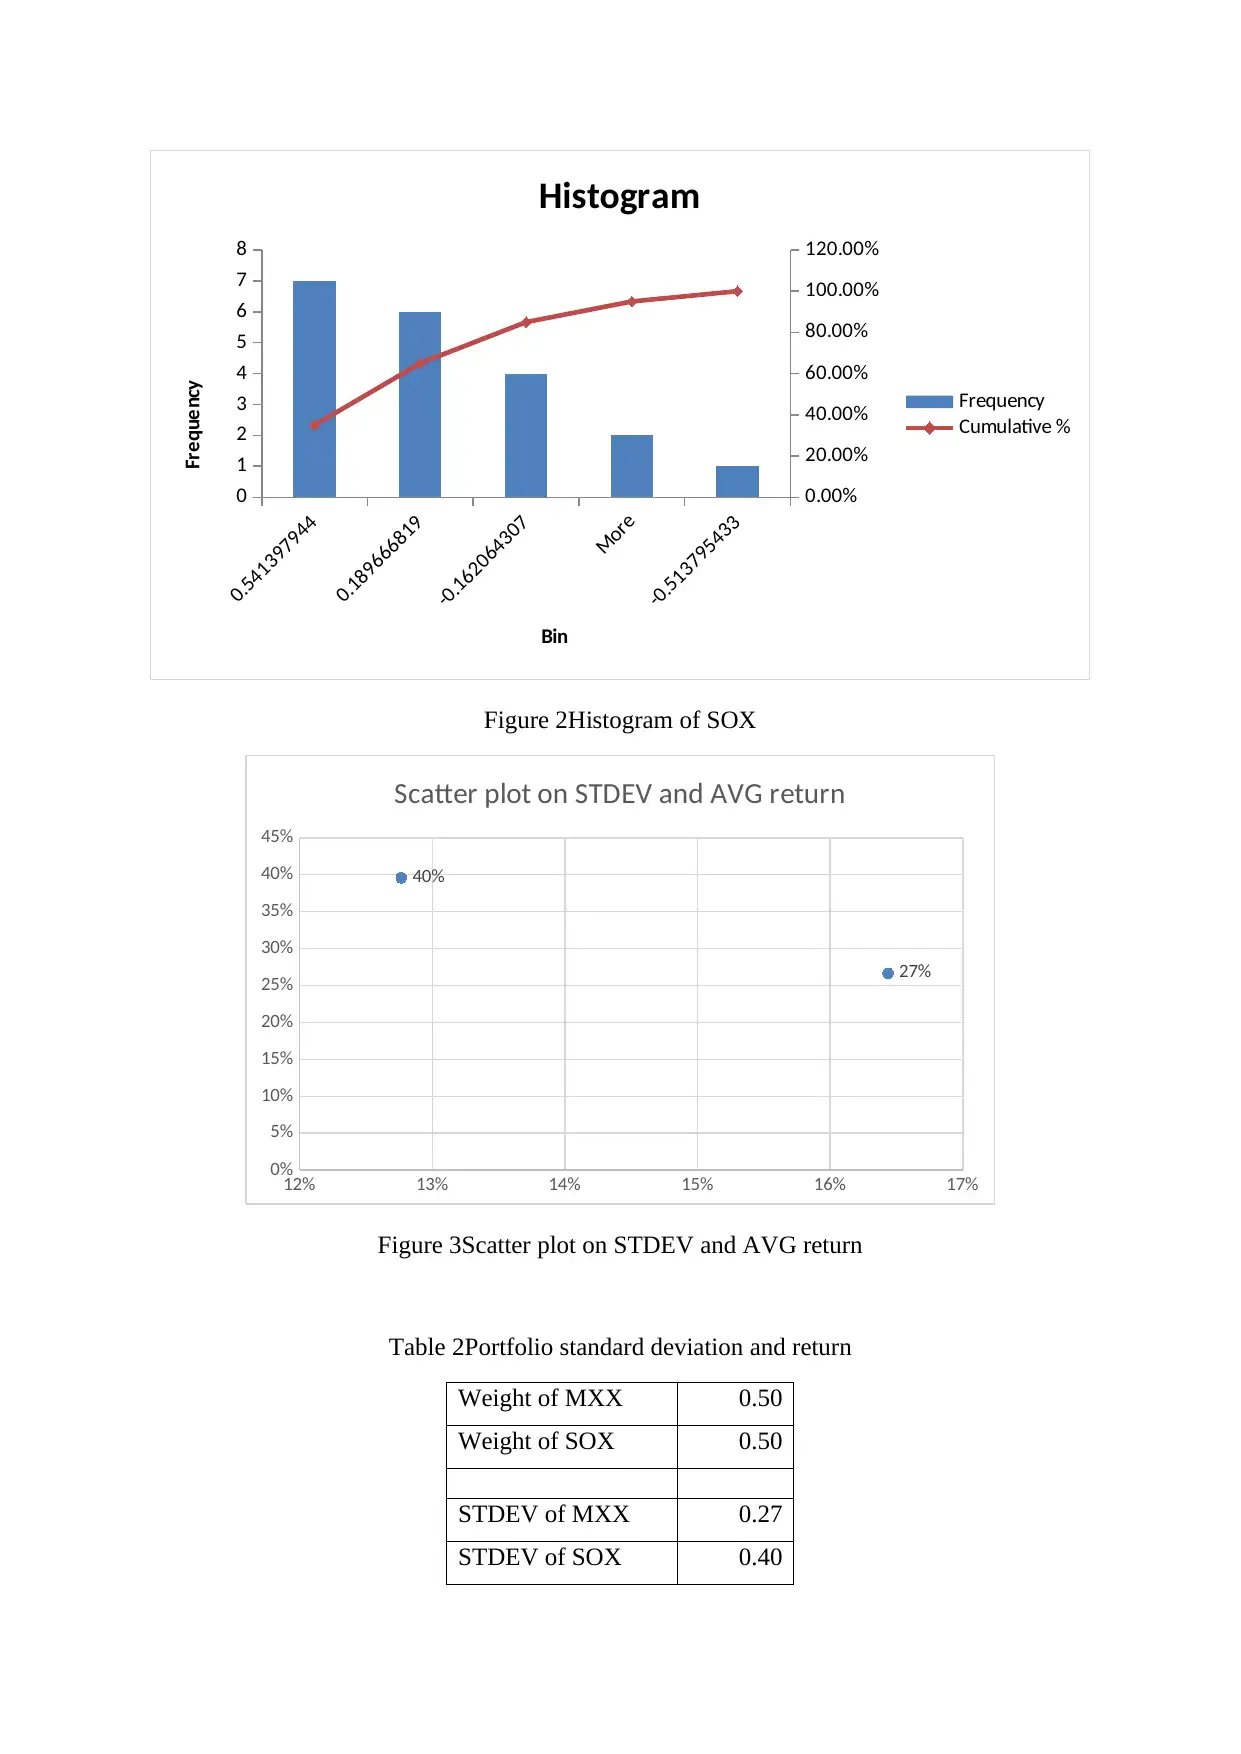
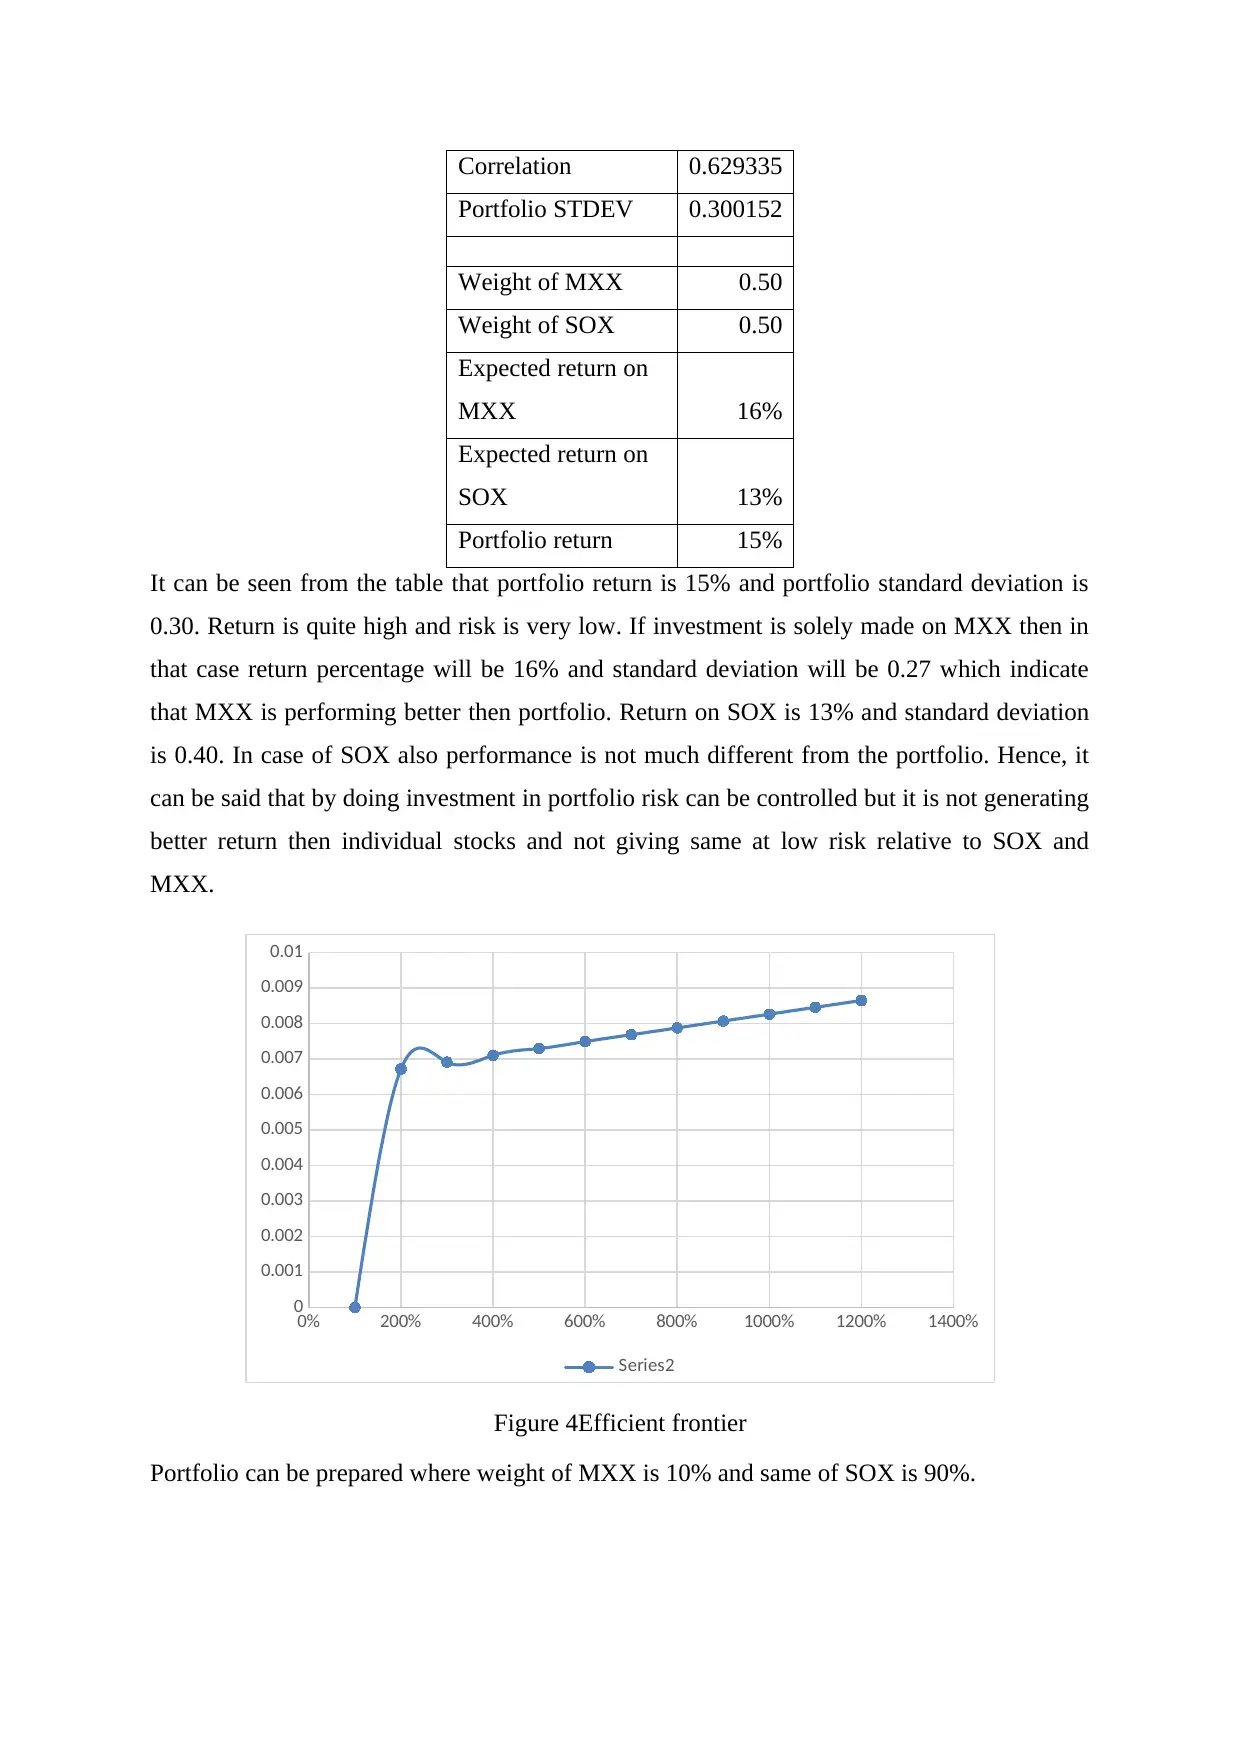
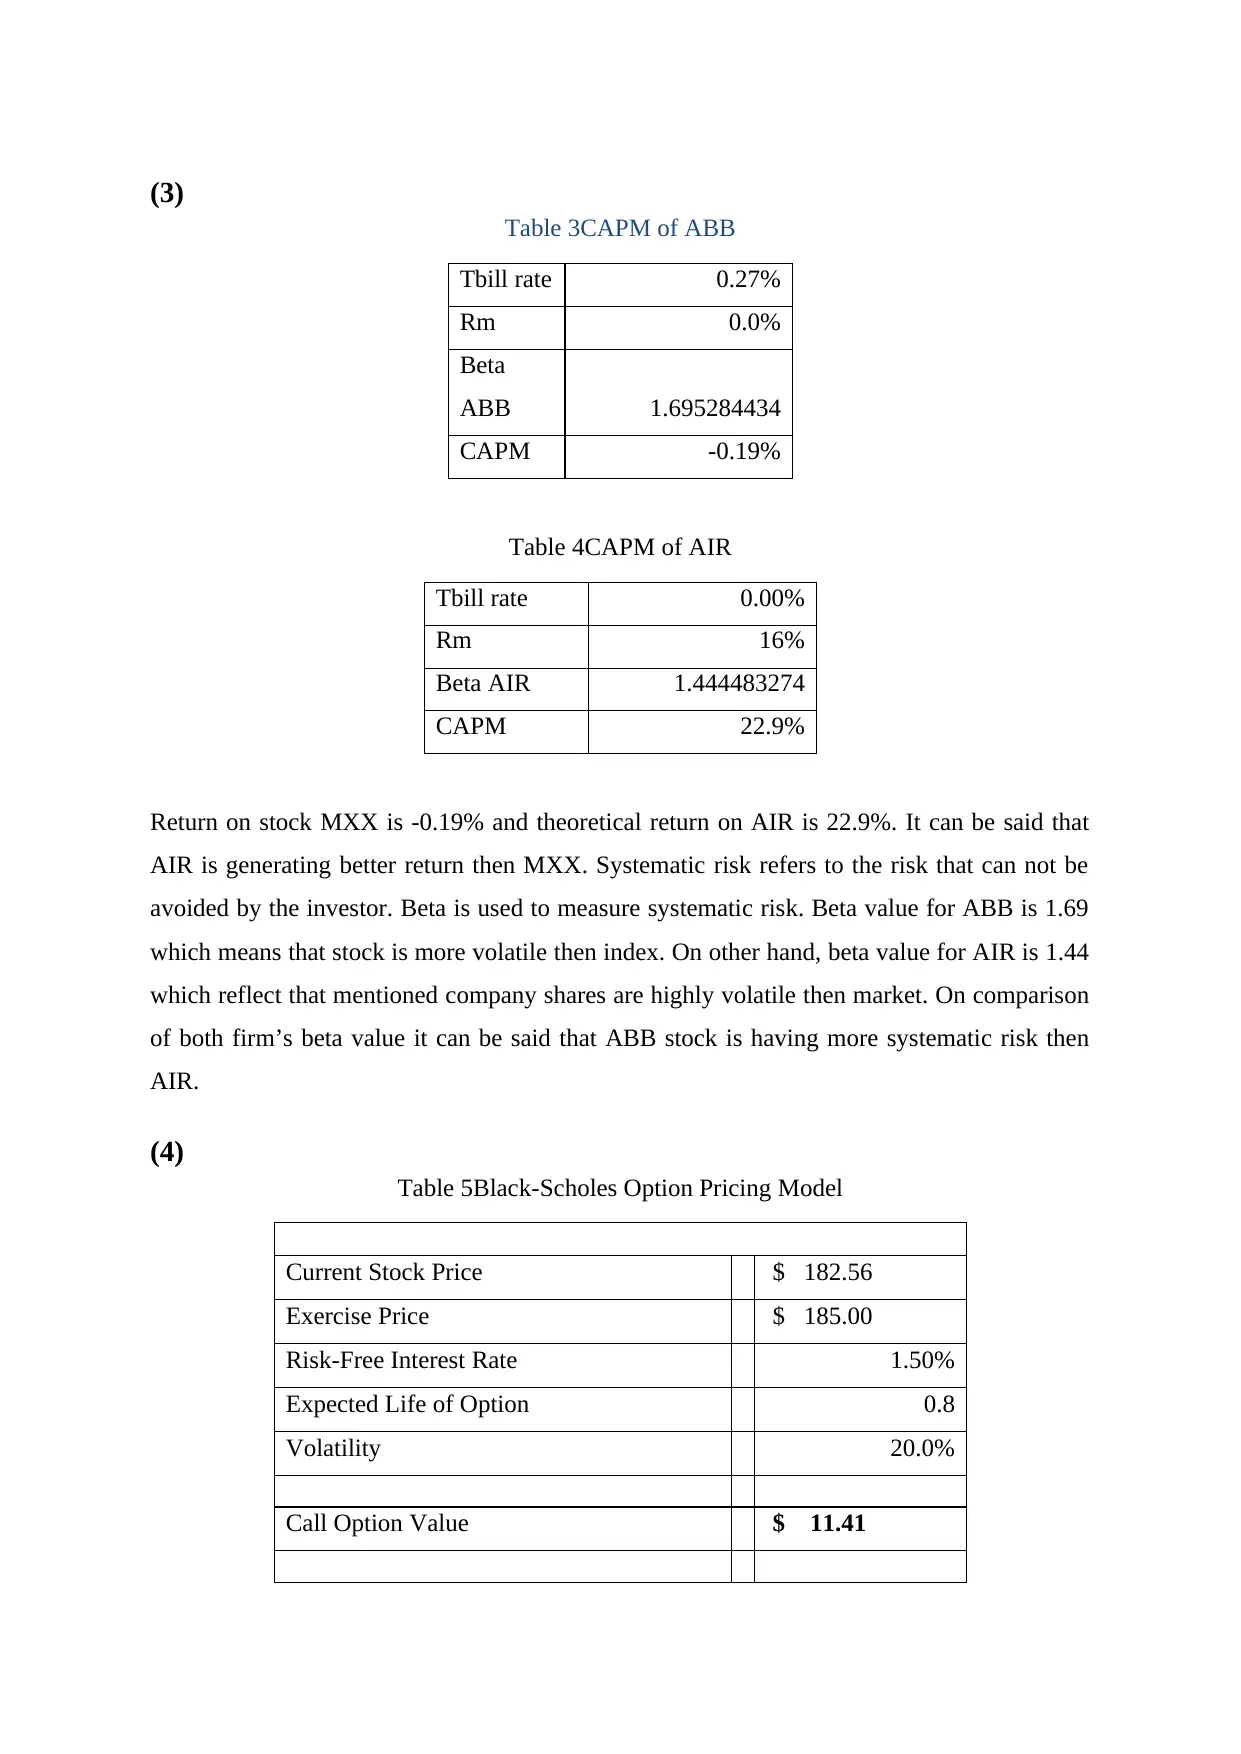
This report presents a detailed analysis of the stock market, encompassing various financial models and investment strategies. It begins with an examination of bond yields and interest rate calculations, followed by a histogram analysis of MXX and SOX stocks. The report then delves into portfolio performance, calculating standard deviation, expected returns, and the efficient frontier. Key financial models like CAPM (Capital Asset Pricing Model) are applied to assess the theoretical returns of ABB and AIR stocks, and the Black-Scholes option pricing model is utilized to determine call option values. The analysis provides insights into risk management, stock valuation, and portfolio optimization, offering a comprehensive overview of stock market dynamics and investment strategies. The report includes tables and figures to support the analysis.
Document Page
STOCK MARKET
tabler-icon-diamond-filled.svg

Paraphrase This Document

Need a fresh take? Get an instant paraphrase of this document with our AI Paraphraser
Document Page
TABLE OF CONTENTS
(1)...............................................................................................................................................3
(2)...............................................................................................................................................3
(3)...............................................................................................................................................6
(4)...............................................................................................................................................6
Table 1Yearly annual and semi-annual payment of interest......................................................4
Table 2Portfolio standard deviation and return..........................................................................6
Table 3CAPM of ABB...............................................................................................................8
Table 4CAPM of AIR................................................................................................................8
Table 5Black-Scholes Option Pricing Model............................................................................8
Figure 1Histogram of MXX.......................................................................................................4
Figure 2Histogram of SOX........................................................................................................4
Figure 3Scatter plot on STDEV and AVG return......................................................................5
Figure 4Efficient frontier...........................................................................................................6
Document Page
(1)
Table 1Yearly annual and semi-annual payment of interest
Year 12
Bond value 1000
Annual coupon rate 2.65%
Current price 965.4
Interest rare
Annual interest 26.5
(Par value-Market price)/Number of years of maturity 2.883333
Annual interest + (Par value-Market price)/Number of years of
maturity 29.38333
(Par value+Market price)/2 982.7
YTM 3%
Semi-annual interest rate 6%
Annual payment of interest is 3% on the bond and if interest is paid on semi annual basis then
in that case interest rate is 6%. There is close connection between yield to maturity and
frequency of interest. If interest is paid semi annually then in that case yield to maturity will
be high. On other hand, if interest is paid on yearly basis then in that case yield to maturity
will be low.
(2)
0.171706482
More
0.417812123
-0.074399158
-0.320504799
0
4
8
0.00%
40.00%
80.00%
120.00%
Histogram
Frequency
Cumulative %
Bin
Frequency
Figure 1Histogram of MXX
Document Page
0.541397944
0.189666819
-0.162064307
More
-0.513795433
0
1
2
3
4
5
6
7
8
0.00%
20.00%
40.00%
60.00%
80.00%
100.00%
120.00%
Histogram
Frequency
Cumulative %
Bin
Frequency
Figure 2Histogram of SOX
12% 13% 14% 15% 16% 17%
0%
5%
10%
15%
20%
25%
30%
35%
40%
45%
27%
40%
Scatter plot on STDEV and AVG return
Figure 3Scatter plot on STDEV and AVG return
Table 2Portfolio standard deviation and return
Weight of MXX 0.50
Weight of SOX 0.50
STDEV of MXX 0.27
STDEV of SOX 0.40
tabler-icon-diamond-filled.svg

Paraphrase This Document

Need a fresh take? Get an instant paraphrase of this document with our AI Paraphraser
Document Page
Correlation 0.629335
Portfolio STDEV 0.300152
Weight of MXX 0.50
Weight of SOX 0.50
Expected return on
MXX 16%
Expected return on
SOX 13%
Portfolio return 15%
It can be seen from the table that portfolio return is 15% and portfolio standard deviation is
0.30. Return is quite high and risk is very low. If investment is solely made on MXX then in
that case return percentage will be 16% and standard deviation will be 0.27 which indicate
that MXX is performing better then portfolio. Return on SOX is 13% and standard deviation
is 0.40. In case of SOX also performance is not much different from the portfolio. Hence, it
can be said that by doing investment in portfolio risk can be controlled but it is not generating
better return then individual stocks and not giving same at low risk relative to SOX and
MXX.
0% 200% 400% 600% 800% 1000% 1200% 1400%
0
0.001
0.002
0.003
0.004
0.005
0.006
0.007
0.008
0.009
0.01
Series2
Figure 4Efficient frontier
Portfolio can be prepared where weight of MXX is 10% and same of SOX is 90%.
Document Page
(3)
Table 3CAPM of ABB
Tbill rate 0.27%
Rm 0.0%
Beta
ABB 1.695284434
CAPM -0.19%
Table 4CAPM of AIR
Tbill rate 0.00%
Rm 16%
Beta AIR 1.444483274
CAPM 22.9%
Return on stock MXX is -0.19% and theoretical return on AIR is 22.9%. It can be said that
AIR is generating better return then MXX. Systematic risk refers to the risk that can not be
avoided by the investor. Beta is used to measure systematic risk. Beta value for ABB is 1.69
which means that stock is more volatile then index. On other hand, beta value for AIR is 1.44
which reflect that mentioned company shares are highly volatile then market. On comparison
of both firm’s beta value it can be said that ABB stock is having more systematic risk then
AIR.
(4)
Table 5Black-Scholes Option Pricing Model
Current Stock Price $ 182.56
Exercise Price $ 185.00
Risk-Free Interest Rate 1.50%
Expected Life of Option 0.8
Volatility 20.0%
Call Option Value $ 11.41
Document Page
Call option value is $11.41. In calculation of call option value variables taken into account
are current stock price, exercise price, risk free rate of interest, expected life of option and
volatility. By using Black Scholes model entire calculation is done.
chevron_up_icon
1 out of 7
circle_padding
hide_on_mobile
zoom_out_icon
[object Object]