Analysis of Aerodynamic Drag and Fuel Efficiency in Vehicles
VerifiedAdded on 2023/01/13
|10
|2586
|46
Report
AI Summary
This report provides an in-depth analysis of aerodynamic drag and its significant impact on vehicle fuel efficiency. It begins with an introduction to aerodynamic drag, explaining its definition and the forces involved. The main body delves into the calculation of drag forces using relevant formulas and factors such as drag coefficient, cross-sectional area, and velocity. It includes a MATLAB program to model aerodynamic drag and visualize the relationship between drag force, velocity, and drag coefficient. The report then discusses various techniques to reduce aerodynamic drag, including the use of rear screens, rear fairings, vortex generators, and bumped-shaped vortex generators, and delta-wing shaped vortex generators. The report includes data and analysis of three different car models (Porsche 718 Cyman GTS 4.0, Porsche 718 Boxster GTS 4.0, and Toyota Avalon Touring) to compare their aerodynamic drag and fuel consumption. Finally, the report concludes by summarizing the importance of understanding and mitigating aerodynamic drag to improve fuel efficiency, and also provides techniques for reducing the fuel consumption.
Assessment (Modelling Aerodynamic)
Paraphrase This Document
Need a fresh take? Get an instant paraphrase of this document with our AI Paraphraser
Table of Contents
INTRODUCTION...........................................................................................................................1
MAIN BODY...................................................................................................................................1
MATLAB Program......................................................................................................................3
Ways to reduce Drag....................................................................................................................5
CONCLUSION................................................................................................................................5
REFERENCES................................................................................................................................7
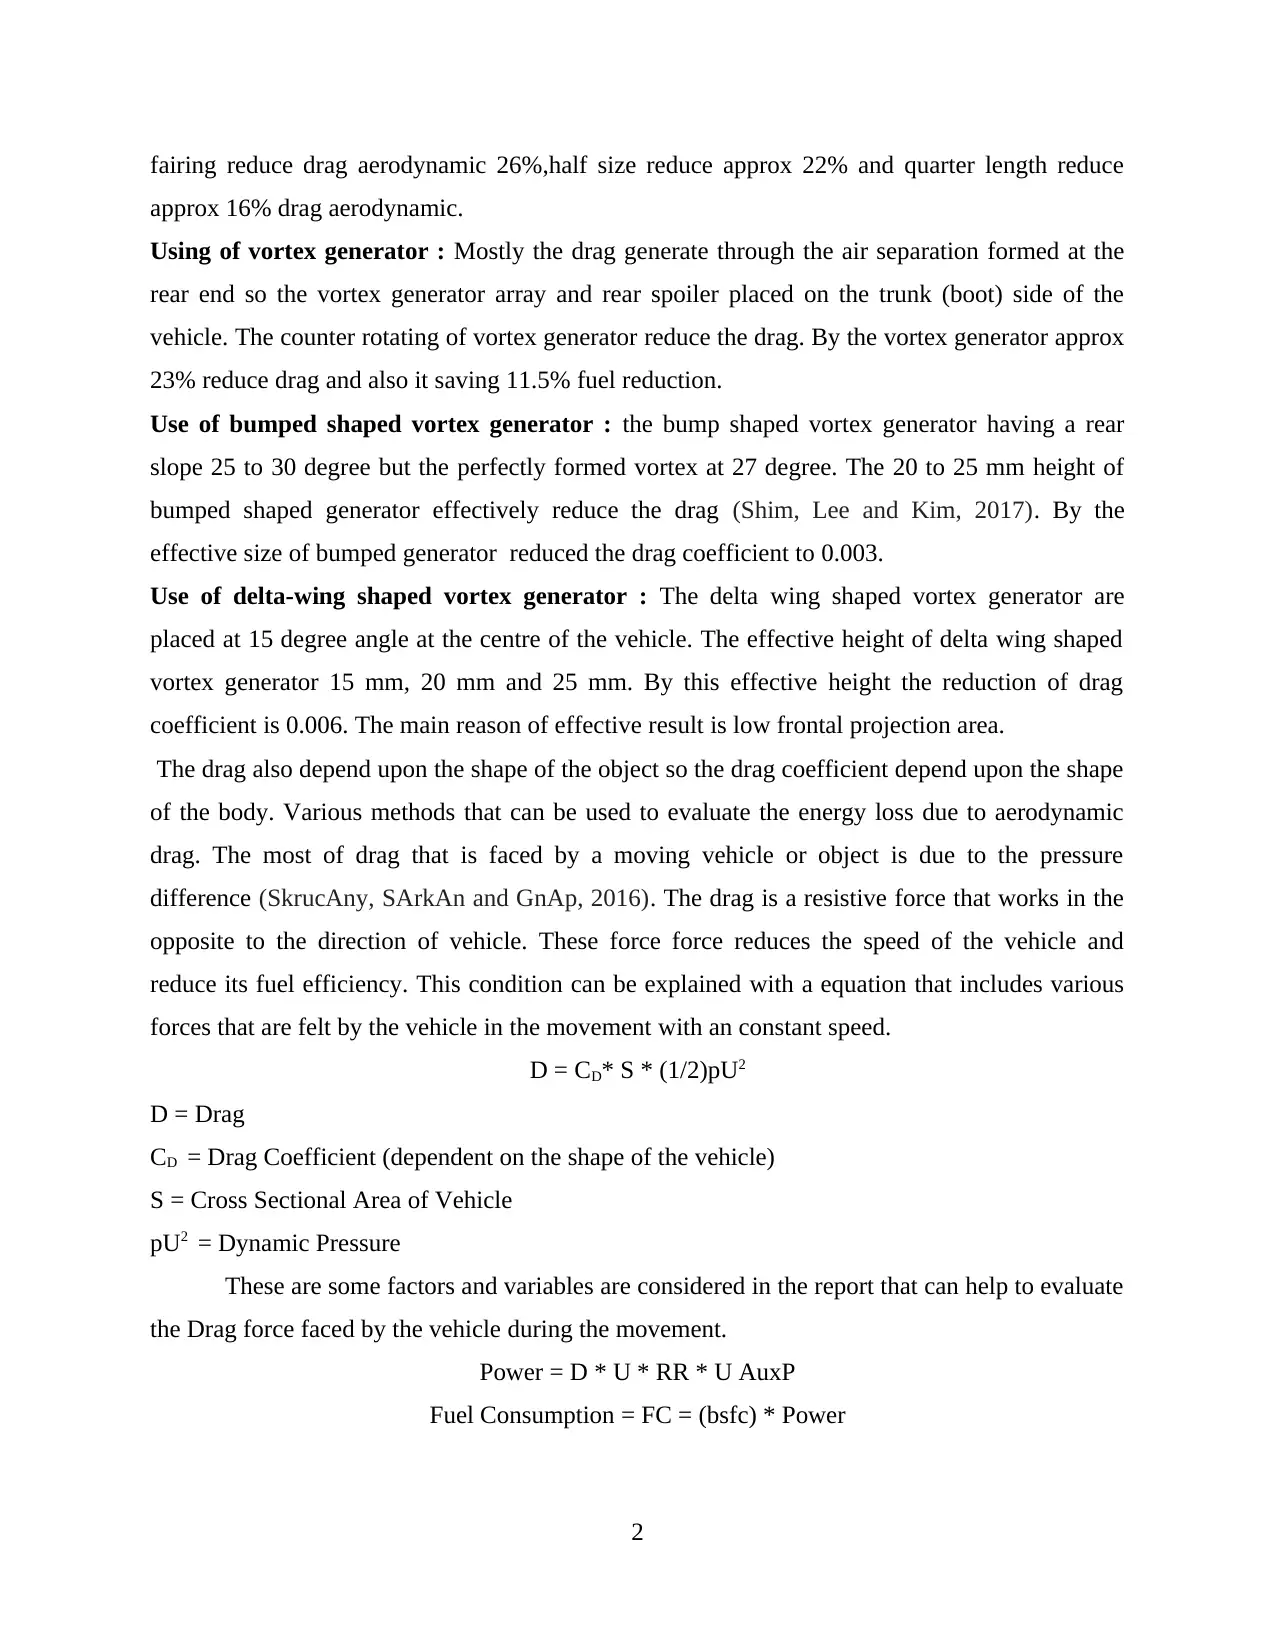
INTRODUCTION
Aerodynamic drag is considered as a force that acts against the relative motion of the a
object respect to surrounding fluid. This also can be considered as resistance between two
different fluids or resistance between a fluid and a solid surface. This resistance between surfaces
reduce the fuel efficiency of the vehicle (Ageev and Pavlenko, 2016). Fuel efficiency is one of
the major concern in current time that is considered by engineers to maintain the sustainability of
the motor vehicles by making such changes in the structural design of vehicles. Some techniques
that can be used to reduce the aerodynamic drag in different vehicles also will be provided in the
report. The major purpose of this process to evaluate the energy loss in the vehicles due to drag
in order investigate various methods that can be used to analyse energy require to overcome the
aerodynamic drag. The processes that can be used to calculate fuel consumption due to drag will
be explained in the report. Some of required to be made in assumptions
MAIN BODY
Aerodynamic Drag is a mechanical force on the object that resist the motion through the
fluid called drag and if fluid is gas like air called aerodynamic and if fluid is water it is
hydrodynamic. Which are induced interaction between solid and fluid like gas and liquid. Drag is
generate through the difference of velocity, if the velocity of the solid and fluid are different drag
is occurs (Aschwanden and Gopalswamy, 2019). Drag is act in the direction of opposite of object
motion. Drag aerodynamic is one type of force so it is a vector quantity so that having both
magnitude and direction. The aero dynamic drag force depend upon the various factor like
density of the fluid (Air / liquid, cross section area which are direction of the motion, velocity,
and aero dynamic coefficient.
Drag reduction using rear screen : In this method certain installation like the plate (Rear
screen) is placed at back of the vehicle. By this rear screen air separation is create at the end wall
of the vehicle. By this rear screen the vortex is generate between the rear screen and end wall of
the vehicle. The generation n of vortex reduce the air separation (Merkes, Menaspà and Abbiss,
2019). By this method the drag aerodynamic is reduced and if increase the distance between rear
screen and rear wall of the vehicle we got a better result.
Drag reduction using rear fairing : Rear fairing is addition extended structure at air separation
area in vehicle. The extended structure make perfect no air separation. The full size of rear
1
⊘ This is a preview!⊘
Do you want full access?
Subscribe today to unlock all pages.
Trusted by 1+ million students worldwide
fairing reduce drag aerodynamic 26%,half size reduce approx 22% and quarter length reduce
approx 16% drag aerodynamic.
Using of vortex generator : Mostly the drag generate through the air separation formed at the
rear end so the vortex generator array and rear spoiler placed on the trunk (boot) side of the
vehicle. The counter rotating of vortex generator reduce the drag. By the vortex generator approx
23% reduce drag and also it saving 11.5% fuel reduction.
Use of bumped shaped vortex generator : the bump shaped vortex generator having a rear
slope 25 to 30 degree but the perfectly formed vortex at 27 degree. The 20 to 25 mm height of
bumped shaped generator effectively reduce the drag (Shim, Lee and Kim, 2017). By the
effective size of bumped generator reduced the drag coefficient to 0.003.
Use of delta-wing shaped vortex generator : The delta wing shaped vortex generator are
placed at 15 degree angle at the centre of the vehicle. The effective height of delta wing shaped
vortex generator 15 mm, 20 mm and 25 mm. By this effective height the reduction of drag
coefficient is 0.006. The main reason of effective result is low frontal projection area.
The drag also depend upon the shape of the object so the drag coefficient depend upon the shape
of the body. Various methods that can be used to evaluate the energy loss due to aerodynamic
drag. The most of drag that is faced by a moving vehicle or object is due to the pressure
difference (SkrucAny, SArkAn and GnAp, 2016). The drag is a resistive force that works in the
opposite to the direction of vehicle. These force force reduces the speed of the vehicle and
reduce its fuel efficiency. This condition can be explained with a equation that includes various
forces that are felt by the vehicle in the movement with an constant speed.
D = CD* S * (1/2)pU2
D = Drag
CD = Drag Coefficient (dependent on the shape of the vehicle)
S = Cross Sectional Area of Vehicle
pU2 = Dynamic Pressure
These are some factors and variables are considered in the report that can help to evaluate
the Drag force faced by the vehicle during the movement.
Power = D * U * RR * U AuxP
Fuel Consumption = FC = (bsfc) * Power
2
Paraphrase This Document
Need a fresh take? Get an instant paraphrase of this document with our AI Paraphraser
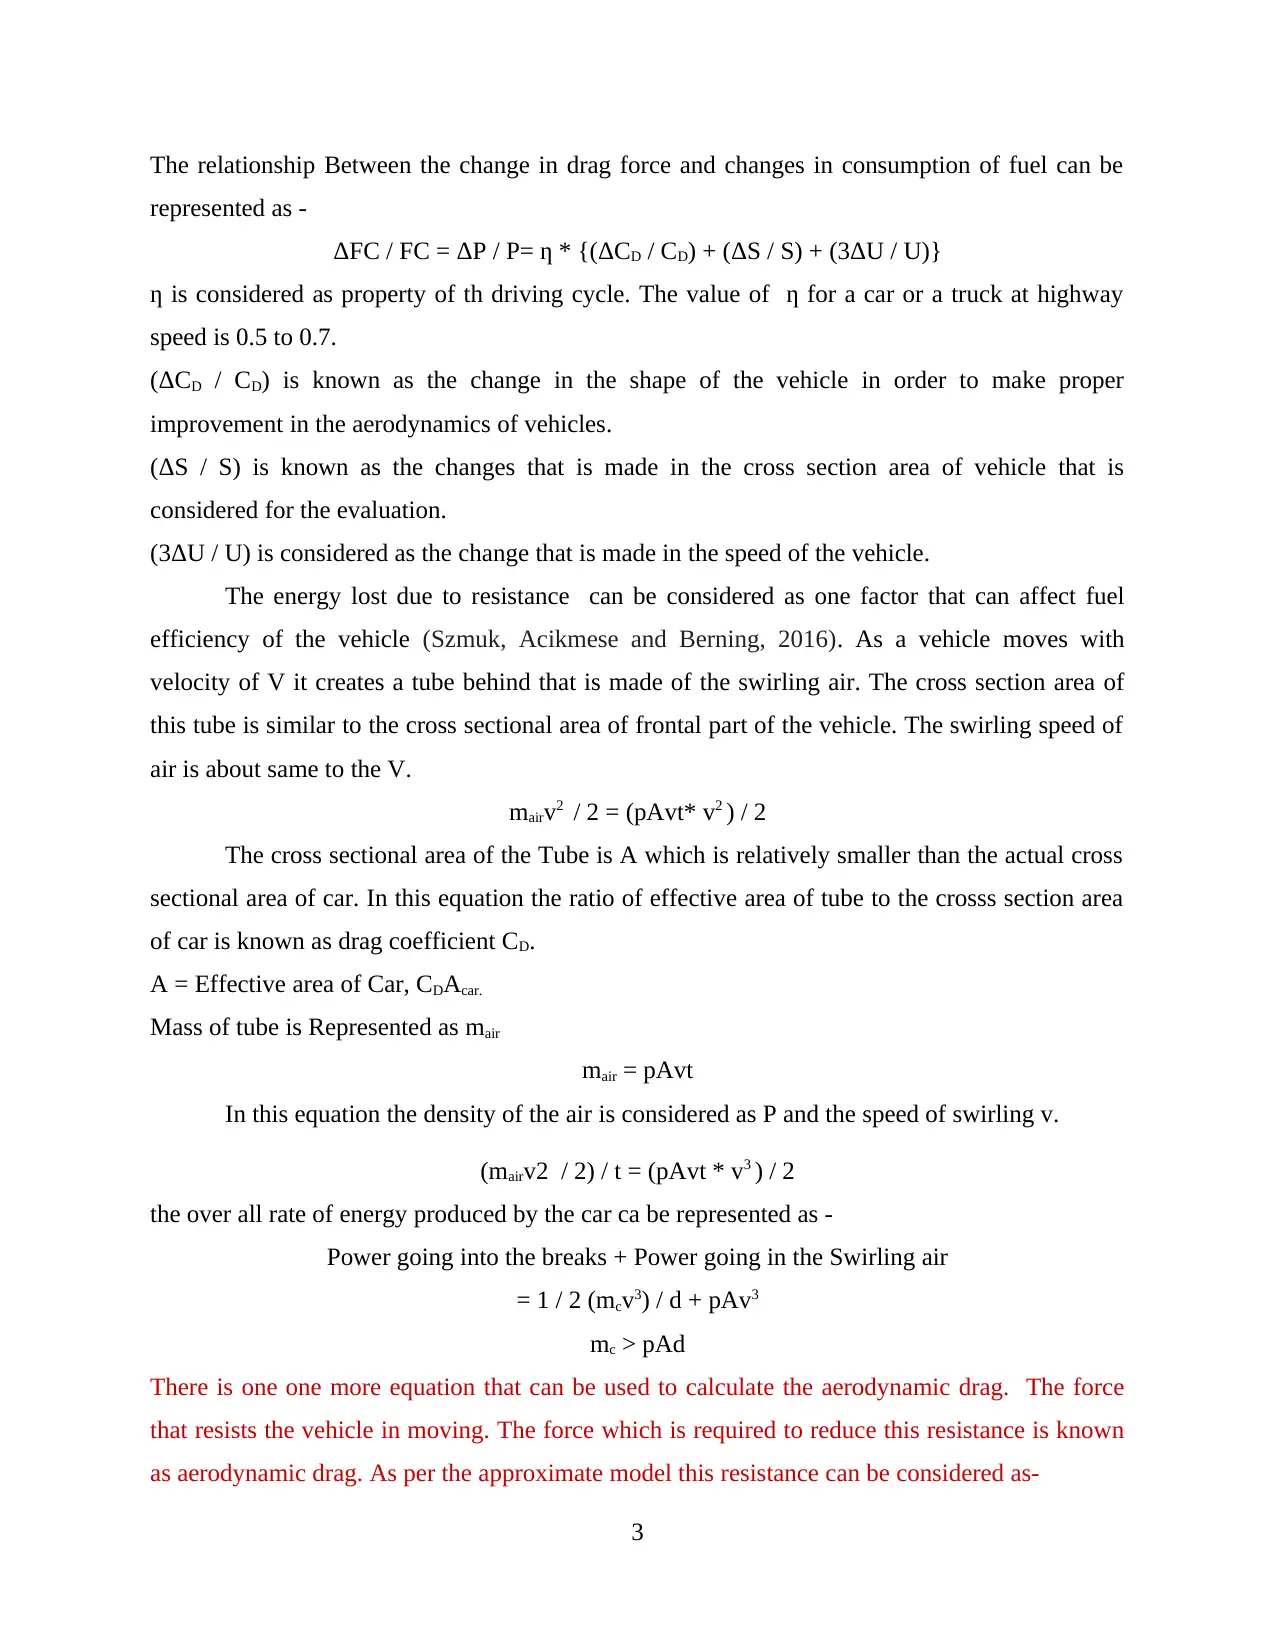
The relationship Between the change in drag force and changes in consumption of fuel can be
represented as -
ΔFC / FC = ΔP / P= ƞ * {(ΔCD / CD) + (ΔS / S) + (3ΔU / U)}
ƞ is considered as property of th driving cycle. The value of ƞ for a car or a truck at highway
speed is 0.5 to 0.7.
(ΔCD / CD) is known as the change in the shape of the vehicle in order to make proper
improvement in the aerodynamics of vehicles.
(ΔS / S) is known as the changes that is made in the cross section area of vehicle that is
considered for the evaluation.
(3ΔU / U) is considered as the change that is made in the speed of the vehicle.
The energy lost due to resistance can be considered as one factor that can affect fuel
efficiency of the vehicle (Szmuk, Acikmese and Berning, 2016). As a vehicle moves with
velocity of V it creates a tube behind that is made of the swirling air. The cross section area of
this tube is similar to the cross sectional area of frontal part of the vehicle. The swirling speed of
air is about same to the V.
mairv2 / 2 = (pAvt* v2 ) / 2
The cross sectional area of the Tube is A which is relatively smaller than the actual cross
sectional area of car. In this equation the ratio of effective area of tube to the crosss section area
of car is known as drag coefficient CD.
A = Effective area of Car, CDAcar.
Mass of tube is Represented as mair
mair = pAvt
In this equation the density of the air is considered as P and the speed of swirling v.
(mairv2 / 2) / t = (pAvt * v3 ) / 2
the over all rate of energy produced by the car ca be represented as -
Power going into the breaks + Power going in the Swirling air
= 1 / 2 (mcv3) / d + pAv3
mc > pAd
There is one one more equation that can be used to calculate the aerodynamic drag. The force
that resists the vehicle in moving. The force which is required to reduce this resistance is known
as aerodynamic drag. As per the approximate model this resistance can be considered as-
3
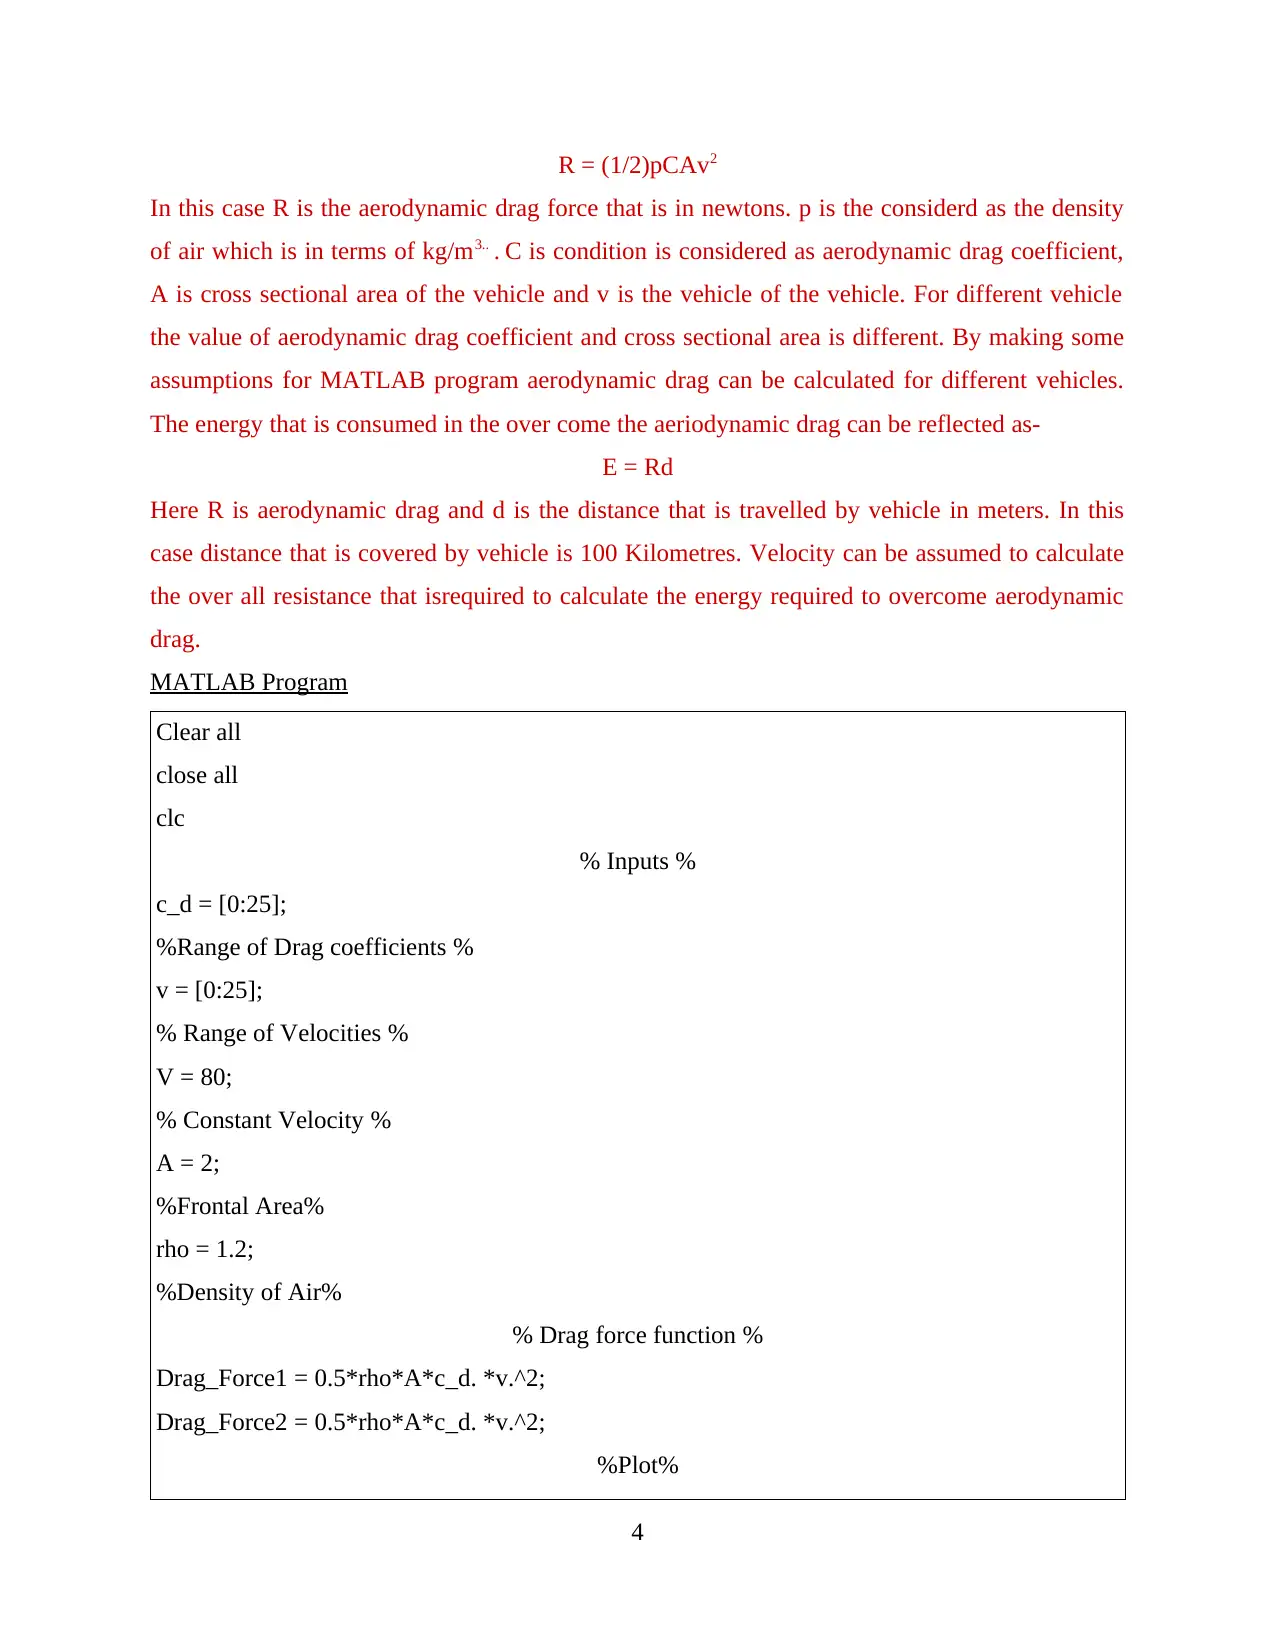
R = (1/2)pCAv2
In this case R is the aerodynamic drag force that is in newtons. p is the considerd as the density
of air which is in terms of kg/m3.. . C is condition is considered as aerodynamic drag coefficient,
A is cross sectional area of the vehicle and v is the vehicle of the vehicle. For different vehicle
the value of aerodynamic drag coefficient and cross sectional area is different. By making some
assumptions for MATLAB program aerodynamic drag can be calculated for different vehicles.
The energy that is consumed in the over come the aeriodynamic drag can be reflected as-
E = Rd
Here R is aerodynamic drag and d is the distance that is travelled by vehicle in meters. In this
case distance that is covered by vehicle is 100 Kilometres. Velocity can be assumed to calculate
the over all resistance that isrequired to calculate the energy required to overcome aerodynamic
drag.
MATLAB Program
Clear all
close all
clc
% Inputs %
c_d = [0:25];
%Range of Drag coefficients %
v = [0:25];
% Range of Velocities %
V = 80;
% Constant Velocity %
A = 2;
%Frontal Area%
rho = 1.2;
%Density of Air%
% Drag force function %
Drag_Force1 = 0.5*rho*A*c_d. *v.^2;
Drag_Force2 = 0.5*rho*A*c_d. *v.^2;
%Plot%
4
⊘ This is a preview!⊘
Do you want full access?
Subscribe today to unlock all pages.
Trusted by 1+ million students worldwide
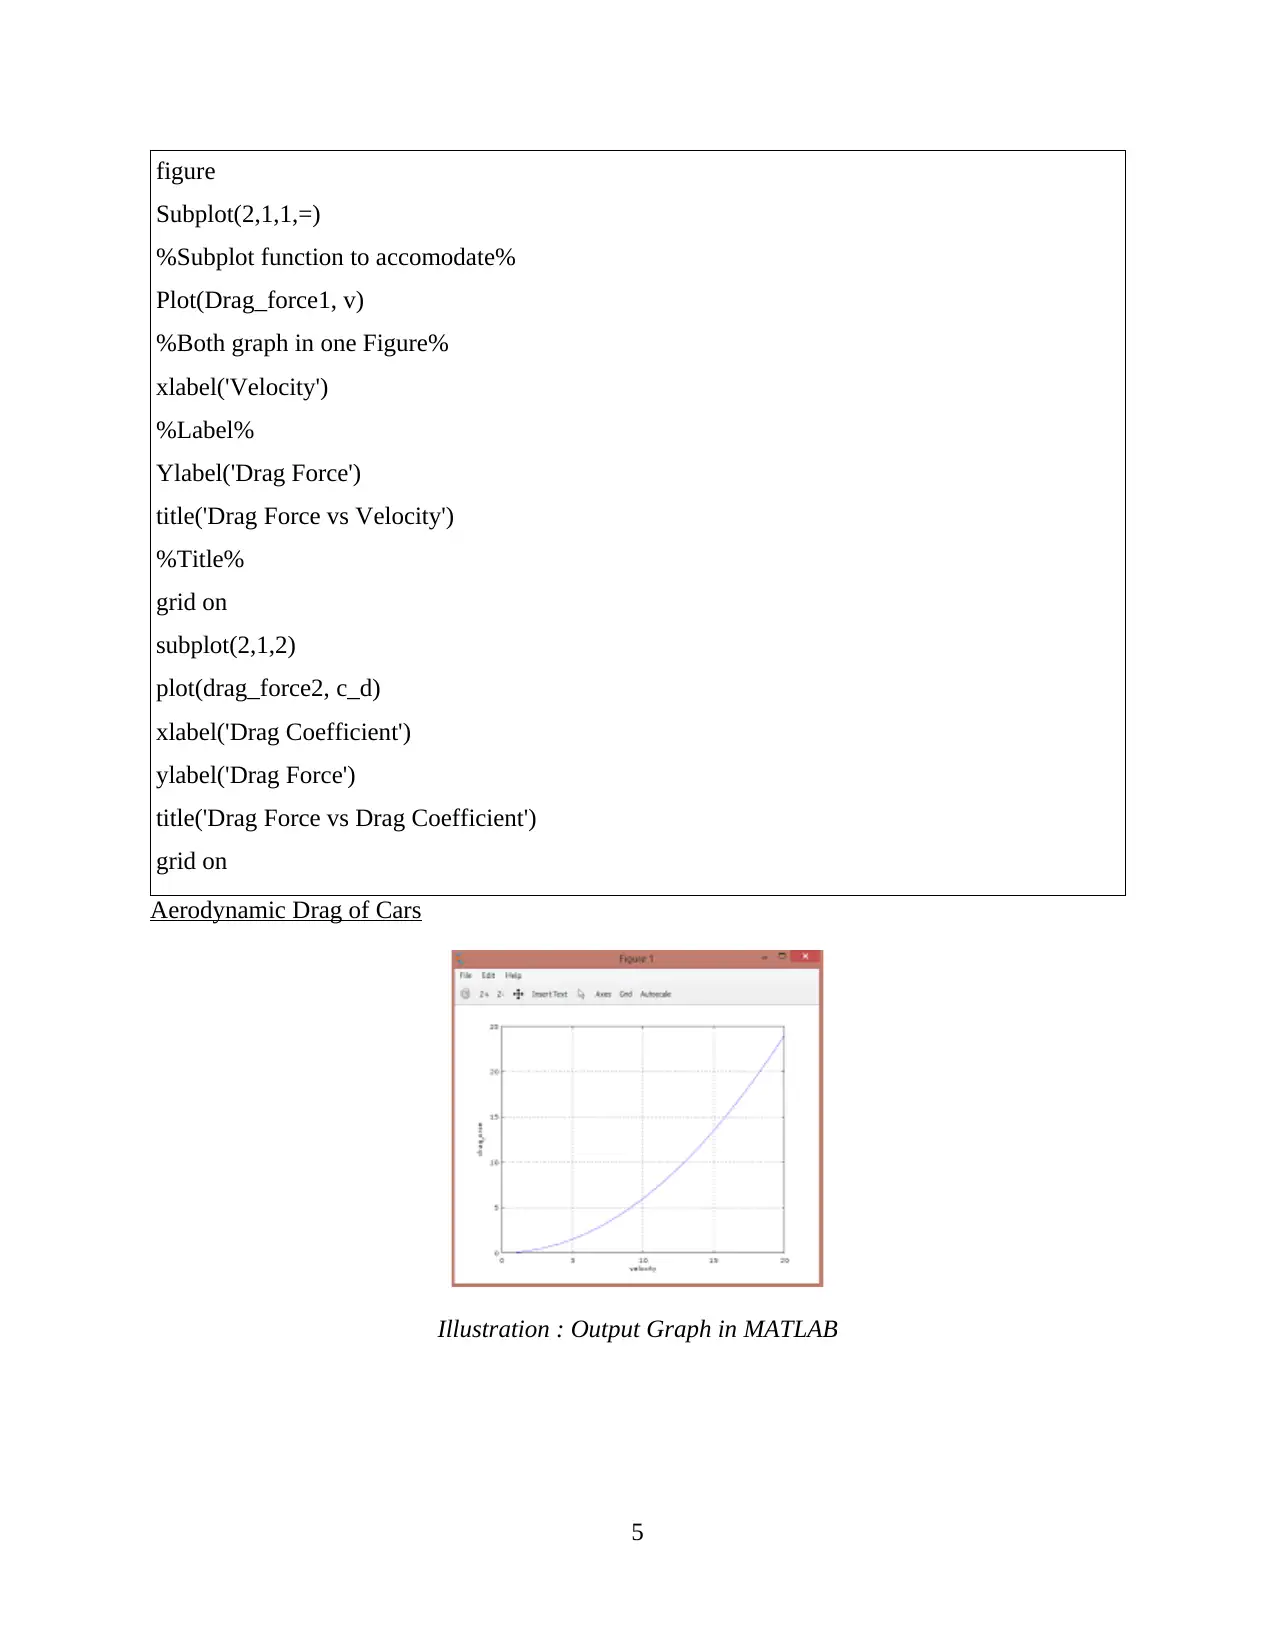
figure
Subplot(2,1,1,=)
%Subplot function to accomodate%
Plot(Drag_force1, v)
%Both graph in one Figure%
xlabel('Velocity')
%Label%
Ylabel('Drag Force')
title('Drag Force vs Velocity')
%Title%
grid on
subplot(2,1,2)
plot(drag_force2, c_d)
xlabel('Drag Coefficient')
ylabel('Drag Force')
title('Drag Force vs Drag Coefficient')
grid on
Aerodynamic Drag of Cars
5
Illustration : Output Graph in MATLAB
Paraphrase This Document
Need a fresh take? Get an instant paraphrase of this document with our AI Paraphraser
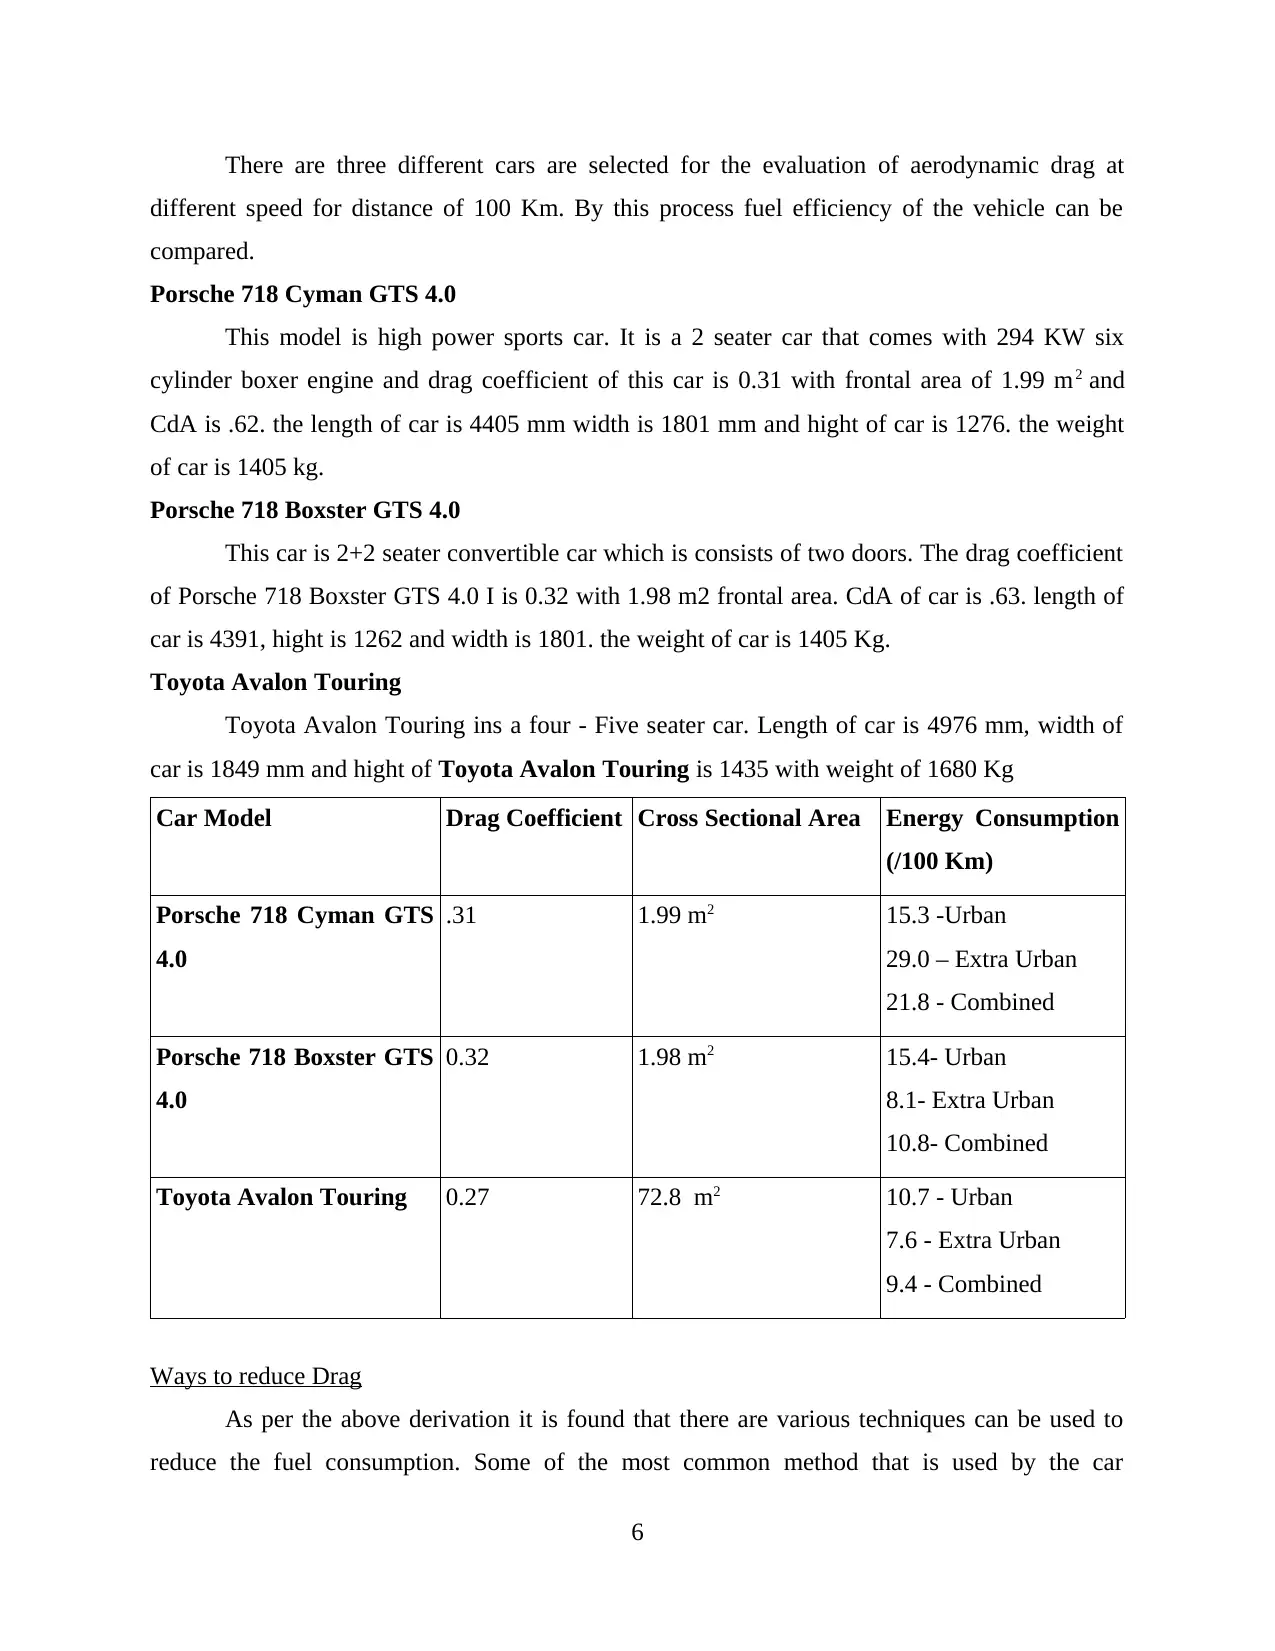
There are three different cars are selected for the evaluation of aerodynamic drag at
different speed for distance of 100 Km. By this process fuel efficiency of the vehicle can be
compared.
Porsche 718 Cyman GTS 4.0
This model is high power sports car. It is a 2 seater car that comes with 294 KW six
cylinder boxer engine and drag coefficient of this car is 0.31 with frontal area of 1.99 m2 and
CdA is .62. the length of car is 4405 mm width is 1801 mm and hight of car is 1276. the weight
of car is 1405 kg.
Porsche 718 Boxster GTS 4.0
This car is 2+2 seater convertible car which is consists of two doors. The drag coefficient
of Porsche 718 Boxster GTS 4.0 I is 0.32 with 1.98 m2 frontal area. CdA of car is .63. length of
car is 4391, hight is 1262 and width is 1801. the weight of car is 1405 Kg.
Toyota Avalon Touring
Toyota Avalon Touring ins a four - Five seater car. Length of car is 4976 mm, width of
car is 1849 mm and hight of Toyota Avalon Touring is 1435 with weight of 1680 Kg
Car Model Drag Coefficient Cross Sectional Area Energy Consumption
(/100 Km)
Porsche 718 Cyman GTS
4.0
.31 1.99 m2 15.3 -Urban
29.0 – Extra Urban
21.8 - Combined
Porsche 718 Boxster GTS
4.0
0.32 1.98 m2 15.4- Urban
8.1- Extra Urban
10.8- Combined
Toyota Avalon Touring 0.27 72.8 m2 10.7 - Urban
7.6 - Extra Urban
9.4 - Combined
Ways to reduce Drag
As per the above derivation it is found that there are various techniques can be used to
reduce the fuel consumption. Some of the most common method that is used by the car
6
manufacturer is by reducing the mass of vehicle. Regenerative breaking can be really helpful in
saving energy. By reducing the speed of the vehicle drag force can be reduced. This are major
changes that can be used to in various factors apart from these process there are some other
process are their that can help to improve the fuel efficiency of the vehicle. These changes are
possible in alignment and structure of the vehicle to reduce the fuel consumption. These methods
are – By reducing the cross sectional area of vehicle pressure and area of contact cab be reduced.
Lower nose of the vehicle can lowered to make better aerodynamic structure (Terra, Sciacchitano
and Scarano, 2017). By reduce the area of surface friction due to air can be reduced. Smooth and
frictionless paints can be used to reduce the level of friction. By using spoiler in the vehicles can
help to reduce the drag by reducing the tube that consists of swirling air to focus on the pressure
areas of the vehicle.
CONCLUSION
This report is concluding the importance of the study of aerodynamic drag of various
vehicles that can affect the fuel efficiency. The structural factors that can increase the drag for
the vehicle also has been studied in the report. As per the understanding developed of factors that
can cause aerodynamic drag to vehicle, different changes has been suggested in order to improve
the fuel efficiency of vehicle. A derivation has been explained in report that can help to
understand their relationship with the drag and fuel efficiency and cross sectional area.
7
⊘ This is a preview!⊘
Do you want full access?
Subscribe today to unlock all pages.
Trusted by 1+ million students worldwide
REFERENCES
Books and Journals
Ageev, N. and Pavlenko, A., 2016. Minimization of body of revolution aerodynamic drag at
supersonic speeds. Aircraft Engineering and Aerospace Technology: An International
Journal.
Aschwanden, M.J. and Gopalswamy, N., 2019. Global energetics of solar flares. VII.
Aerodynamic drag in coronal mass ejections. The Astrophysical Journal. 877(2). p.149.
Merkes, P.F., Menaspà, P. and Abbiss, C.R., 2019. Reducing aerodynamic drag by adopting a
novel road-cycling sprint position. International journal of sports physiology and
performance. 14(6). pp.733-738.
Shim, H.S., Lee, Y.N. and Kim, K.Y., 2017. Optimization of bobsleigh bumper shape to reduce
aerodynamic drag. Journal of Wind Engineering and Industrial Aerodynamics. 164.
pp.108-118.
SkrucAny, T., SArkAn, B. and GnAp, J., 2016. Influence of aerodynamic trailer devices on drag
reduction measured in a wind tunnel. Eksploatacja i Niezawodność. 18(1).
Szmuk, M., Acikmese, B. and Berning, A.W., 2016. Successive convexification for fuel-optimal
powered landing with aerodynamic drag and non-convex constraints. In AIAA
Guidance, Navigation, and Control Conference (p. 0378).
Terra, W., Sciacchitano, A. and Scarano, F., 2017. Aerodynamic drag of a transiting sphere by
large-scale tomographic-PIV. Experiments in Fluids. 58(7). p.83.
8
1 out of 10
Related Documents


Your All-in-One AI-Powered Toolkit for Academic Success.
+13062052269
info@desklib.com
Available 24*7 on WhatsApp / Email
![[object Object]](/_next/static/media/star-bottom.7253800d.svg)
Unlock your academic potential
Copyright © 2020–2025 A2Z Services. All Rights Reserved. Developed and managed by ZUCOL.