Statistical Analysis of Earning, EOQ, and Inflation Report
VerifiedAdded on 2020/12/09
|18
|2545
|389
Report
AI Summary
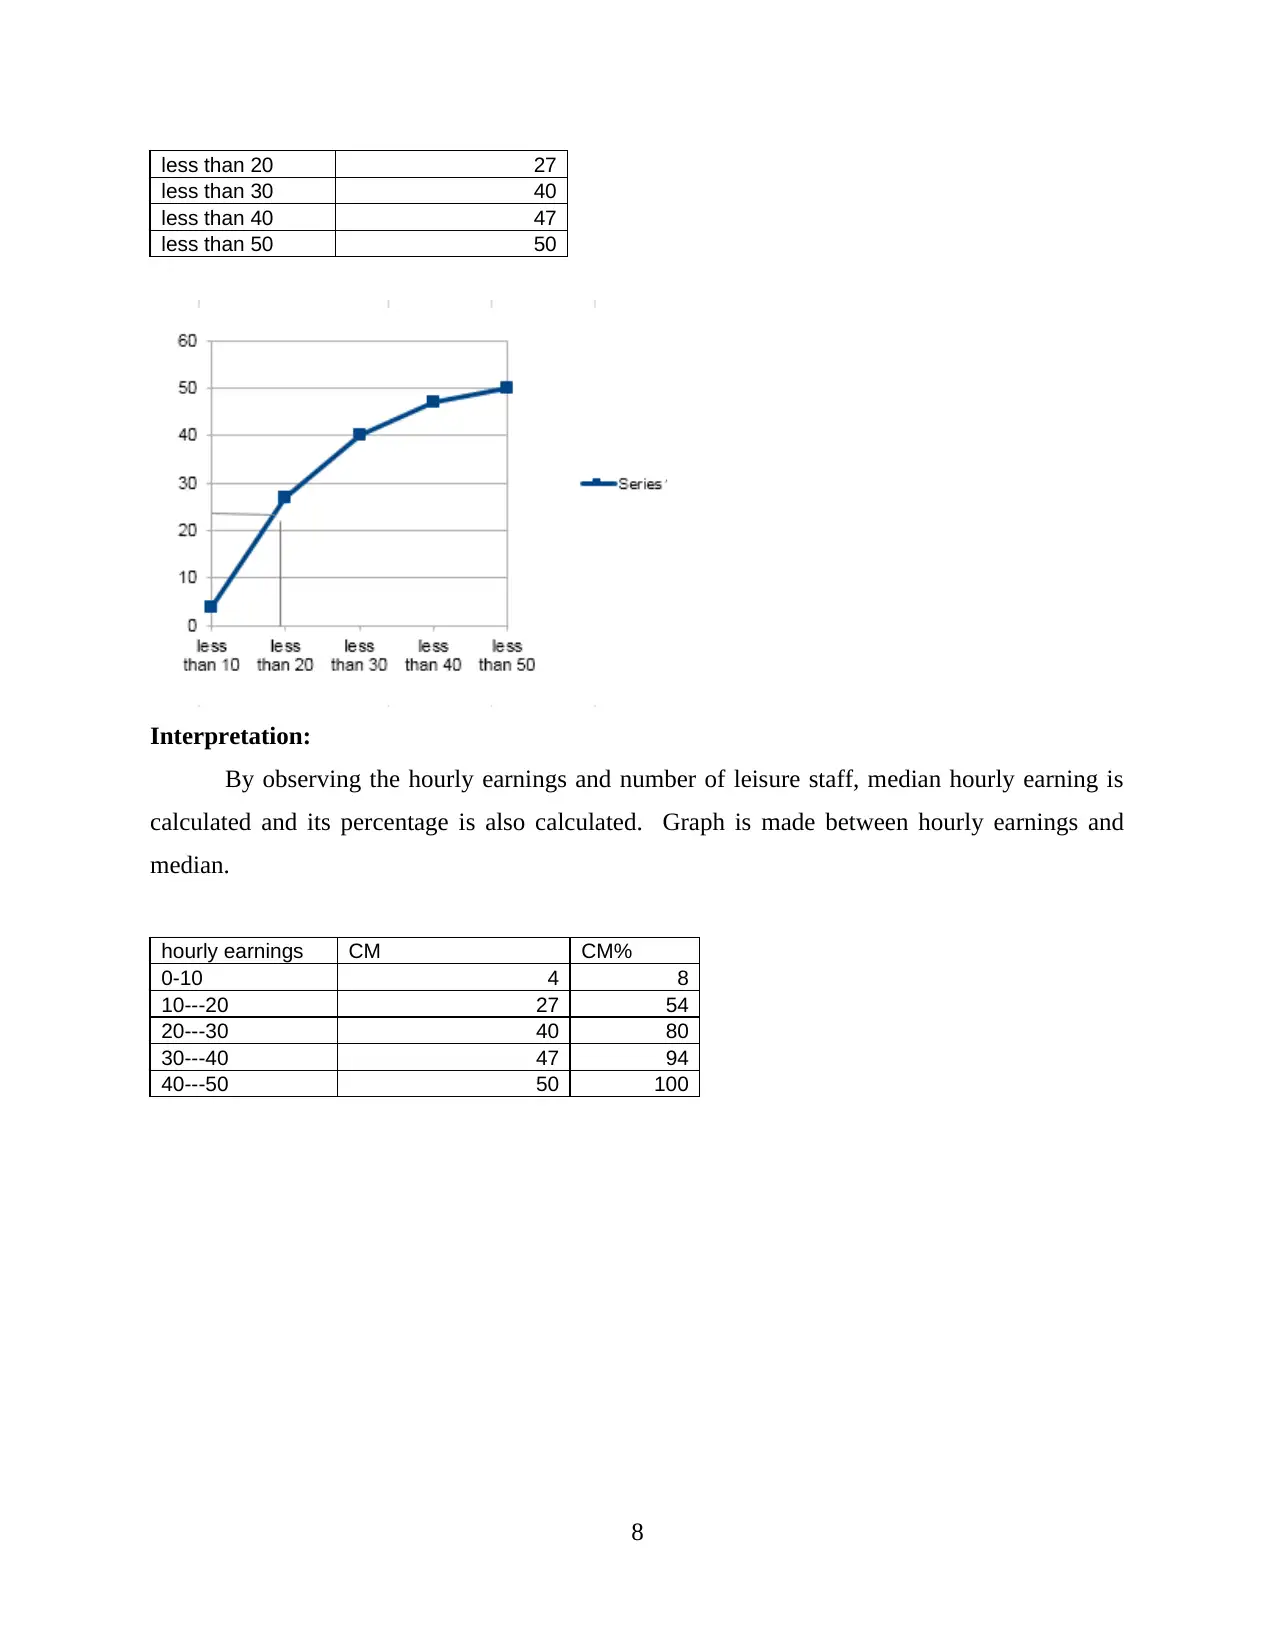
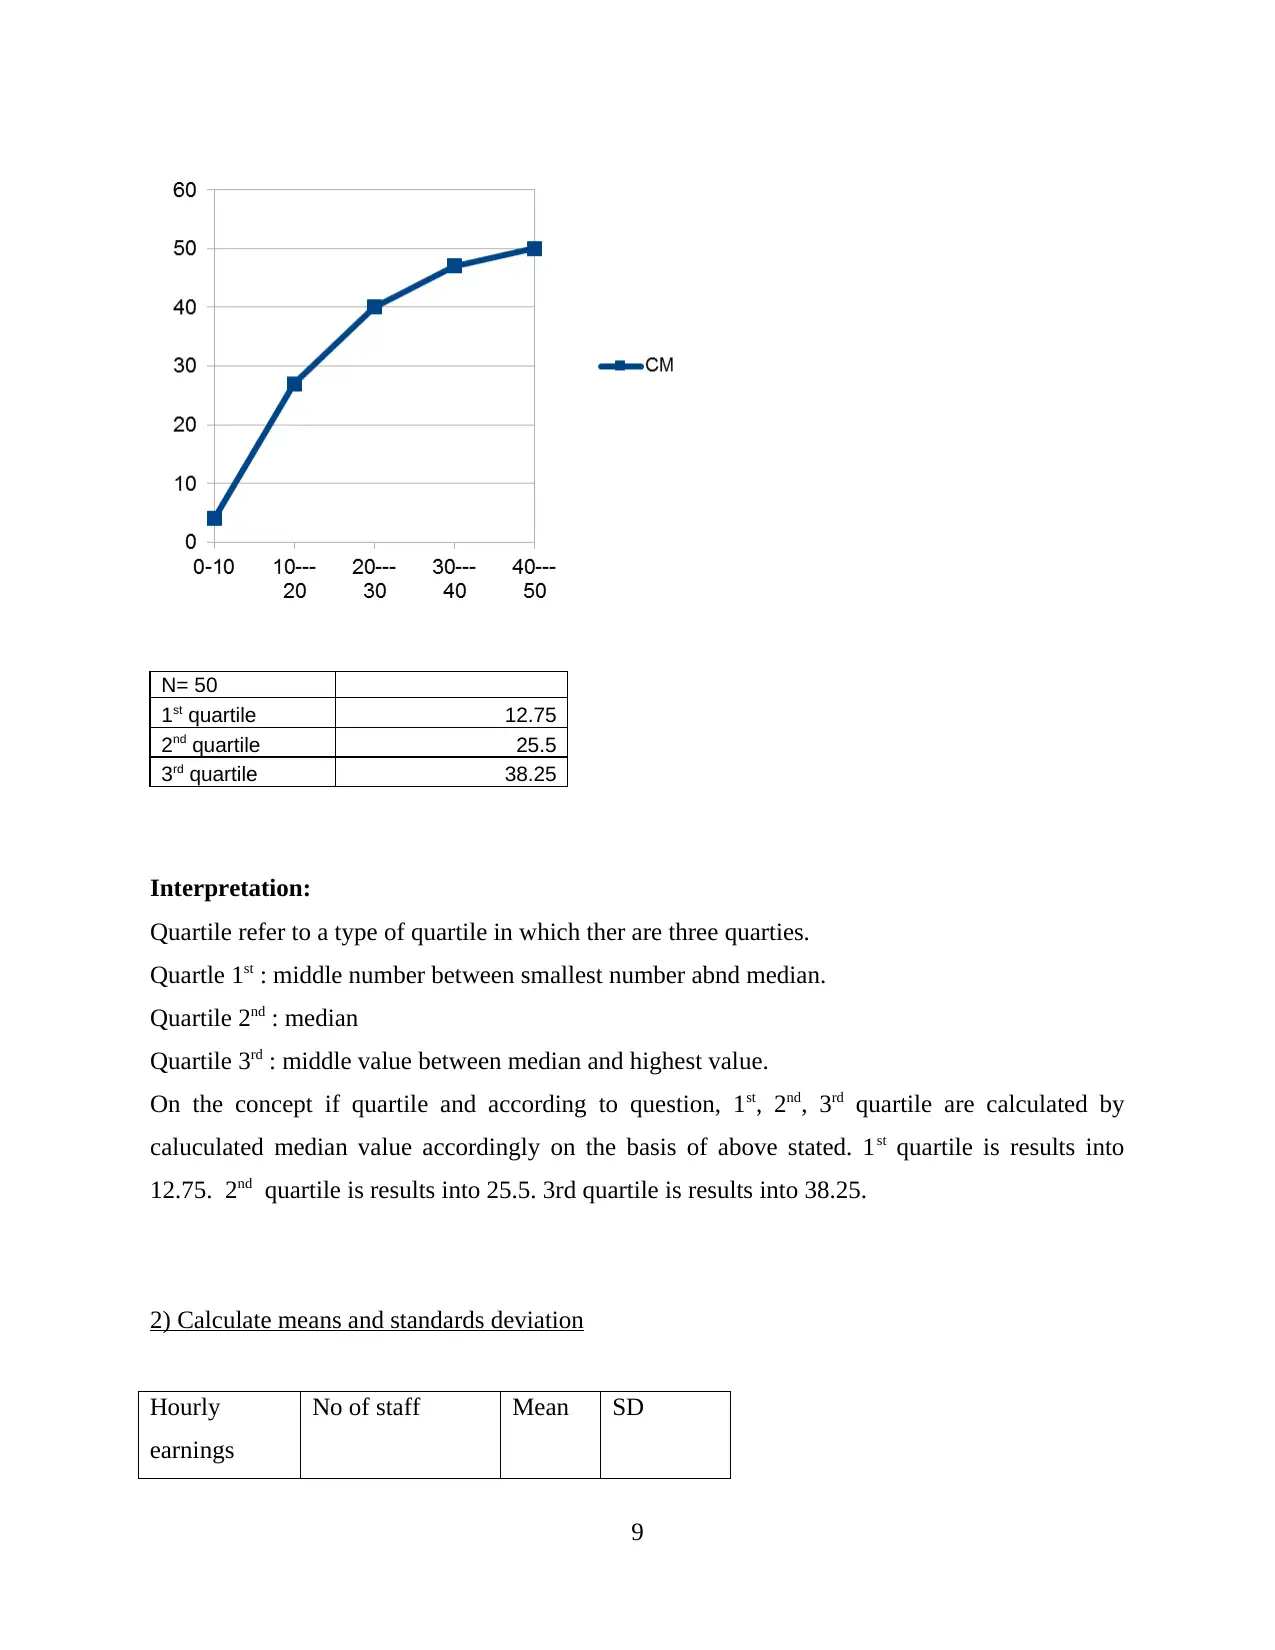
This report presents a comprehensive statistical analysis, encompassing earning comparisons between men and women in public and private sectors, utilizing SPSS and Chi-square tests to determine relationships and annual growth rates from 2009 to 2016. It also delves into calculating means, standard deviations, and quartiles for hourly earnings data, alongside an analysis of economic order quantity (EOQ), ordering costs, and safety stock levels. Furthermore, the report explores reorder levels and compares earnings data between London and Manchester, providing a detailed examination of statistical methods and their applications in business and economic contexts, including an analysis of inflation using RPI and CPI data.

ASSESSMENT
Paraphrase This Document
Need a fresh take? Get an instant paraphrase of this document with our AI Paraphraser

Table of Contents
INTRODUCTION...........................................................................................................................1
TASK 1............................................................................................................................................1
a) Determine if earning of men is different from women in public sector..................................1
b) Determine if earning of men in private sector is different from women.................................2
c) Earning time chart for each group for period 2009-2016........................................................3
d) Determine annual growth rate in earning of four groups........................................................6
LO 2.................................................................................................................................................6
2) Calculate means and standards deviation................................................................................8
TASK 3..........................................................................................................................................10
1. Economic order quantity (EOQ)............................................................................................10
4. Current level to customer......................................................................................................11
5.................................................................................................................................................11
TASK 4..........................................................................................................................................11
........12

CONCLUSION..............................................................................................................................12
REFERENCES..............................................................................................................................13
⊘ This is a preview!⊘
Do you want full access?
Subscribe today to unlock all pages.

Trusted by 1+ million students worldwide

INTRODUCTION
Statistics is a branch of applied mathematics which is related to the collecting, organizing
and interpreting of data. This data is represented in form of graphs. Statistics is also study of
probability of event occurring which is based on the known quantitative or collected data. In the
statics the by examine the large size of data by process it to found the patterns to predict the
result of huge amount of data. There are three types of averages used in the statistics which are
mean, median and mode. The economic data and information obtained from the different sources
is evaluated the nature and process of the business. The appropriate methods of statistics are used
to analyze the raw business data to full fill the requirement. The different methods of statistics
are used in business planning. The data calculated is communicated by using the relevant charts
and tabels.
TASK 1
a) Determine if earning of men is different from women in public sector
To determine relationship in earning of men and women in public sector, SPSS is been
used. In this Chi square test is applied. From SPSS the results obtained are described below :-
Case Processing Summary
Cases
Valid Missing Total
N Perce
nt
N Perce
nt
N Perce
nt
meninpublic *
womeninpublic 8 100.0
% 0 0.0% 8 100.0
%
Chi-Square Tests
Value df Asymp. Sig.
(2-sided)
Pearson Chi-
Square
56.00
0a 49 .229
Likelihood
Ratio
33.27
1 49 .958
N of Valid
Cases 8
1
Paraphrase This Document
Need a fresh take? Get an instant paraphrase of this document with our AI Paraphraser

a. 64 cells (100.0%) have expected count
less than 5. The minimum expected count
is .13.
By interpreting the above table value significant value of P obtained is .229 which is
higher than P =0.05. Hence, H1 that is alternative hypothesis is accepted. It can be stated that
there is significant relationship between men and women in earning in public sector.
b) Determine if earning of men in private sector is different from women
Case Processing Summary
Cases
Valid Missing Total
N Perce
nt
N Perce
nt
N Perce
nt
meninprivate *
womeninprivat
e
8 100.0
% 0 0.0% 8 100.0
%
Chi-Square Tests
Value df Asymp. Sig.
(2-sided)
Pearson Chi-
Square
56.00
0a 49 .229
Likelihood
Ratio
33.27
1 49 .958
Linear-by-
Linear
Association
5.715 1 .017
N of Valid
Cases 8
a. 64 cells (100.0%) have expected count
less than 5. The minimum expected count
is .13.
2
less than 5. The minimum expected count
is .13.
By interpreting the above table value significant value of P obtained is .229 which is
higher than P =0.05. Hence, H1 that is alternative hypothesis is accepted. It can be stated that
there is significant relationship between men and women in earning in public sector.
b) Determine if earning of men in private sector is different from women
Case Processing Summary
Cases
Valid Missing Total
N Perce
nt
N Perce
nt
N Perce
nt
meninprivate *
womeninprivat
e
8 100.0
% 0 0.0% 8 100.0
%
Chi-Square Tests
Value df Asymp. Sig.
(2-sided)
Pearson Chi-
Square
56.00
0a 49 .229
Likelihood
Ratio
33.27
1 49 .958
Linear-by-
Linear
Association
5.715 1 .017
N of Valid
Cases 8
a. 64 cells (100.0%) have expected count
less than 5. The minimum expected count
is .13.
2

Here, by analysing above table it is analysed that significant value obtained is P = .229
which is higher than P= 0.05. Thus, alternative hypothesis is accepted. It can be evaluated that
there is significant relationship between earning of men and women in private sector.
So, from both table it is interpreted that men and women earning in private and public
sector is having relationship with one another. So, if there is rise in annual income of women
than men incomes also rises with same proportion. Similarly, if there is decline in annual income
of women it also decreases men income.
c) Earning time chart for each group for period 2009-2016
Time
Men in
public
2009 30368
2010 31264
2011 31380
2012 31816
2013 32541
2014 32878
2015 33685
2016 34011
3
⊘ This is a preview!⊘
Do you want full access?
Subscribe today to unlock all pages.

Trusted by 1+ million students worldwide

Time
Men in
private
2009 27632
2010 27000
2011 27233
2012 27705
2013 28201
2014 28442
2015 28881
2016 29679
4
Men in
private
2009 27632
2010 27000
2011 27233
2012 27705
2013 28201
2014 28442
2015 28881
2016 29679
4
Paraphrase This Document
Need a fresh take? Get an instant paraphrase of this document with our AI Paraphraser

Time
Women
in
public
2009 25224
2010 26113
2011 26470
2012 26663
2013 27338
2014 27705
2015 27900
2016 28053
5
Women
in
public
2009 25224
2010 26113
2011 26470
2012 26663
2013 27338
2014 27705
2015 27900
2016 28053
5

Time
Women
in
private
2009 19551
2010 19532
2011 19565
2012 20313
2013 20698
2014 21017
2015 21403
2016 22251
6
Women
in
private
2009 19551
2010 19532
2011 19565
2012 20313
2013 20698
2014 21017
2015 21403
2016 22251
6
⊘ This is a preview!⊘
Do you want full access?
Subscribe today to unlock all pages.

Trusted by 1+ million students worldwide

d) Determine annual growth rate in earning of four groups
The annual earnings growth rate of four groups are as follows :-
Men in public – 4.55%
Men in private – 2.55%
Women in public – 3.53%
Women in private – 3.37%
Thus, it can be evaluated that annual growth rate of men and women is higher in public
sector with comparison with private one. But in private women is having more annual growth
rate as compared to men. Here, there is decline in salary every year.
TASK 2
1)
hourly earnings
no. of leisure centre
staff CM CM%
0-10 4 4 8
10---20 23 27 54
20---30 13 40 80
30---40 7 47 94
40---50 3 50 100
50
CM
less than 10 4
7
Paraphrase This Document
Need a fresh take? Get an instant paraphrase of this document with our AI Paraphraser

less than 20 27
less than 30 40
less than 40 47
less than 50 50
Interpretation:
By observing the hourly earnings and number of leisure staff, median hourly earning is
calculated and its percentage is also calculated. Graph is made between hourly earnings and
median.
hourly earnings CM CM%
0-10 4 8
10---20 27 54
20---30 40 80
30---40 47 94
40---50 50 100
8

N= 50
1st quartile 12.75
2nd quartile 25.5
3rd quartile 38.25
Interpretation:
Quartile refer to a type of quartile in which ther are three quarties.
Quartle 1st : middle number between smallest number abnd median.
Quartile 2nd : median
Quartile 3rd : middle value between median and highest value.
On the concept if quartile and according to question, 1st, 2nd, 3rd quartile are calculated by
caluculated median value accordingly on the basis of above stated. 1st quartile is results into
12.75. 2nd quartile is results into 25.5. 3rd quartile is results into 38.25.
2) Calculate means and standards deviation
Hourly
earnings
No of staff Mean SD
9
⊘ This is a preview!⊘
Do you want full access?
Subscribe today to unlock all pages.

Trusted by 1+ million students worldwide
1 out of 18