Numeracy and Data Analysis: Electricity Bill Project
VerifiedAdded on 2023/01/11
|12
|1554
|47
Report
AI Summary
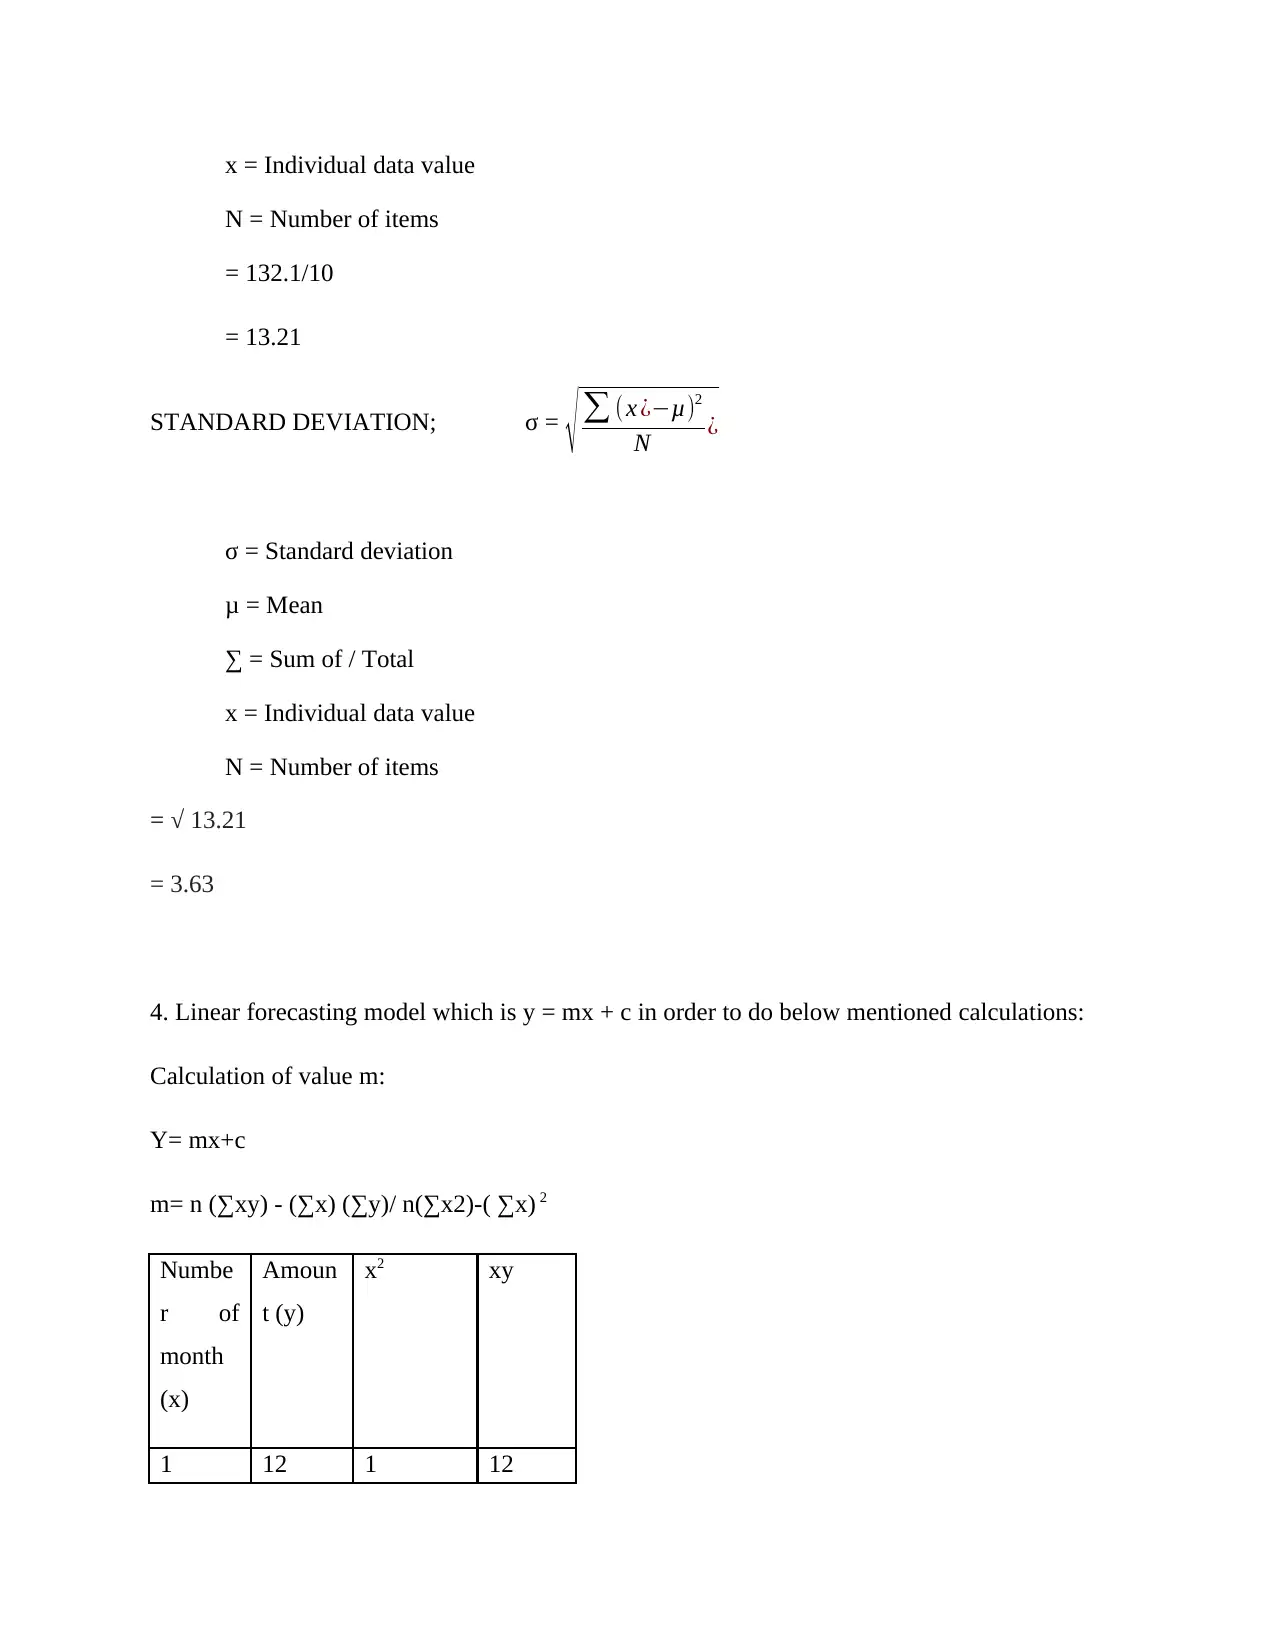
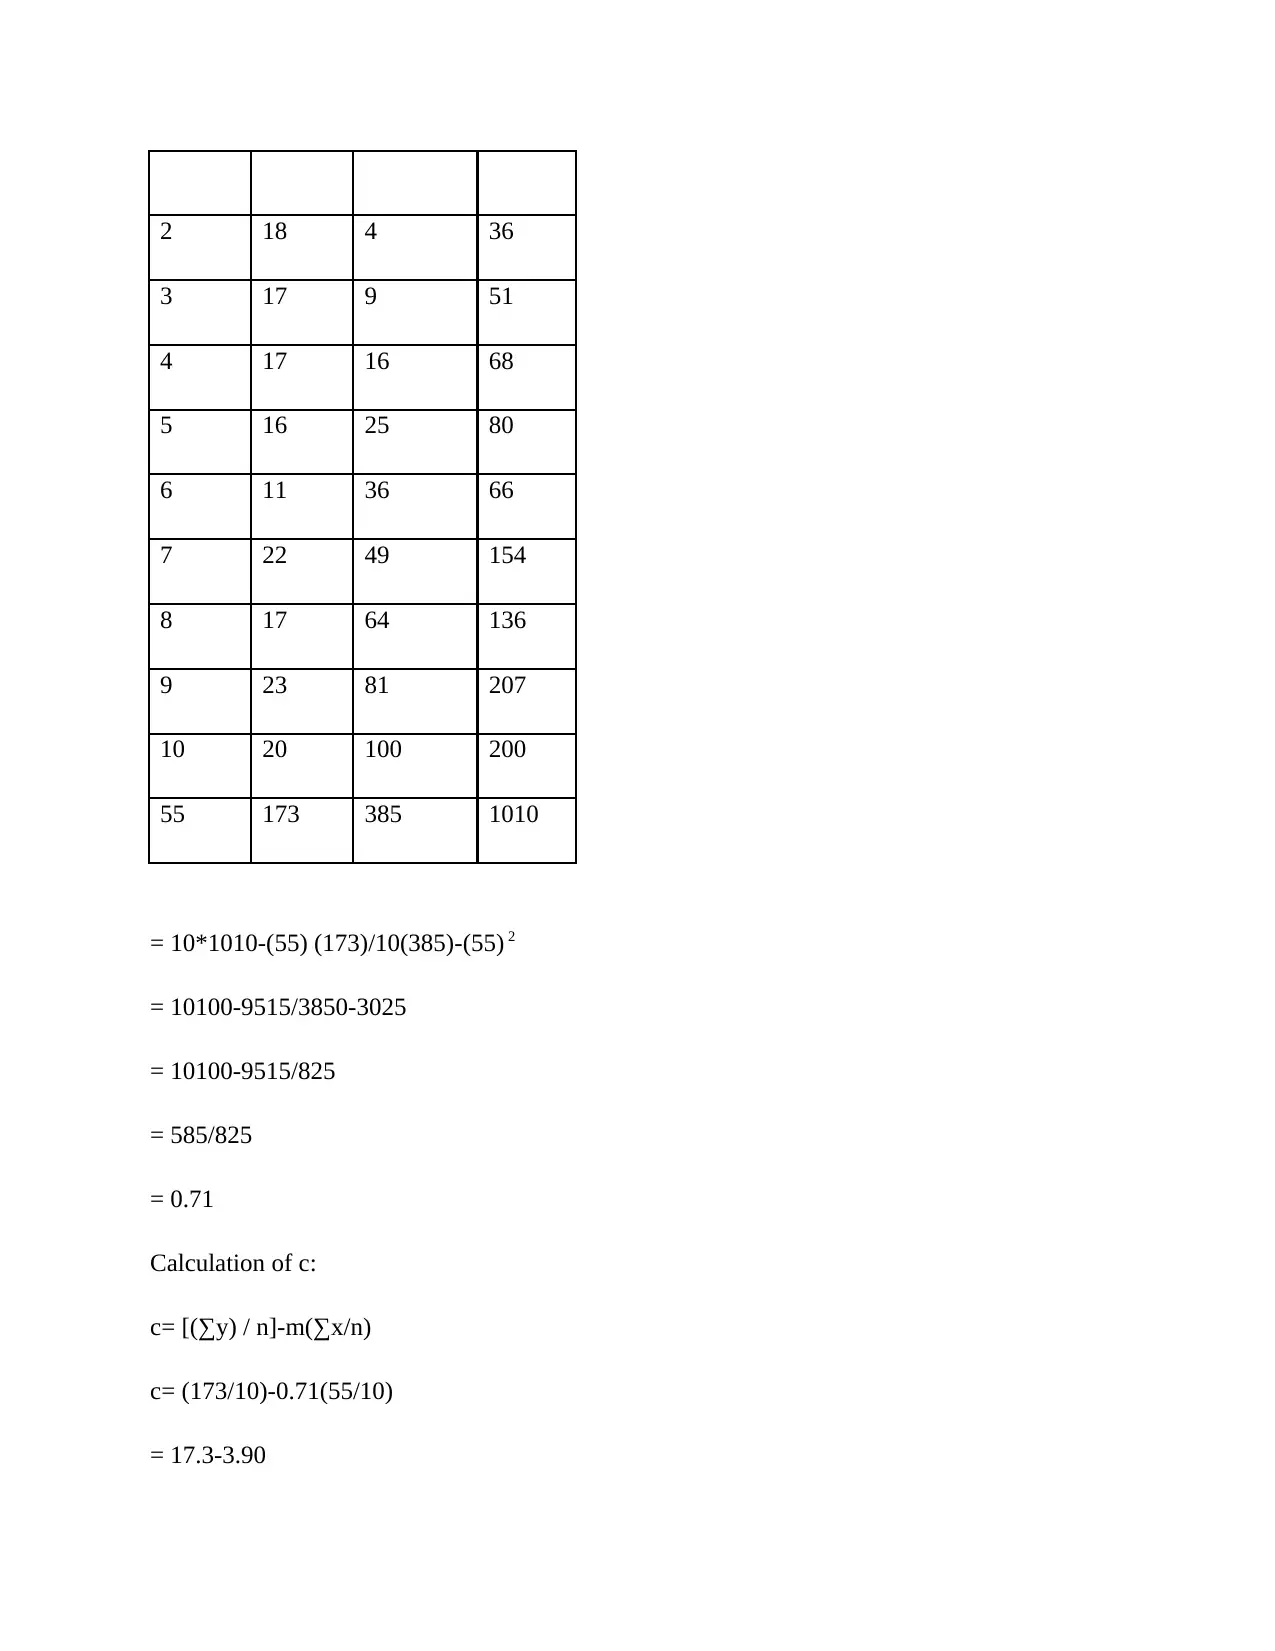
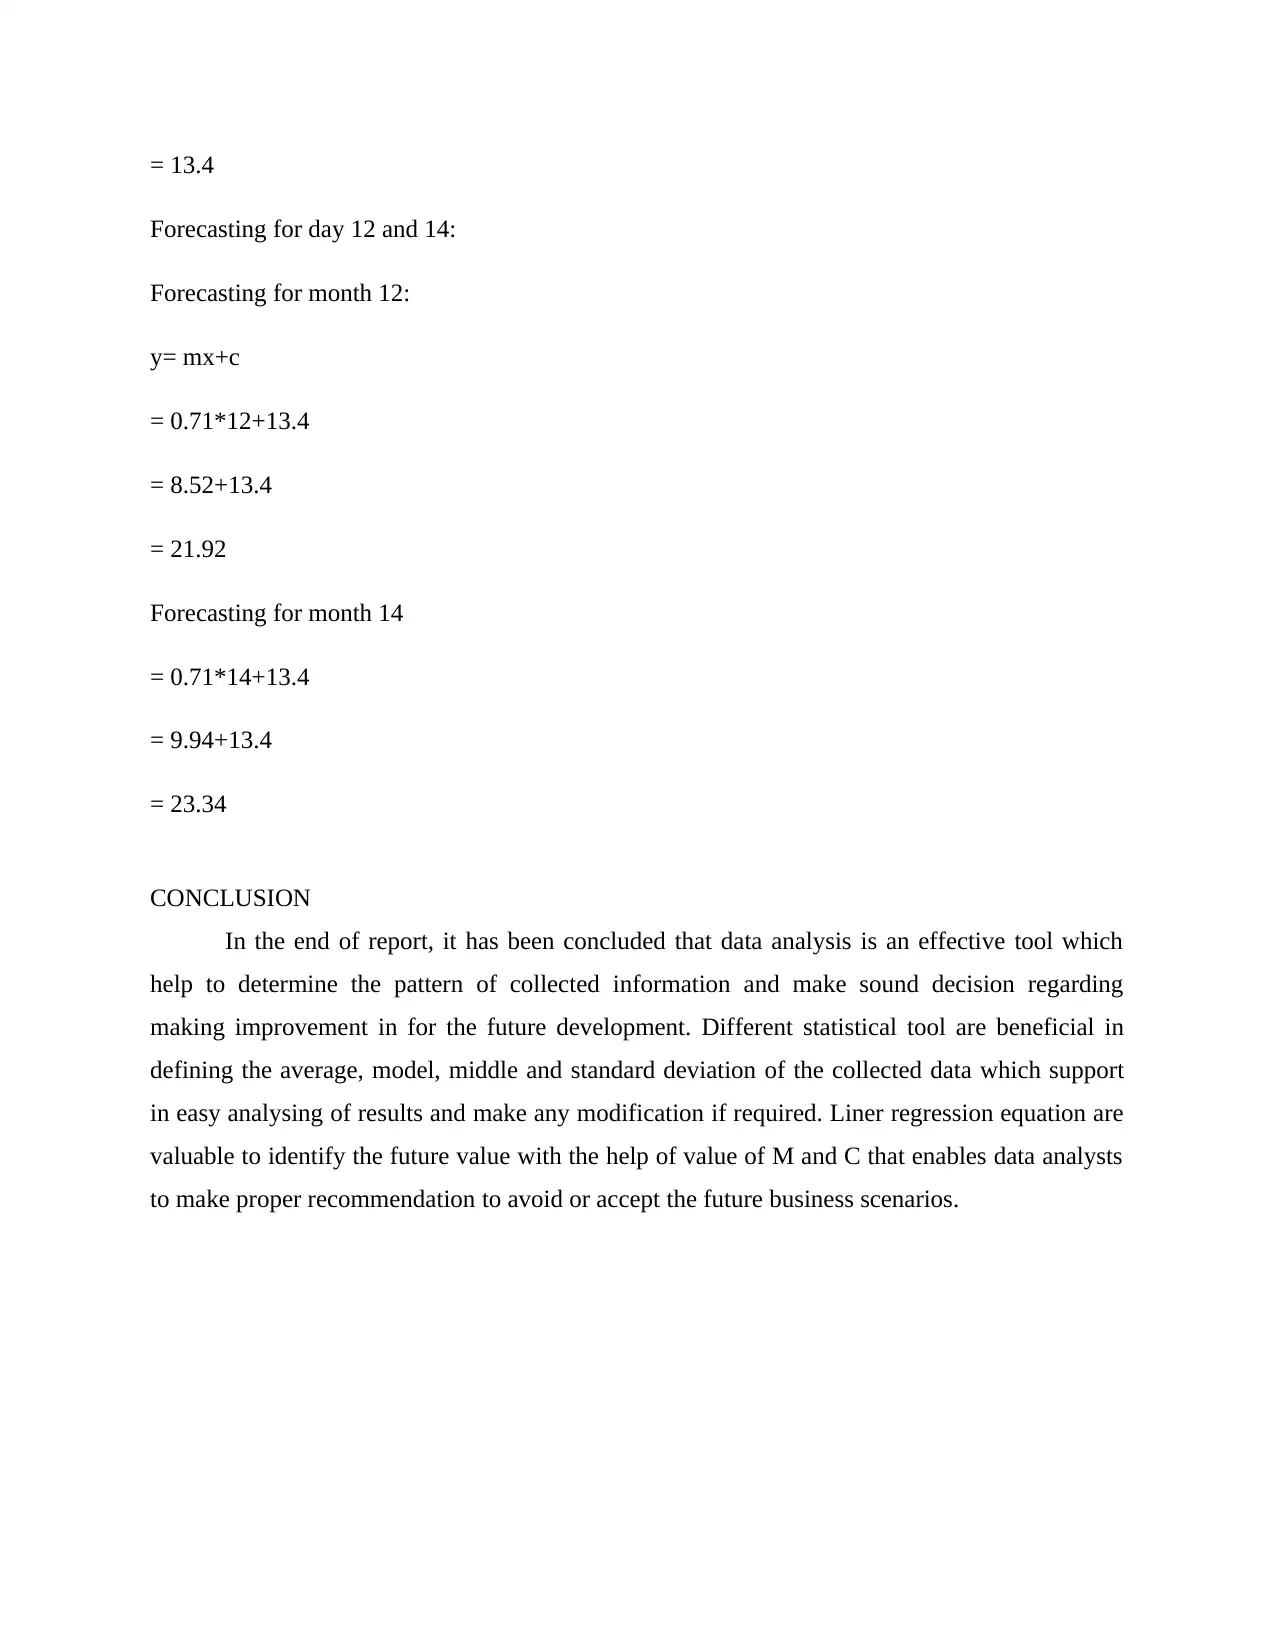
This report presents a data analysis of electricity bills, covering various aspects of data handling and interpretation. The analysis begins with the arrangement of bill data in a tabular format, followed by the presentation of this data using line and bar charts for visual representation. The report then delves into statistical calculations, including the mean, mode, median, range, and standard deviation of the bill amounts. Furthermore, a linear forecasting model (y = mx + c) is employed to predict future bill values, with calculations for the slope (m) and intercept (c) of the model. The report concludes with forecasted values for specific months, providing insights into potential future electricity costs and demonstrating the practical application of data analysis techniques.

1 out of 12
Related Documents


Your All-in-One AI-Powered Toolkit for Academic Success.
+13062052269
info@desklib.com
Available 24*7 on WhatsApp / Email
![[object Object]](/_next/static/media/star-bottom.7253800d.svg)
Copyright © 2020–2026 A2Z Services. All Rights Reserved. Developed and managed by ZUCOL.