Detailed Financial Analysis: ASX and Computershare Limited Performance
VerifiedAdded on 2022/10/12
|9
|2845
|21
Homework Assignment
AI Summary
This assignment analyzes the financial performance of the Australian Securities Exchange (ASX) and Computershare Limited (CPU), comparing their Earnings Per Share (EPS), Dividends Per Share (DPS), and Total Shareholder Return (TSR) from 2020 to 2021. The analysis reveals that both companies experienced drops in EPS and DPS, attributed to the COVID-19 pandemic. The assignment also includes calculations for car and housing loans, exploring scenarios such as early loan repayment and refinancing options. The student calculates future values, present values, and new monthly installments, demonstrating an understanding of financial concepts and their application in real-world scenarios. Furthermore, the assignment evaluates dividend payout ratios and offers insights into investment decisions based on the comparative performance of ASX and CPU.
FIN20014 Assignment 1 Set A
Part A
Australian Securities Exchange (ASX)known as
Australia’s primary securities exchange. It is a
market operator, clearing house and payments
system facilitator. Computershare Limited (CPU)
known as an Australian stock transfer company that
provide various of services.
ASX was formed in 1 April 1987after the Australian Parliament enabled the
amalgamation of six independent state-based stock exchange by drafting the ligislation. The
Australian Stock Exchange merged with the Sydney Future Exchange and operated under the
name Australian Securities Exchange (ASX) in 2006.ASX is regulated by ASIC, under
control of Corporation Acts and its own listing rules. As a market operator, ASX provides
various of services such as securities exchange services, derivatives exchange services,
market data services, investor education courses and others.Entities can raise their capital and
have their securities publicly traded by listing on ASX. ASX also lists debts that including
bonds and exchange-traded investment products. Until now, up to 2,200 of entities around the
world are listed on ASX since the ASX formed in 1987.
In 1978, Computershare Limited (CPU) was founded in Melbourne and acquire the
business of Harris Bank in Chicago then entered U.S. market in 200, become the foremost
transfer agent and investor services provider in the world. CPU became a public traded
company on 12 April 1994. CPU provides various of services to public which is Issuer
services, Mortgage services& Property Rental Services, Business Services, Employee Share
Plans & Voucher Services, Technology Services, Communication Services and Utilities
operations.
The reason that I choose ASX and CPU as the research of my assignment is because
this 2 companies both provide services in the related field. It will help me to compare the
performance of these 2 companies in a clearer way by using the data analysis. Using the
analysis, I able to observe which company will have a better performance, better return and
able to make decision on which companies should shareholders invest by compare the
Earning per Share, Total Dividend and the Total Shareholder’s Return of these 2 companies.
ASX CPU
2020 2021 2020 2021
[ASX][CPU] 10 September 2021
Paraphrase This Document
Need a fresh take? Get an instant paraphrase of this document with our AI Paraphraser
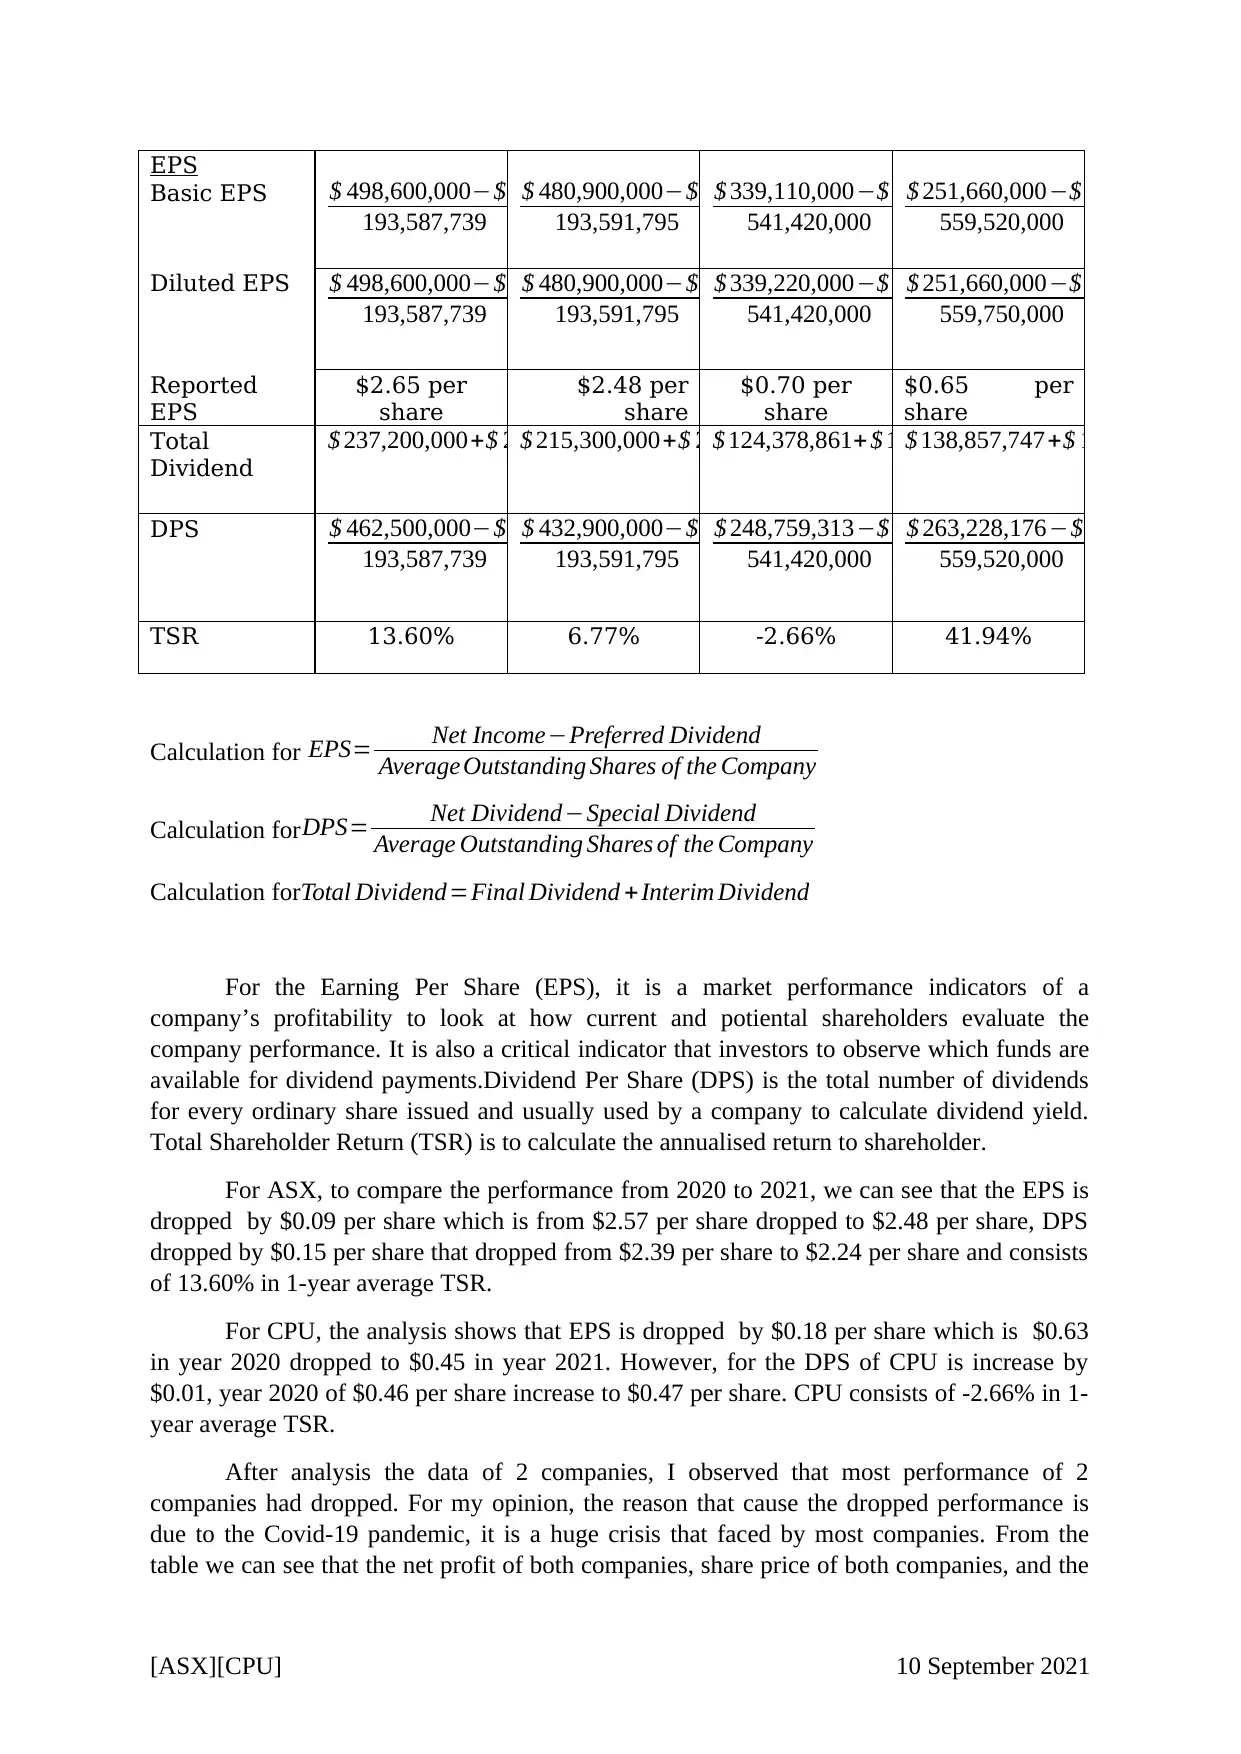
EPS
Basic EPS $ 498,600,000−$ 0
193,587,739 =$ 2.57 per share
$ 480,900,000−$ 0
193,591,795 =$ 2.48 per share
$ 339,110,000−$ 0
541,420,000 =$ 0.63 per share
$ 251,660,000−$ 0
559,520,000 =$ 0.45 per sh
Diluted EPS $ 498,600,000−$ 0
193,587,739 =$ 2.57 per share
$ 480,900,000−$ 0
193,591,795 =$ 2.48 per share
$ 339,220,000−$ 0
541,420,000 =$ 0.63 per share
$ 251,660,000−$ 0
559,750,000 =$ 0.45 per sh
Reported
EPS
$2.65 per
share
$2.48 per
share
$0.70 per
share
$0.65 per
share
Total
Dividend
$ 237,200,000+$ 225,300,000=$ 462,500,000$ 215,300,000+$ 217,600,000=$ 432,900,000$ 124,378,861+ $ 124,380,452=$ 248,759,313$ 138,857,747+$ 124,370,429=$
DPS $ 462,500,000−$ 0
193,587,739 =$ 2.39 per share
$ 432,900,000−$ 0
193,591,795 =$ 2.24 per share
$ 248,759,313−$ 0
541,420,000 =$ 0.46 per share
$ 263,228,176−$ 0
559,520,000 =$ 0.47 per sh
TSR 13.60% 6.77% -2.66% 41.94%
Calculation for EPS= Net Income−Preferred Dividend
Average Outstanding Shares of the Company
Calculation forDPS= Net Dividend−Special Dividend
Average Outstanding Shares of the Company
Calculation forTotal Dividend=Final Dividend + Interim Dividend
For the Earning Per Share (EPS), it is a market performance indicators of a
company’s profitability to look at how current and potiental shareholders evaluate the
company performance. It is also a critical indicator that investors to observe which funds are
available for dividend payments.Dividend Per Share (DPS) is the total number of dividends
for every ordinary share issued and usually used by a company to calculate dividend yield.
Total Shareholder Return (TSR) is to calculate the annualised return to shareholder.
For ASX, to compare the performance from 2020 to 2021, we can see that the EPS is
dropped by $0.09 per share which is from $2.57 per share dropped to $2.48 per share, DPS
dropped by $0.15 per share that dropped from $2.39 per share to $2.24 per share and consists
of 13.60% in 1-year average TSR.
For CPU, the analysis shows that EPS is dropped by $0.18 per share which is $0.63
in year 2020 dropped to $0.45 in year 2021. However, for the DPS of CPU is increase by
$0.01, year 2020 of $0.46 per share increase to $0.47 per share. CPU consists of -2.66% in 1-
year average TSR.
After analysis the data of 2 companies, I observed that most performance of 2
companies had dropped. For my opinion, the reason that cause the dropped performance is
due to the Covid-19 pandemic, it is a huge crisis that faced by most companies. From the
table we can see that the net profit of both companies, share price of both companies, and the
[ASX][CPU] 10 September 2021
divident paid of ASX dropped. Since the pandemic already happened, the management of
both companies should find a way to minimize the lost of company to maintain the
performance of the company as the drop of EPS will affect the health of company and will
lower the shareholder retun. However, company can reduce unnecessary expenses or share
issued to increase the EPS.
For ASX and CPU have their own good performance in the year. Compare between
the 2 companies, the EPS of of ASX is higher $2.03 per share than CPU in the year of 2021.
The DPS of ASX is also higher than CPU by $1.77 per share. From the statement above, we
can observe that the net profit for the year 2020 to 2021 of two companies dropped but two
companies offered more shares, so can believe that this is one of the reason the EPS of 2
companies dropped. For that dividend, ASX dividend paid out is higher than CPU by $1.77
per share. For my opinion, I feel shareholders and investor will more willing to invest at ASX
instead of CPU as the average performance of ASX is higher than CPU. To observe the
company performance health, I also calculate the dividend payout ratio for both companies to
determine whether the company is try to stable the ratio as if the ratio is too high, the
percentage of the company’s profits are being reinvested for future operation will be very
small then affect the company’s ability to maintain high divident payments in the future. The
divident payout ratio can be calculated by Annual Dividends per Share
Earnings per Share , we can observe that
the payout ratio for CPU is no stable which their ratio increase from 73% to 104% but ASX
maintain their ratio between 90%-100%. Although we can see that 104% divend is high, but
it is not good for a company for long term as company may not enough pofit to cover the
dividend in the future. The TSR in 1-year average of ASX is higher than CPU 16.26%, but
for TSR in 3-year average CPU is higher than ASX by 35.17%..
[ASX][CPU] 10 September 2021
⊘ This is a preview!⊘
Do you want full access?
Subscribe today to unlock all pages.
Trusted by 1+ million students worldwide
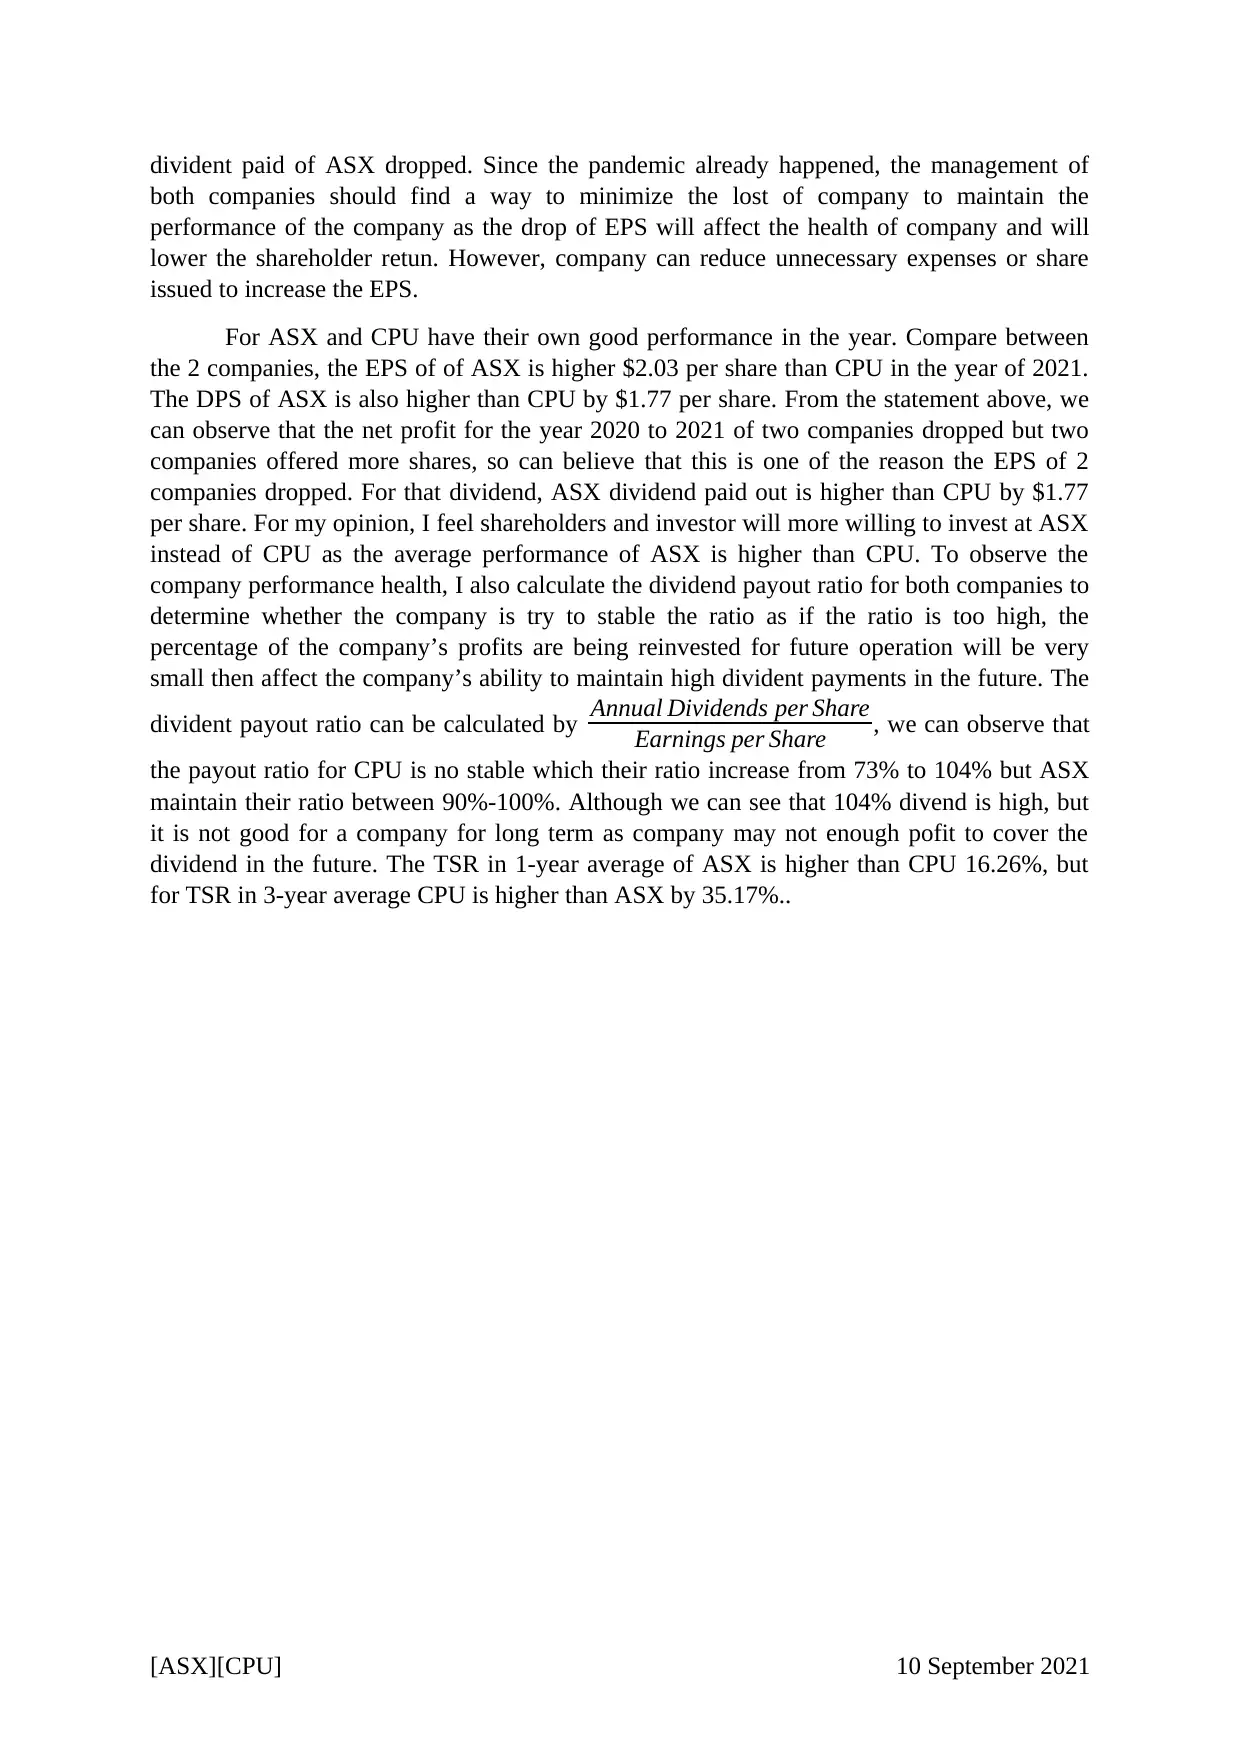
Part B
1.
Firstly, we need to calculate the Future Value (FV) of the car loan after 2 years after
by using financial calculator to know that the value for current years as Stephane had
bought a car 2 years ago.
FV after 2 years
PV = $36,000
($36,000 is get by using the cost of car
$40,000 and deduct by the 10% of
downpayment [$40,000 x 10%] )
I/YR = 3% / 12
= 0.25%
N = 2 x 12 months
= 60 months
PMT = $718
:. FV = $55,959.88
Therefore, we can know that the current value is $55,959.88.
After that, we need to calculate the FV after 5 years to show that the total amounts
that included interest Stephane have to pay.
FV after 5 years
PV = $36,000
I/YR = 3% / 12
= 0.25%
N = 5 x 12 months
= 60 months
PMT = $718
:. FV = $88,234.54
Therefore, we can know that the Future Value (FV) after 5 years is $88,234.54.
However, Stephane interest to top up her car monthly instalment by $1,500 which
mean that Stephane will pay $2,218 [$1,500 + $718] per month. So, we can calculate
the remaining month to clear her can loan by using new payment (PMT) in our
calculation.
[ASX][CPU] 10 September 2021
0 2 5
$36,000
$40,0000 – ($40,000 x 10%)
= $36,000
$55,959 $88,234
Year
Paraphrase This Document
Need a fresh take? Get an instant paraphrase of this document with our AI Paraphraser
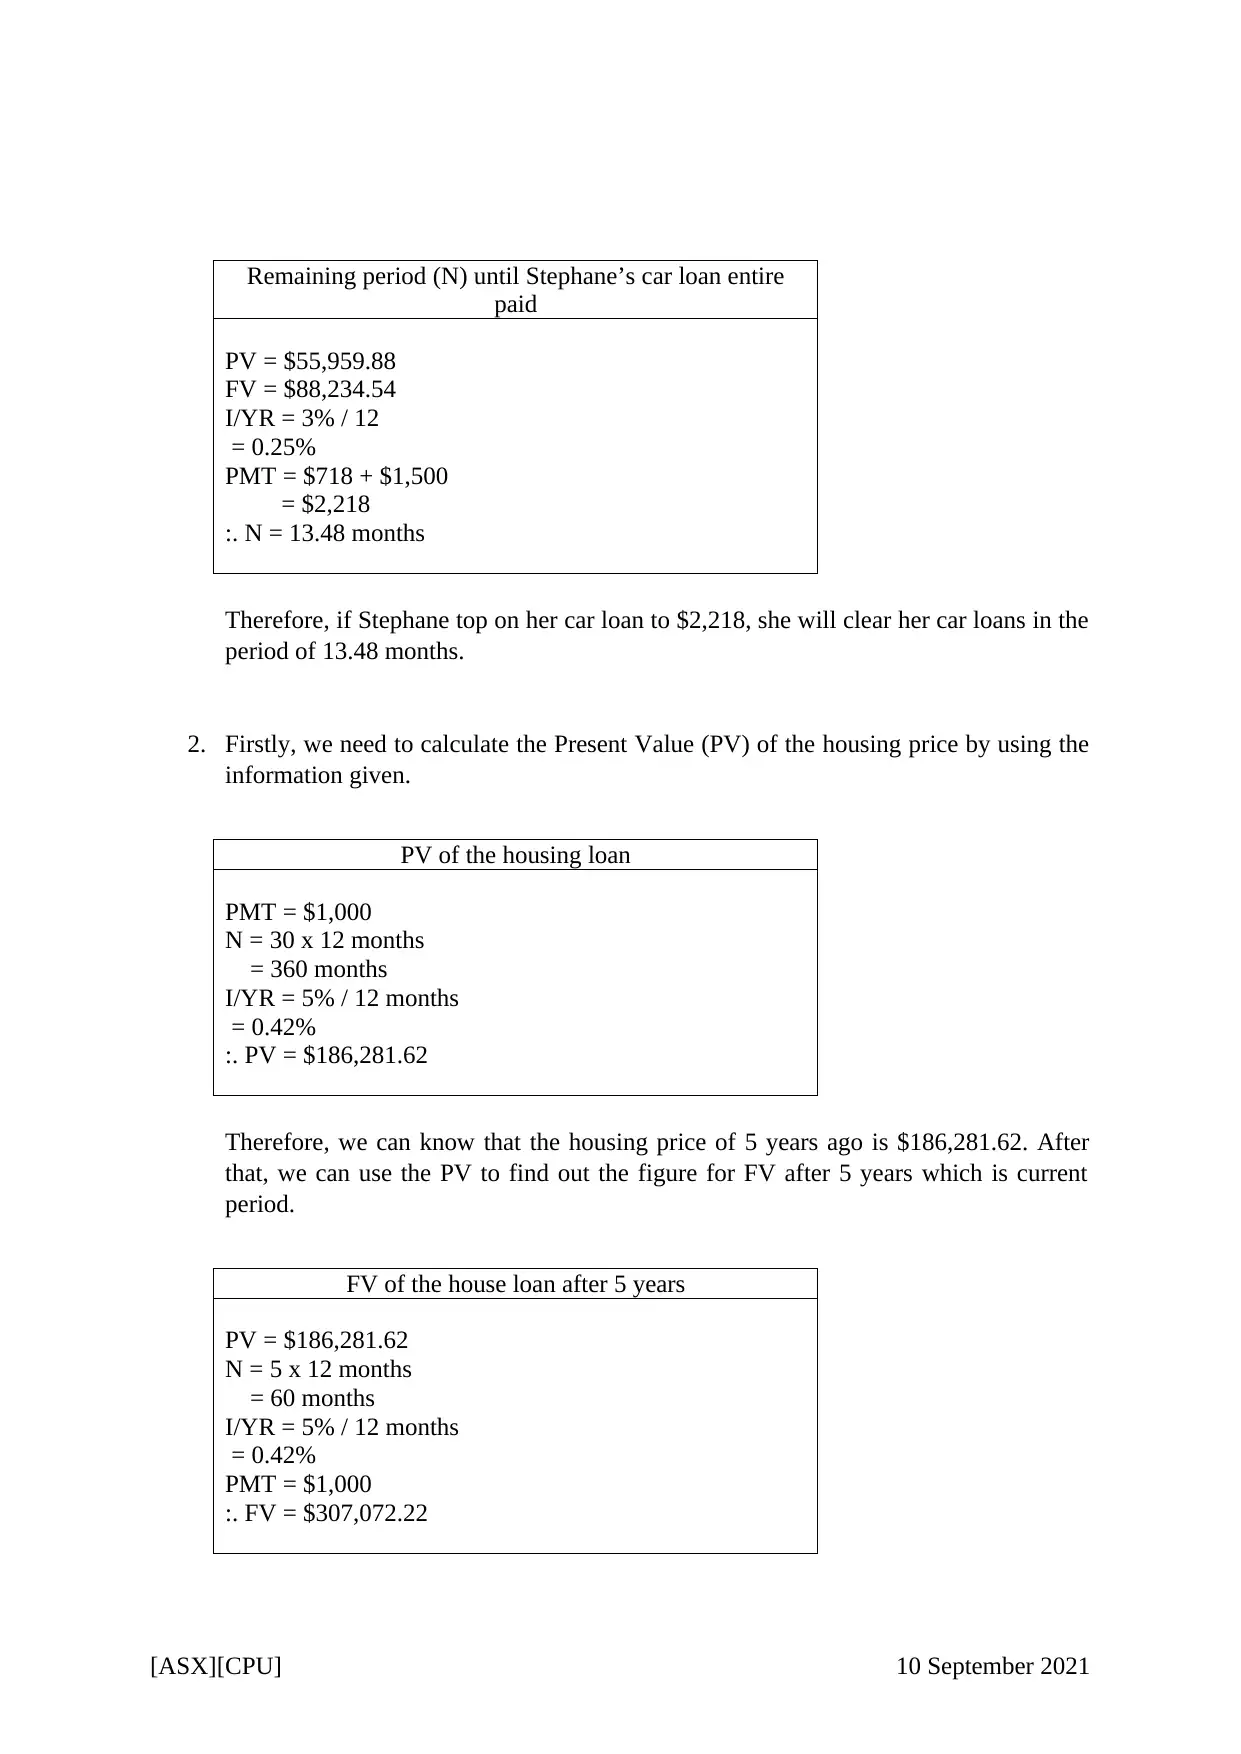
Remaining period (N) until Stephane’s car loan entire
paid
PV = $55,959.88
FV = $88,234.54
I/YR = 3% / 12
= 0.25%
PMT = $718 + $1,500
= $2,218
:. N = 13.48 months
Therefore, if Stephane top on her car loan to $2,218, she will clear her car loans in the
period of 13.48 months.
2. Firstly, we need to calculate the Present Value (PV) of the housing price by using the
information given.
PV of the housing loan
PMT = $1,000
N = 30 x 12 months
= 360 months
I/YR = 5% / 12 months
= 0.42%
:. PV = $186,281.62
Therefore, we can know that the housing price of 5 years ago is $186,281.62. After
that, we can use the PV to find out the figure for FV after 5 years which is current
period.
FV of the house loan after 5 years
PV = $186,281.62
N = 5 x 12 months
= 60 months
I/YR = 5% / 12 months
= 0.42%
PMT = $1,000
:. FV = $307,072.22
[ASX][CPU] 10 September 2021
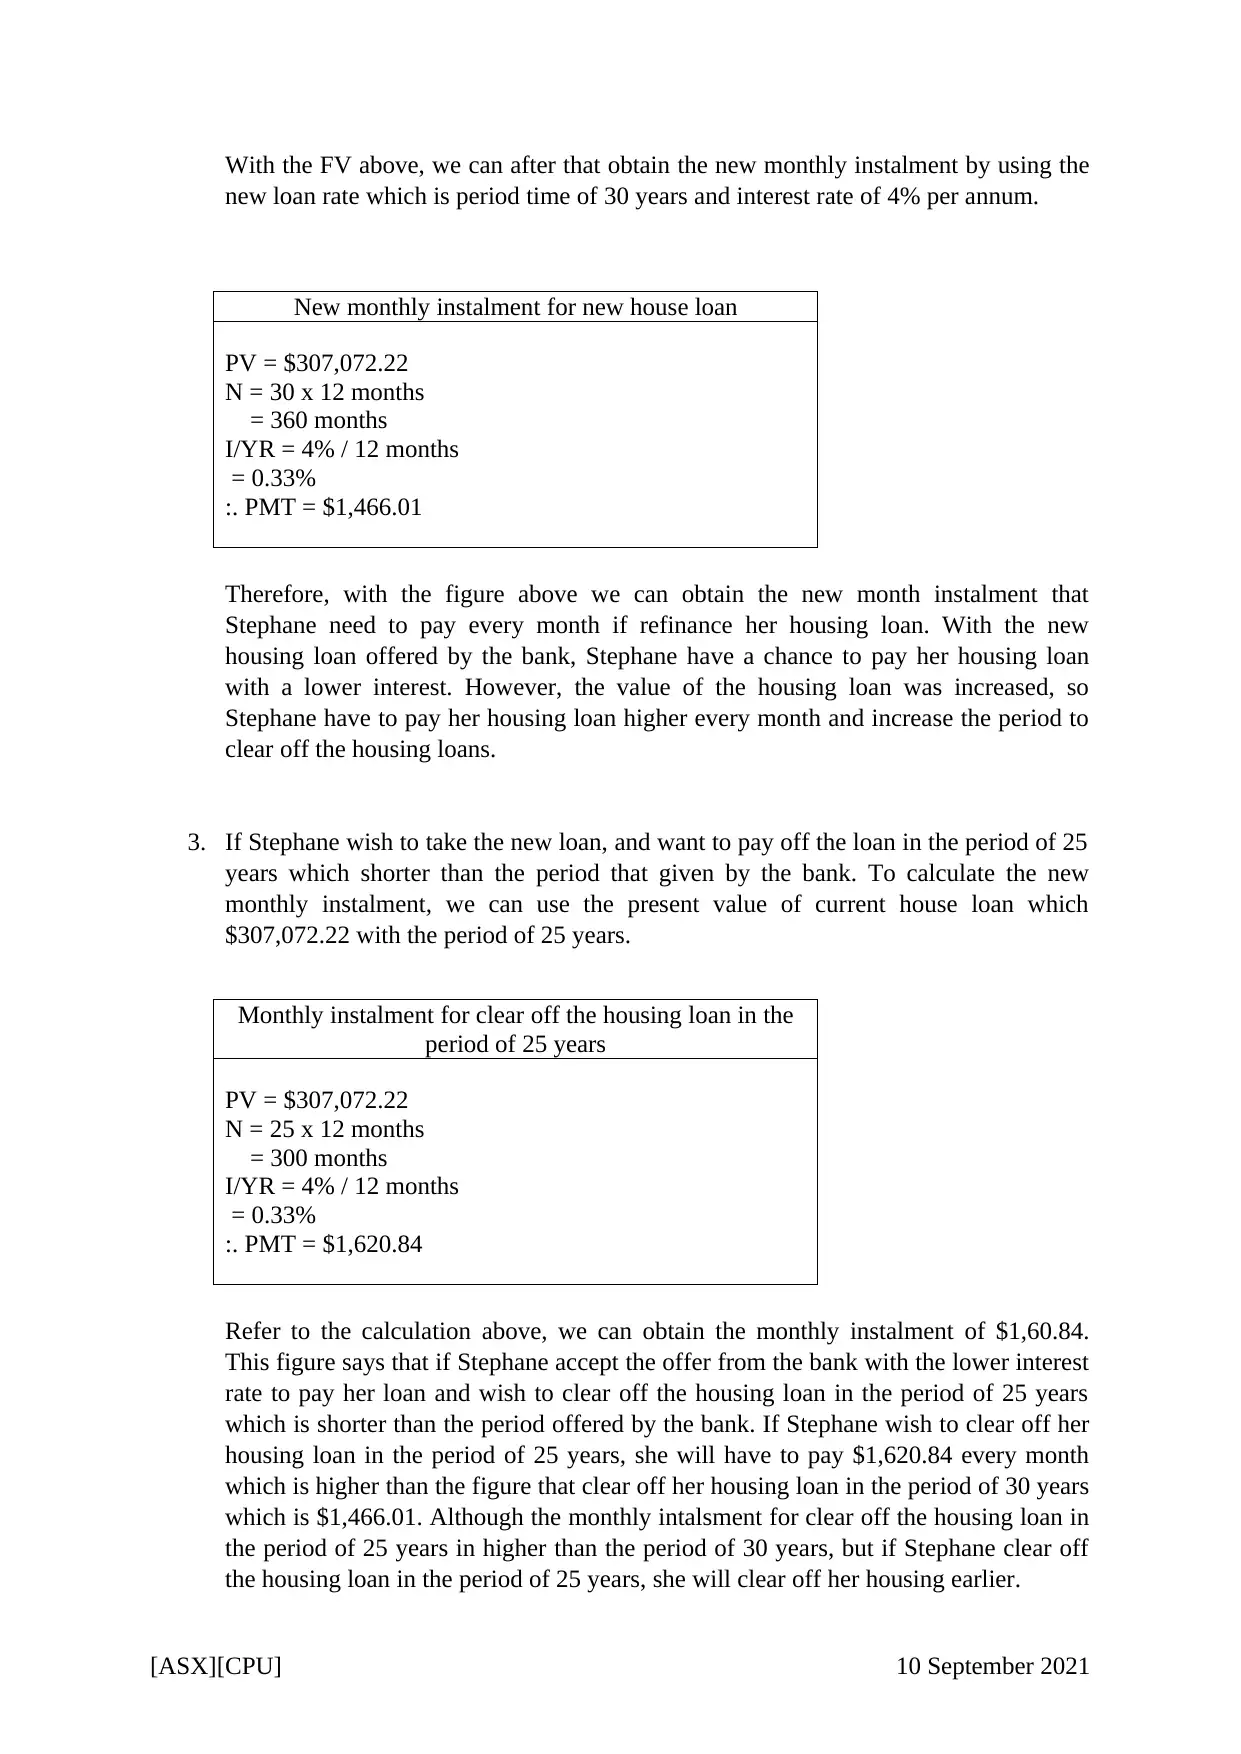
With the FV above, we can after that obtain the new monthly instalment by using the
new loan rate which is period time of 30 years and interest rate of 4% per annum.
New monthly instalment for new house loan
PV = $307,072.22
N = 30 x 12 months
= 360 months
I/YR = 4% / 12 months
= 0.33%
:. PMT = $1,466.01
Therefore, with the figure above we can obtain the new month instalment that
Stephane need to pay every month if refinance her housing loan. With the new
housing loan offered by the bank, Stephane have a chance to pay her housing loan
with a lower interest. However, the value of the housing loan was increased, so
Stephane have to pay her housing loan higher every month and increase the period to
clear off the housing loans.
3. If Stephane wish to take the new loan, and want to pay off the loan in the period of 25
years which shorter than the period that given by the bank. To calculate the new
monthly instalment, we can use the present value of current house loan which
$307,072.22 with the period of 25 years.
Monthly instalment for clear off the housing loan in the
period of 25 years
PV = $307,072.22
N = 25 x 12 months
= 300 months
I/YR = 4% / 12 months
= 0.33%
:. PMT = $1,620.84
Refer to the calculation above, we can obtain the monthly instalment of $1,60.84.
This figure says that if Stephane accept the offer from the bank with the lower interest
rate to pay her loan and wish to clear off the housing loan in the period of 25 years
which is shorter than the period offered by the bank. If Stephane wish to clear off her
housing loan in the period of 25 years, she will have to pay $1,620.84 every month
which is higher than the figure that clear off her housing loan in the period of 30 years
which is $1,466.01. Although the monthly intalsment for clear off the housing loan in
the period of 25 years in higher than the period of 30 years, but if Stephane clear off
the housing loan in the period of 25 years, she will clear off her housing earlier.
[ASX][CPU] 10 September 2021
⊘ This is a preview!⊘
Do you want full access?
Subscribe today to unlock all pages.
Trusted by 1+ million students worldwide
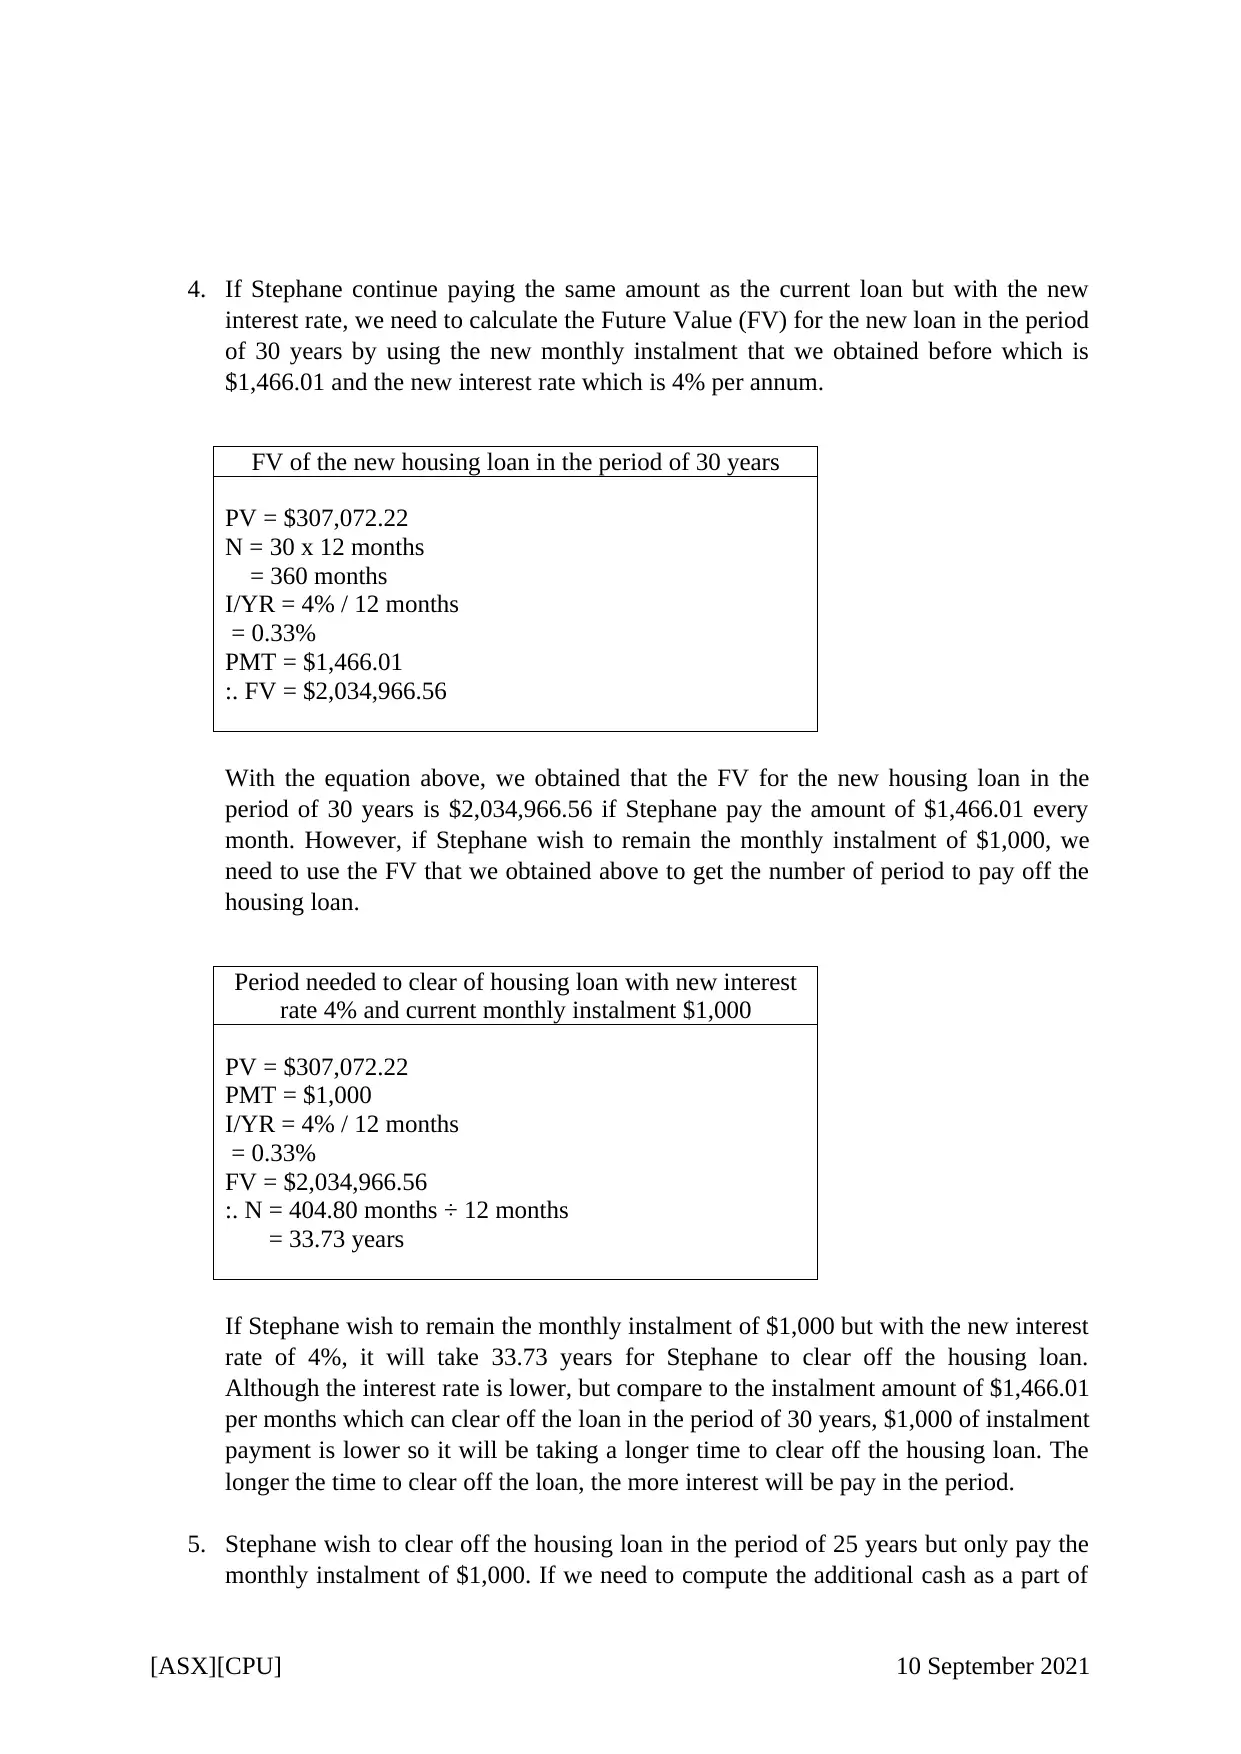
4. If Stephane continue paying the same amount as the current loan but with the new
interest rate, we need to calculate the Future Value (FV) for the new loan in the period
of 30 years by using the new monthly instalment that we obtained before which is
$1,466.01 and the new interest rate which is 4% per annum.
FV of the new housing loan in the period of 30 years
PV = $307,072.22
N = 30 x 12 months
= 360 months
I/YR = 4% / 12 months
= 0.33%
PMT = $1,466.01
:. FV = $2,034,966.56
With the equation above, we obtained that the FV for the new housing loan in the
period of 30 years is $2,034,966.56 if Stephane pay the amount of $1,466.01 every
month. However, if Stephane wish to remain the monthly instalment of $1,000, we
need to use the FV that we obtained above to get the number of period to pay off the
housing loan.
Period needed to clear of housing loan with new interest
rate 4% and current monthly instalment $1,000
PV = $307,072.22
PMT = $1,000
I/YR = 4% / 12 months
= 0.33%
FV = $2,034,966.56
:. N = 404.80 months ÷ 12 months
= 33.73 years
If Stephane wish to remain the monthly instalment of $1,000 but with the new interest
rate of 4%, it will take 33.73 years for Stephane to clear off the housing loan.
Although the interest rate is lower, but compare to the instalment amount of $1,466.01
per months which can clear off the loan in the period of 30 years, $1,000 of instalment
payment is lower so it will be taking a longer time to clear off the housing loan. The
longer the time to clear off the loan, the more interest will be pay in the period.
5. Stephane wish to clear off the housing loan in the period of 25 years but only pay the
monthly instalment of $1,000. If we need to compute the additional cash as a part of
[ASX][CPU] 10 September 2021
Paraphrase This Document
Need a fresh take? Get an instant paraphrase of this document with our AI Paraphraser
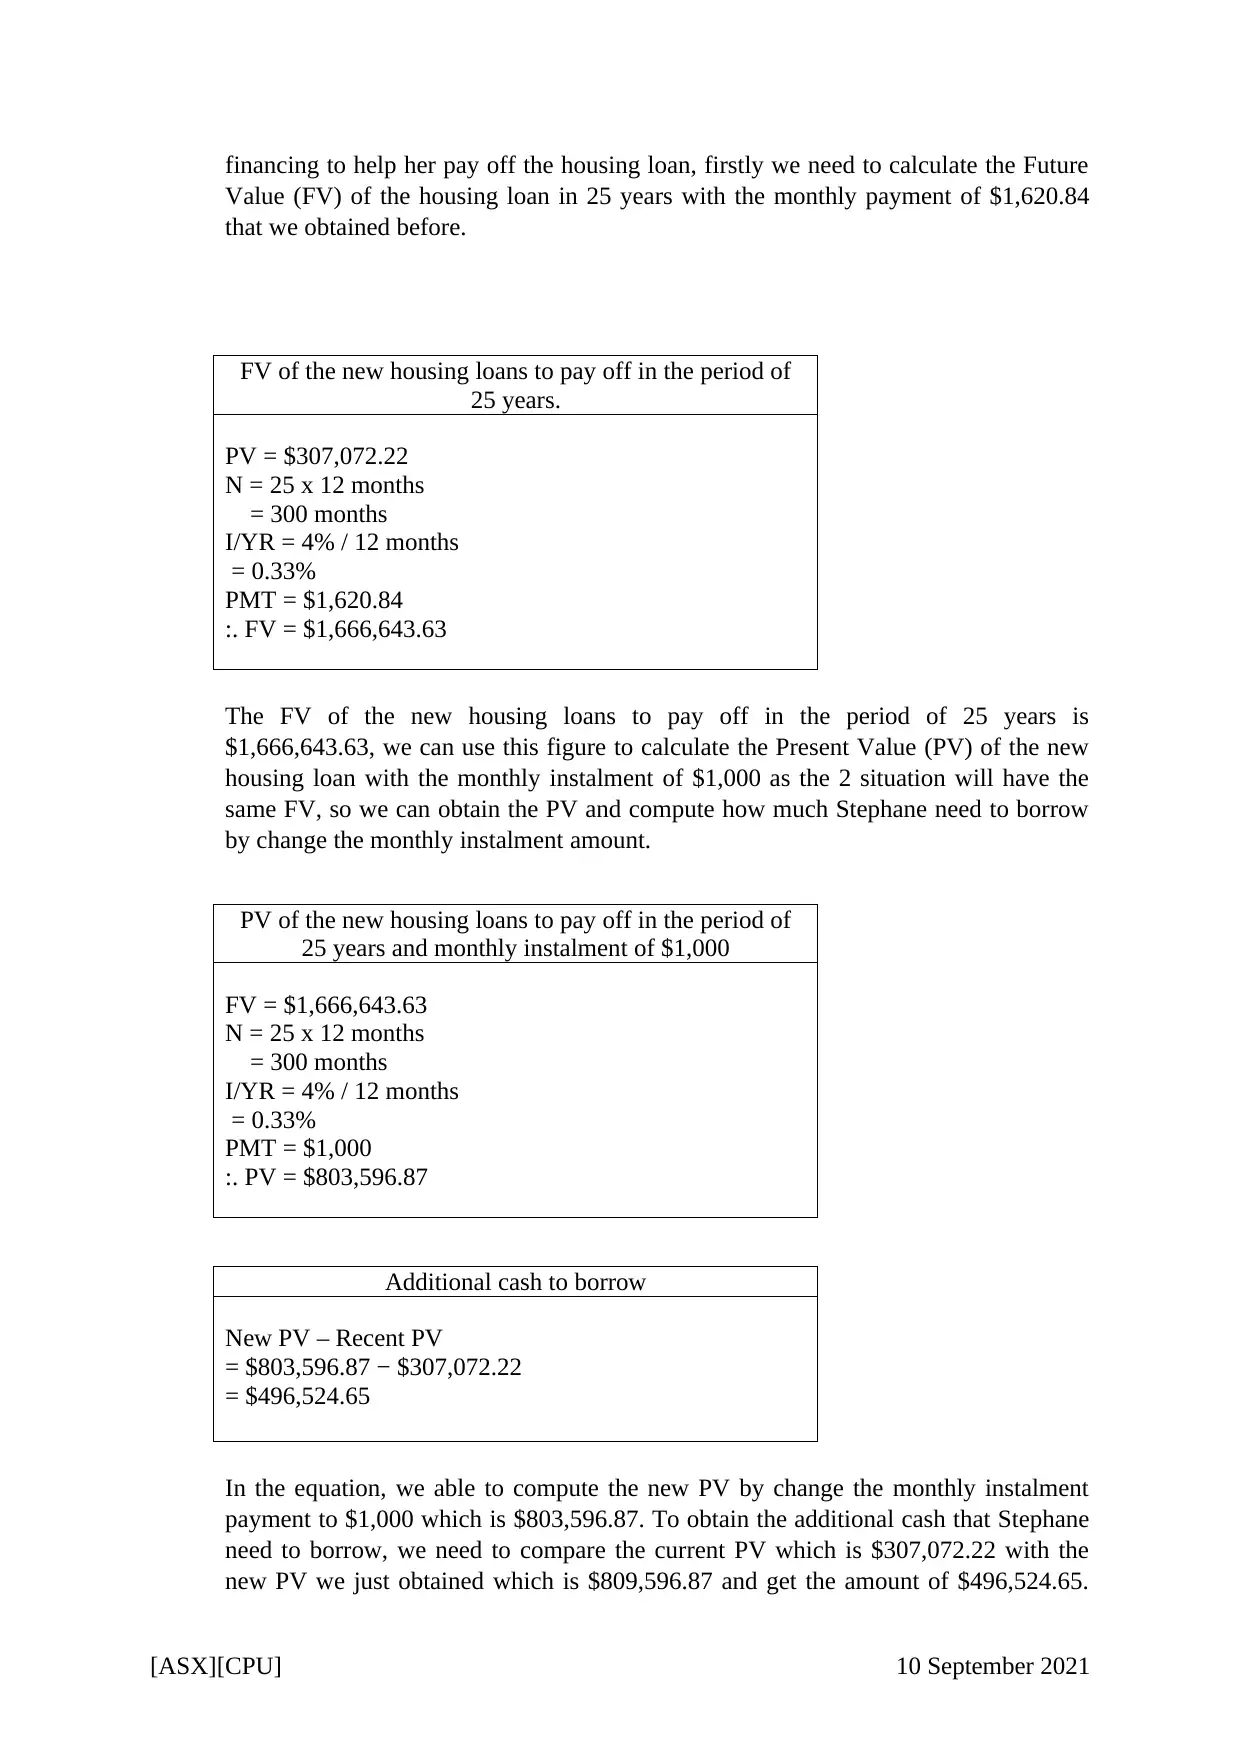
financing to help her pay off the housing loan, firstly we need to calculate the Future
Value (FV) of the housing loan in 25 years with the monthly payment of $1,620.84
that we obtained before.
FV of the new housing loans to pay off in the period of
25 years.
PV = $307,072.22
N = 25 x 12 months
= 300 months
I/YR = 4% / 12 months
= 0.33%
PMT = $1,620.84
:. FV = $1,666,643.63
The FV of the new housing loans to pay off in the period of 25 years is
$1,666,643.63, we can use this figure to calculate the Present Value (PV) of the new
housing loan with the monthly instalment of $1,000 as the 2 situation will have the
same FV, so we can obtain the PV and compute how much Stephane need to borrow
by change the monthly instalment amount.
PV of the new housing loans to pay off in the period of
25 years and monthly instalment of $1,000
FV = $1,666,643.63
N = 25 x 12 months
= 300 months
I/YR = 4% / 12 months
= 0.33%
PMT = $1,000
:. PV = $803,596.87
Additional cash to borrow
New PV – Recent PV
= $803,596.87 − $307,072.22
= $496,524.65
In the equation, we able to compute the new PV by change the monthly instalment
payment to $1,000 which is $803,596.87. To obtain the additional cash that Stephane
need to borrow, we need to compare the current PV which is $307,072.22 with the
new PV we just obtained which is $809,596.87 and get the amount of $496,524.65.
[ASX][CPU] 10 September 2021
Therefore, we can know that the additional cash that Stepahne need to borrow to pay
off her housing loaan is $496,524.65.
Reference
ASX Limited Official Website (10 September
2021)
https://www2.asx.com.au/
Computershare Limited Official Website (10 September
2021)
https://www.computershare.com/au
ASX Limited Annual Report 30 June 2021 (11 September
2021)
http://www.aspecthuntley.com.au/asxdata/20210819/pdf/02408900.pdf
Computershare Limited Final Report 30 June 2021 (11 September
2021)
https://www.computershare.com/News/CPU%20-%20FY21%20Preliminary%20Final
%20Report%20-%20Appendix%204E.pdf
Dividend Payout Ratio Definition (13 September
2021)
https://www.investopedia.com/terms/d/dividendpayoutratio.asp#:~:text=The%20dividend
%20payout%20ratio%20is,paid%20to%20shareholders%20via%20dividends
[ASX][CPU] 10 September 2021
⊘ This is a preview!⊘
Do you want full access?
Subscribe today to unlock all pages.
Trusted by 1+ million students worldwide
1 out of 9
Related Documents


Your All-in-One AI-Powered Toolkit for Academic Success.
+13062052269
info@desklib.com
Available 24*7 on WhatsApp / Email
![[object Object]](/_next/static/media/star-bottom.7253800d.svg)
Unlock your academic potential
Copyright © 2020–2026 A2Z Services. All Rights Reserved. Developed and managed by ZUCOL.