Production and Distribution Network Design for QuickClean
VerifiedAdded on 2022/12/29
|10
|1854
|95
AI Summary
This document discusses the strategic decision of plant location selection and cost analysis for QuickClean's production and distribution network design. It includes an optimization model to minimize costs and analyzes different scenarios. The conclusion recommends the construction of new plant facilities at Adelaide and Sydney for Paper towels and Mop cloths.
Contribute Materials
Your contribution can guide someone’s learning journey. Share your
documents today.
Assignment 2
OMGT1053
Production and Distribution Network Design for QuickClean
University name
Student Name
Student ID
Submission Date
OMGT1053
Production and Distribution Network Design for QuickClean
University name
Student Name
Student ID
Submission Date
Secure Best Marks with AI Grader
Need help grading? Try our AI Grader for instant feedback on your assignments.
Table of Contents
Plant location selection..............................................................................................................3
Q1...............................................................................................................................................3
Q2(a)..........................................................................................................................................4
Q2(b)..........................................................................................................................................4
Q3...............................................................................................................................................4
Q4...............................................................................................................................................5
Q5...............................................................................................................................................5
Q6...............................................................................................................................................6
Q7...............................................................................................................................................6
Q8...............................................................................................................................................7
Q9...............................................................................................................................................7
Analysis..................................................................................................................................8
Conclusion..............................................................................................................................9
Recommendation....................................................................................................................9
References................................................................................................................................10
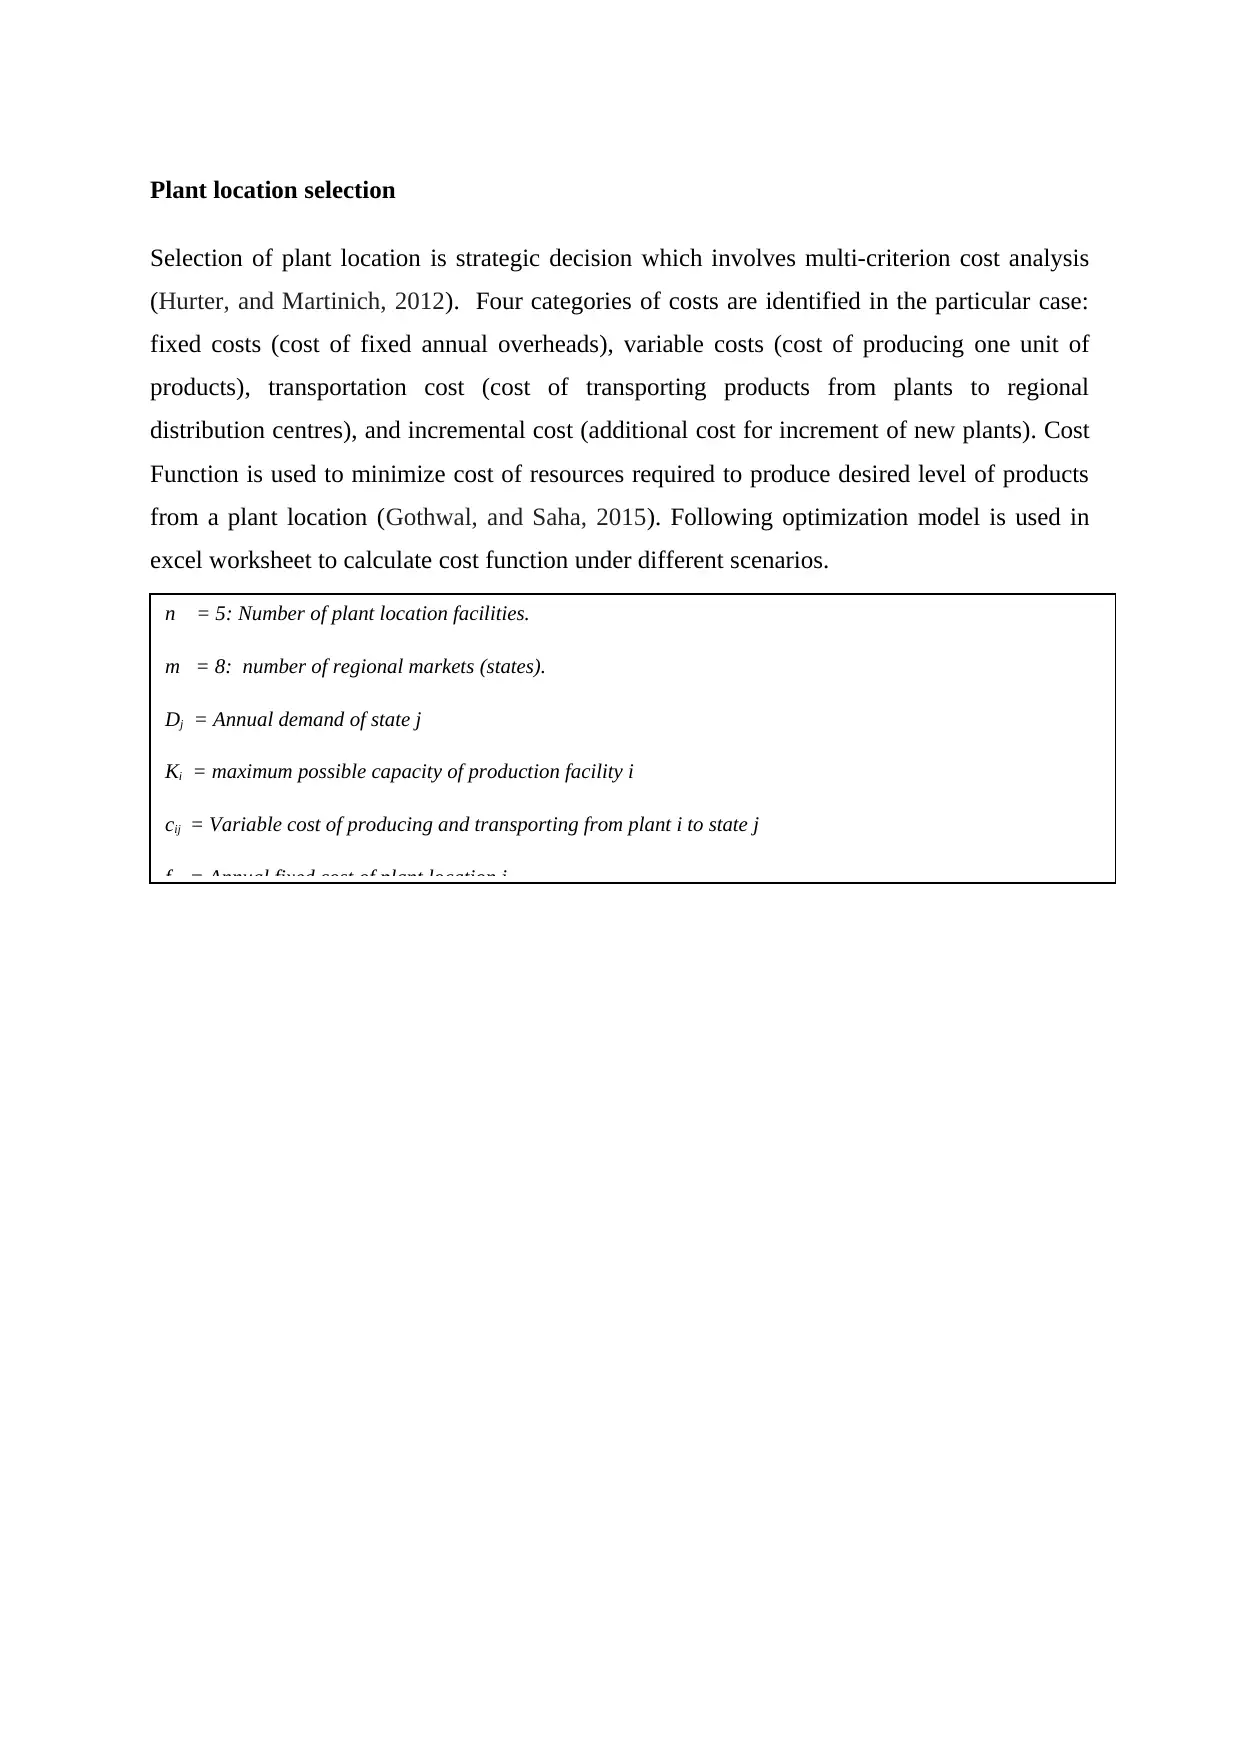
Plant location selection
Selection of plant location is strategic decision which involves multi-criterion cost analysis
(Hurter, and Martinich, 2012). Four categories of costs are identified in the particular case:
fixed costs (cost of fixed annual overheads), variable costs (cost of producing one unit of
products), transportation cost (cost of transporting products from plants to regional
distribution centres), and incremental cost (additional cost for increment of new plants). Cost
Function is used to minimize cost of resources required to produce desired level of products
from a plant location (Gothwal, and Saha, 2015). Following optimization model is used in
excel worksheet to calculate cost function under different scenarios.
n = 5: Number of plant location facilities.
m = 8: number of regional markets (states).
Dj = Annual demand of state j
Ki = maximum possible capacity of production facility i
cij = Variable cost of producing and transporting from plant i to state j
fi = Annual fixed cost of plant location i
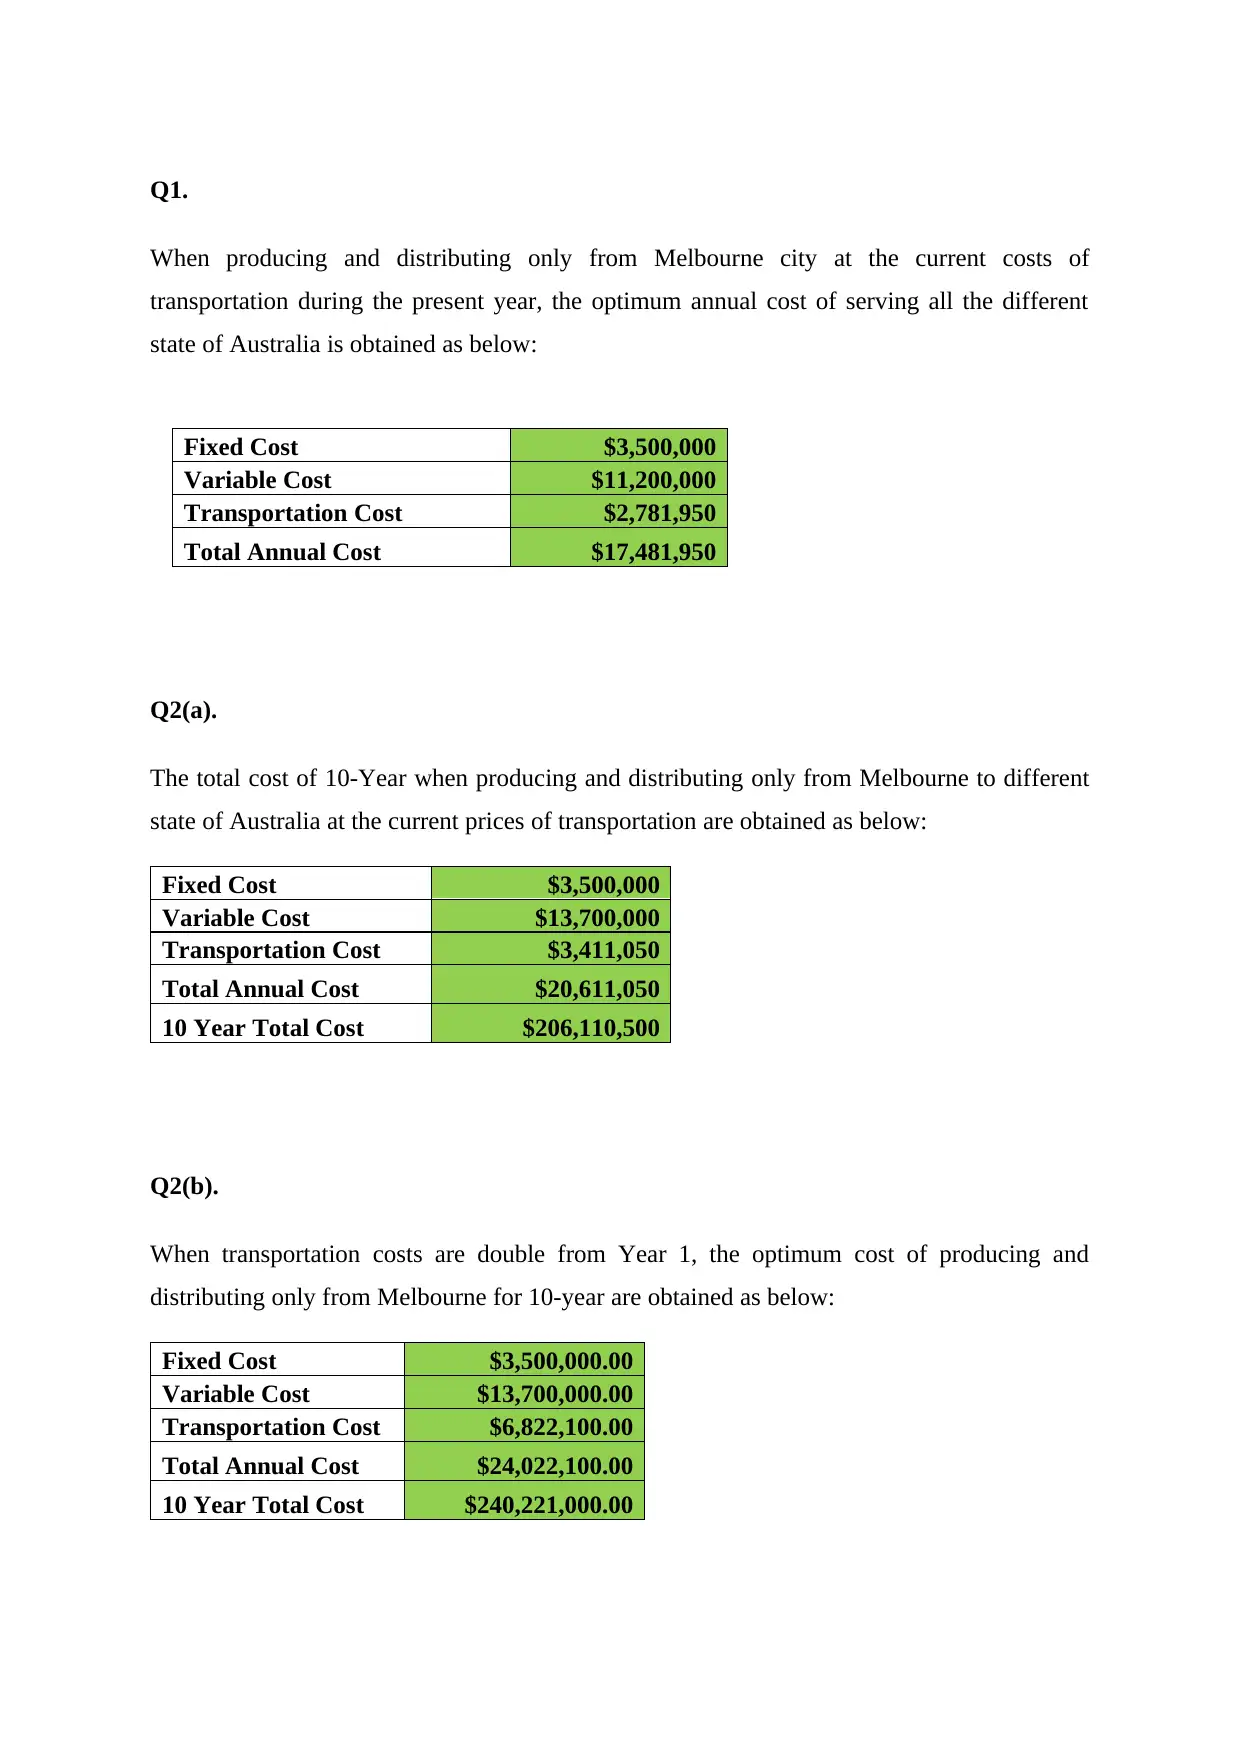
Q1.
When producing and distributing only from Melbourne city at the current costs of
transportation during the present year, the optimum annual cost of serving all the different
state of Australia is obtained as below:
Fixed Cost $3,500,000
Variable Cost $11,200,000
Transportation Cost $2,781,950
Total Annual Cost $17,481,950
Q2(a).
The total cost of 10-Year when producing and distributing only from Melbourne to different
state of Australia at the current prices of transportation are obtained as below:
Fixed Cost $3,500,000
Variable Cost $13,700,000
Transportation Cost $3,411,050
Total Annual Cost $20,611,050
10 Year Total Cost $206,110,500
Q2(b).
When transportation costs are double from Year 1, the optimum cost of producing and
distributing only from Melbourne for 10-year are obtained as below:
Fixed Cost $3,500,000.00
Variable Cost $13,700,000.00
Transportation Cost $6,822,100.00
Total Annual Cost $24,022,100.00
10 Year Total Cost $240,221,000.00
Secure Best Marks with AI Grader
Need help grading? Try our AI Grader for instant feedback on your assignments.
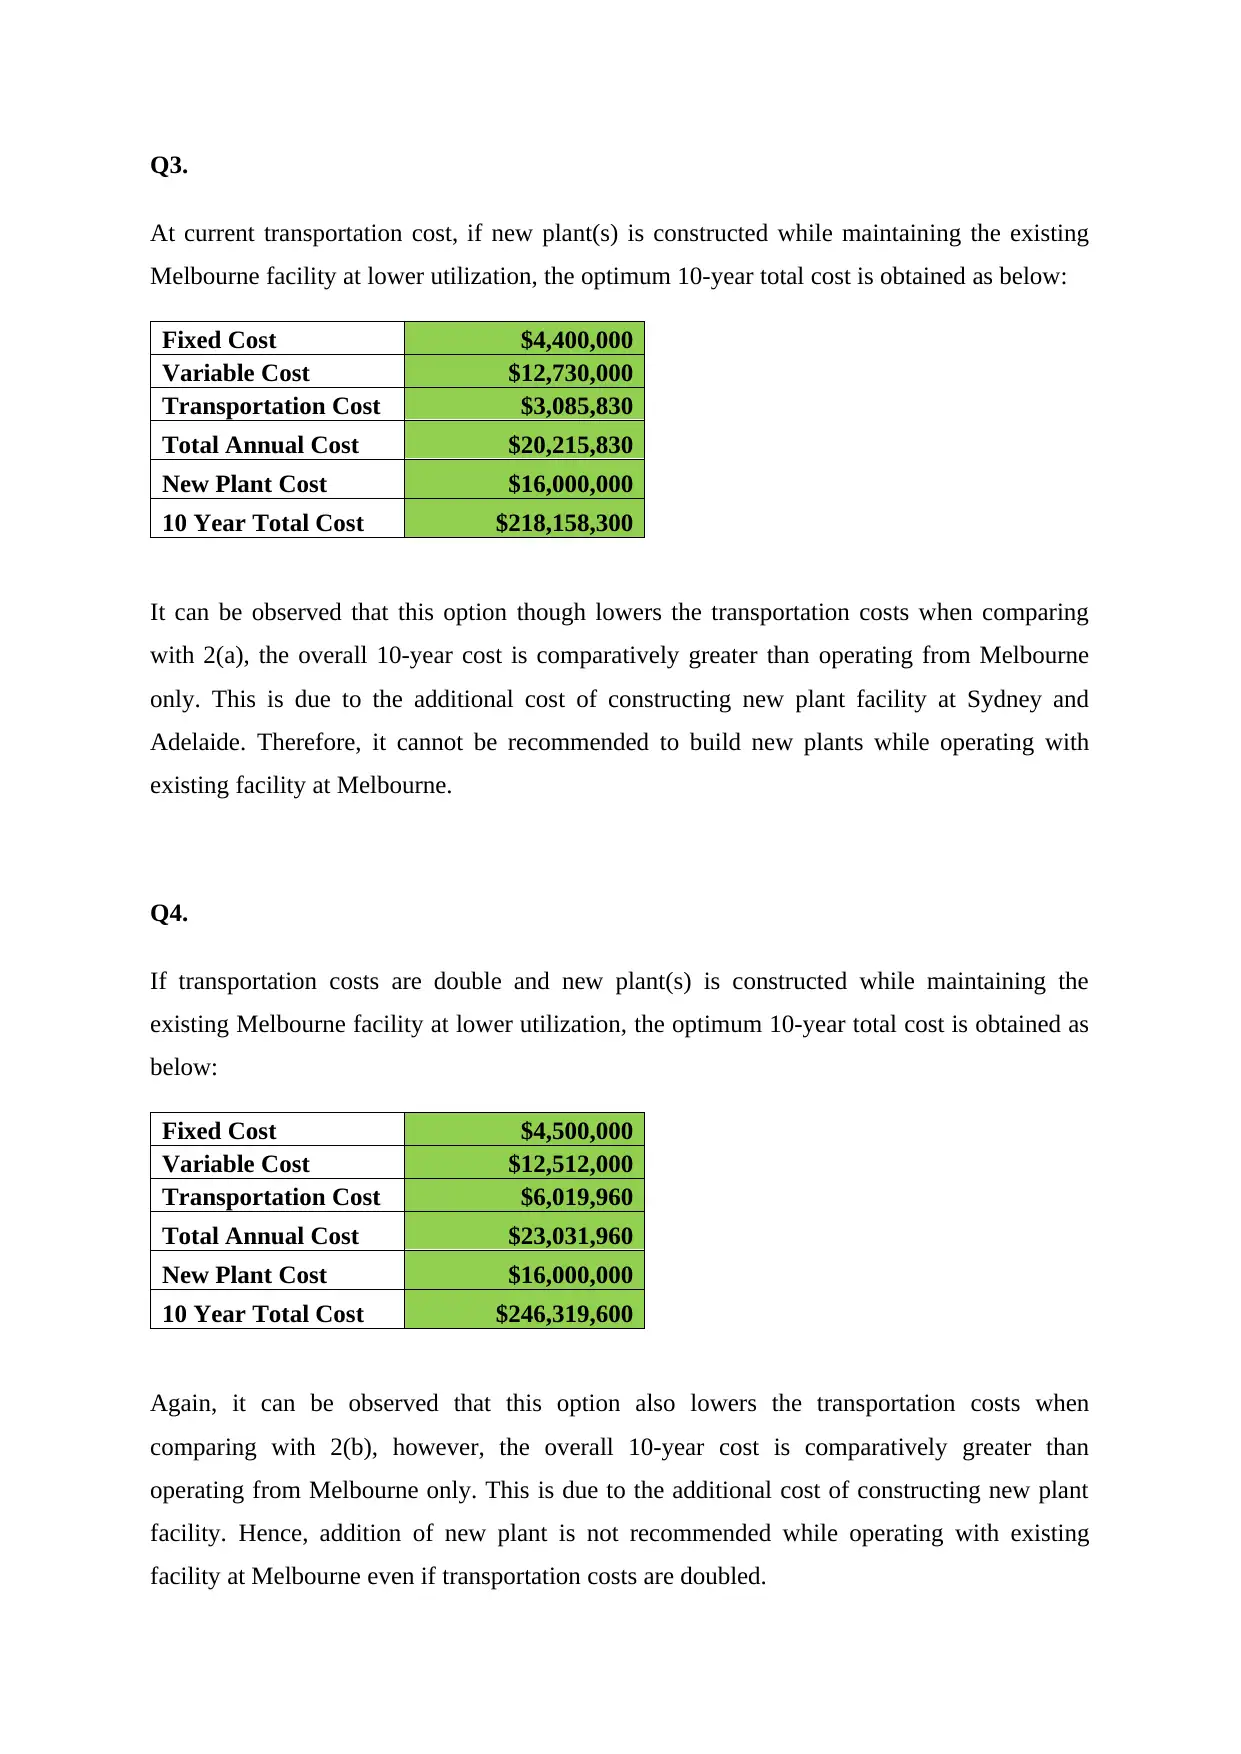
Q3.
At current transportation cost, if new plant(s) is constructed while maintaining the existing
Melbourne facility at lower utilization, the optimum 10-year total cost is obtained as below:
Fixed Cost $4,400,000
Variable Cost $12,730,000
Transportation Cost $3,085,830
Total Annual Cost $20,215,830
New Plant Cost $16,000,000
10 Year Total Cost $218,158,300
It can be observed that this option though lowers the transportation costs when comparing
with 2(a), the overall 10-year cost is comparatively greater than operating from Melbourne
only. This is due to the additional cost of constructing new plant facility at Sydney and
Adelaide. Therefore, it cannot be recommended to build new plants while operating with
existing facility at Melbourne.
Q4.
If transportation costs are double and new plant(s) is constructed while maintaining the
existing Melbourne facility at lower utilization, the optimum 10-year total cost is obtained as
below:
Fixed Cost $4,500,000
Variable Cost $12,512,000
Transportation Cost $6,019,960
Total Annual Cost $23,031,960
New Plant Cost $16,000,000
10 Year Total Cost $246,319,600
Again, it can be observed that this option also lowers the transportation costs when
comparing with 2(b), however, the overall 10-year cost is comparatively greater than
operating from Melbourne only. This is due to the additional cost of constructing new plant
facility. Hence, addition of new plant is not recommended while operating with existing
facility at Melbourne even if transportation costs are doubled.
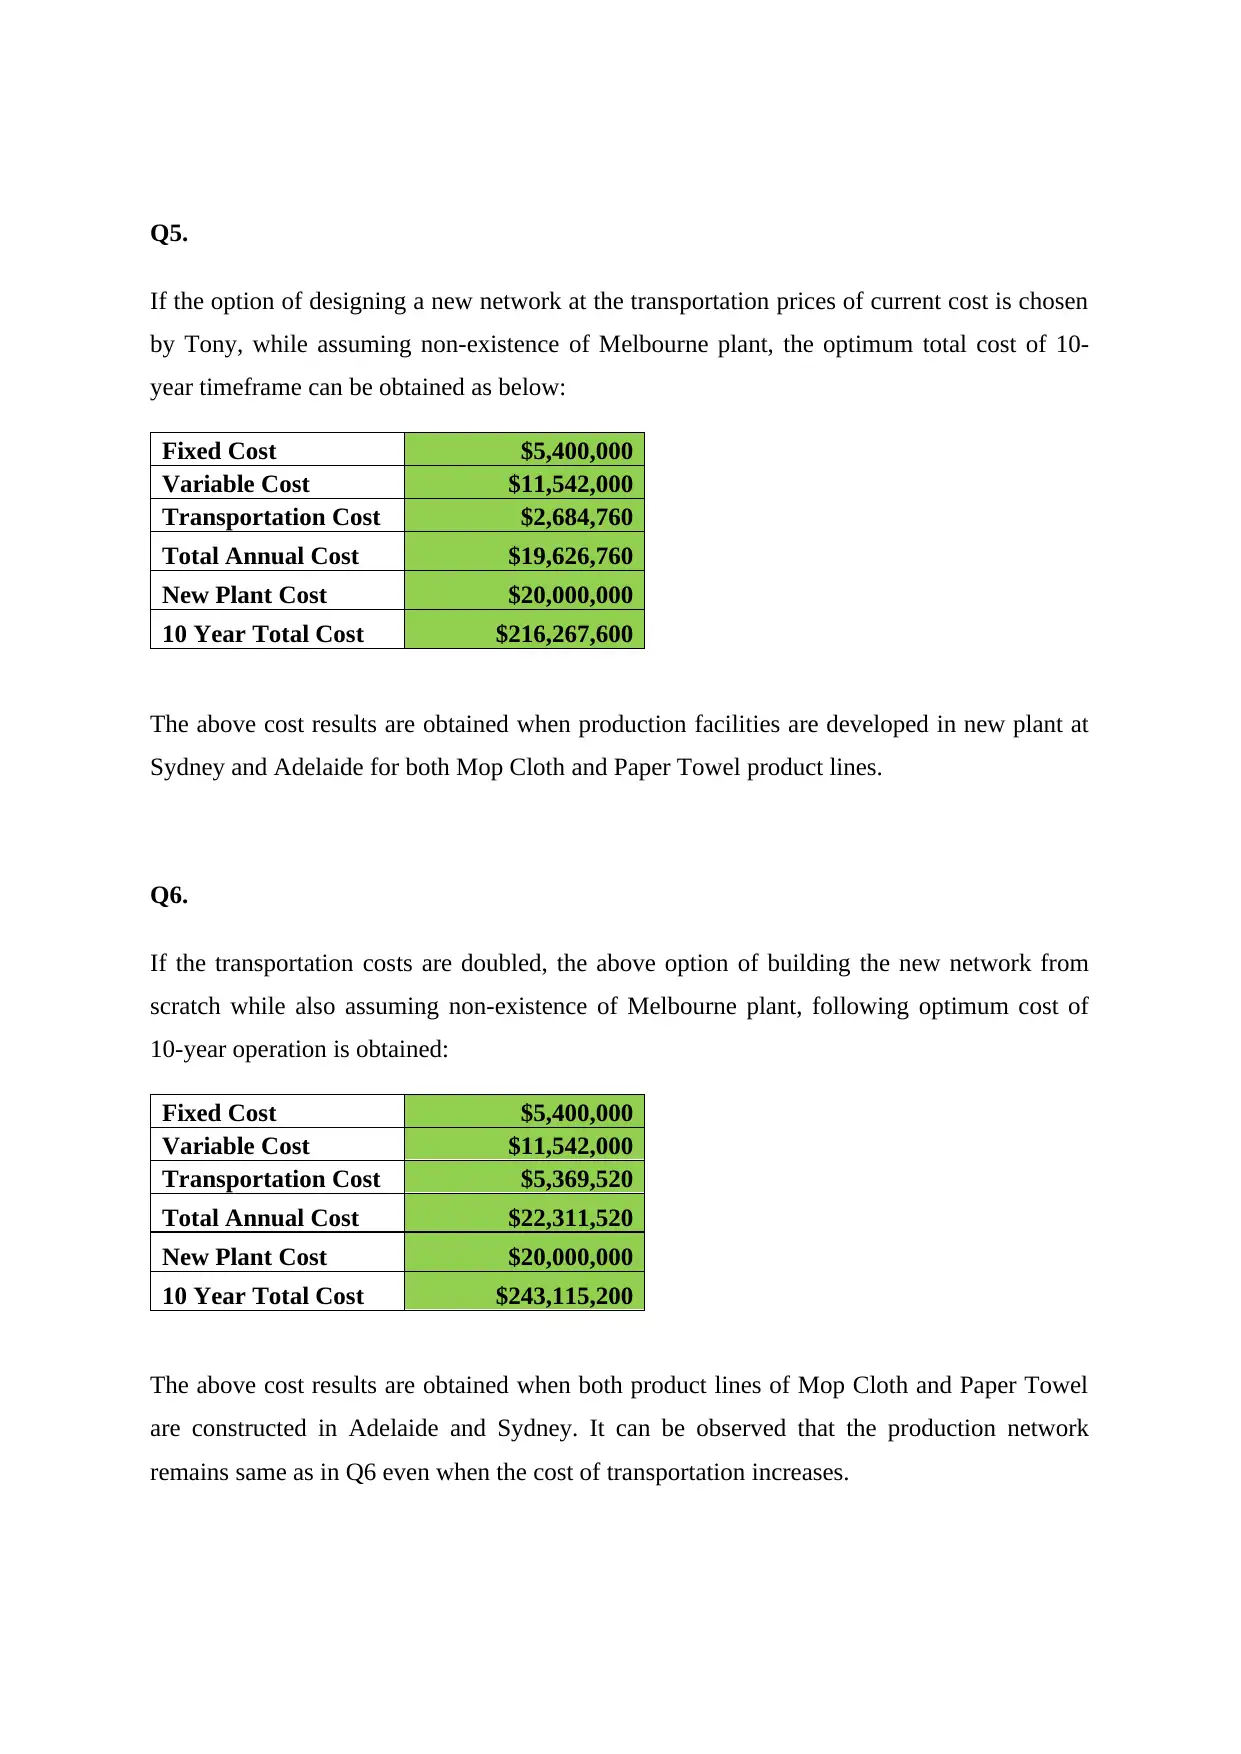
Q5.
If the option of designing a new network at the transportation prices of current cost is chosen
by Tony, while assuming non-existence of Melbourne plant, the optimum total cost of 10-
year timeframe can be obtained as below:
Fixed Cost $5,400,000
Variable Cost $11,542,000
Transportation Cost $2,684,760
Total Annual Cost $19,626,760
New Plant Cost $20,000,000
10 Year Total Cost $216,267,600
The above cost results are obtained when production facilities are developed in new plant at
Sydney and Adelaide for both Mop Cloth and Paper Towel product lines.
Q6.
If the transportation costs are doubled, the above option of building the new network from
scratch while also assuming non-existence of Melbourne plant, following optimum cost of
10-year operation is obtained:
Fixed Cost $5,400,000
Variable Cost $11,542,000
Transportation Cost $5,369,520
Total Annual Cost $22,311,520
New Plant Cost $20,000,000
10 Year Total Cost $243,115,200
The above cost results are obtained when both product lines of Mop Cloth and Paper Towel
are constructed in Adelaide and Sydney. It can be observed that the production network
remains same as in Q6 even when the cost of transportation increases.
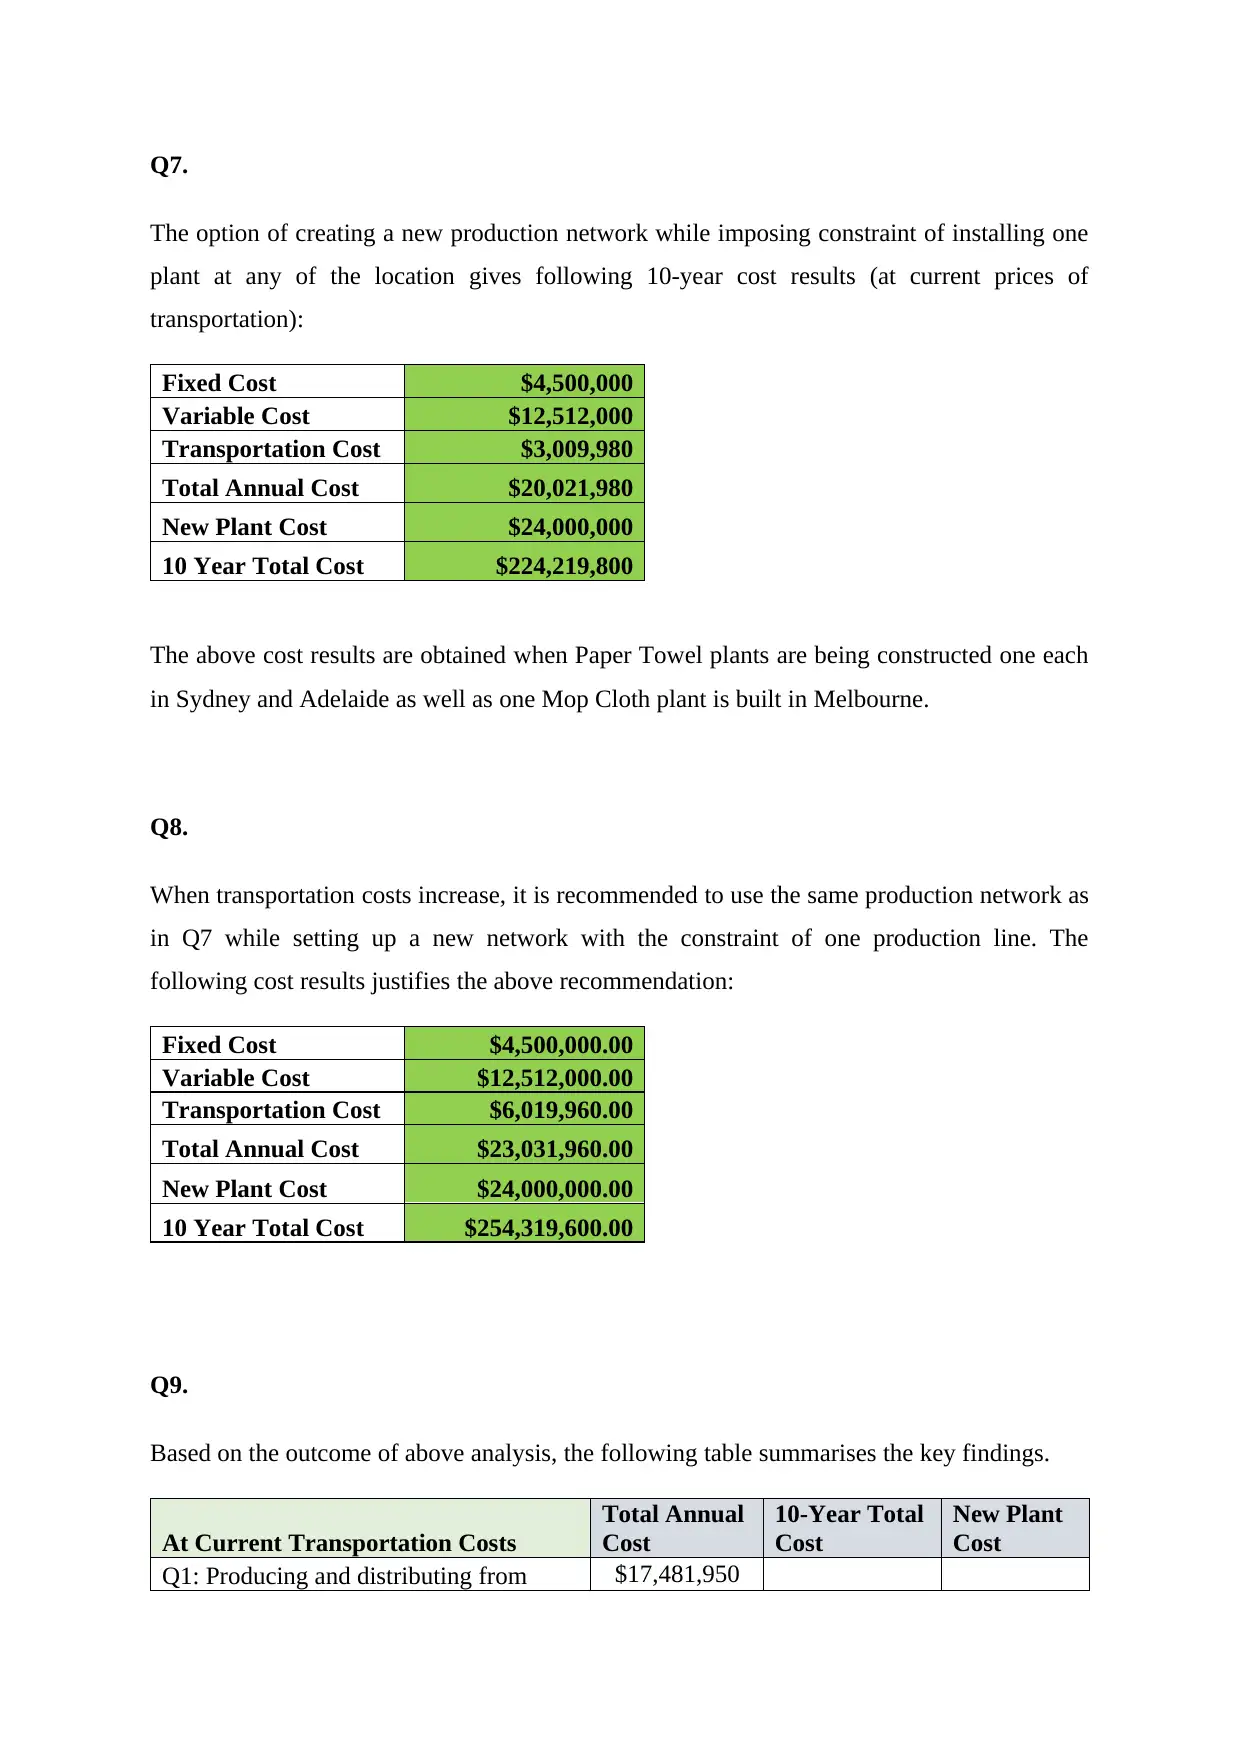
Q7.
The option of creating a new production network while imposing constraint of installing one
plant at any of the location gives following 10-year cost results (at current prices of
transportation):
Fixed Cost $4,500,000
Variable Cost $12,512,000
Transportation Cost $3,009,980
Total Annual Cost $20,021,980
New Plant Cost $24,000,000
10 Year Total Cost $224,219,800
The above cost results are obtained when Paper Towel plants are being constructed one each
in Sydney and Adelaide as well as one Mop Cloth plant is built in Melbourne.
Q8.
When transportation costs increase, it is recommended to use the same production network as
in Q7 while setting up a new network with the constraint of one production line. The
following cost results justifies the above recommendation:
Fixed Cost $4,500,000.00
Variable Cost $12,512,000.00
Transportation Cost $6,019,960.00
Total Annual Cost $23,031,960.00
New Plant Cost $24,000,000.00
10 Year Total Cost $254,319,600.00
Q9.
Based on the outcome of above analysis, the following table summarises the key findings.
At Current Transportation Costs
Total Annual
Cost
10-Year Total
Cost
New Plant
Cost
Q1: Producing and distributing from $17,481,950
Paraphrase This Document
Need a fresh take? Get an instant paraphrase of this document with our AI Paraphraser
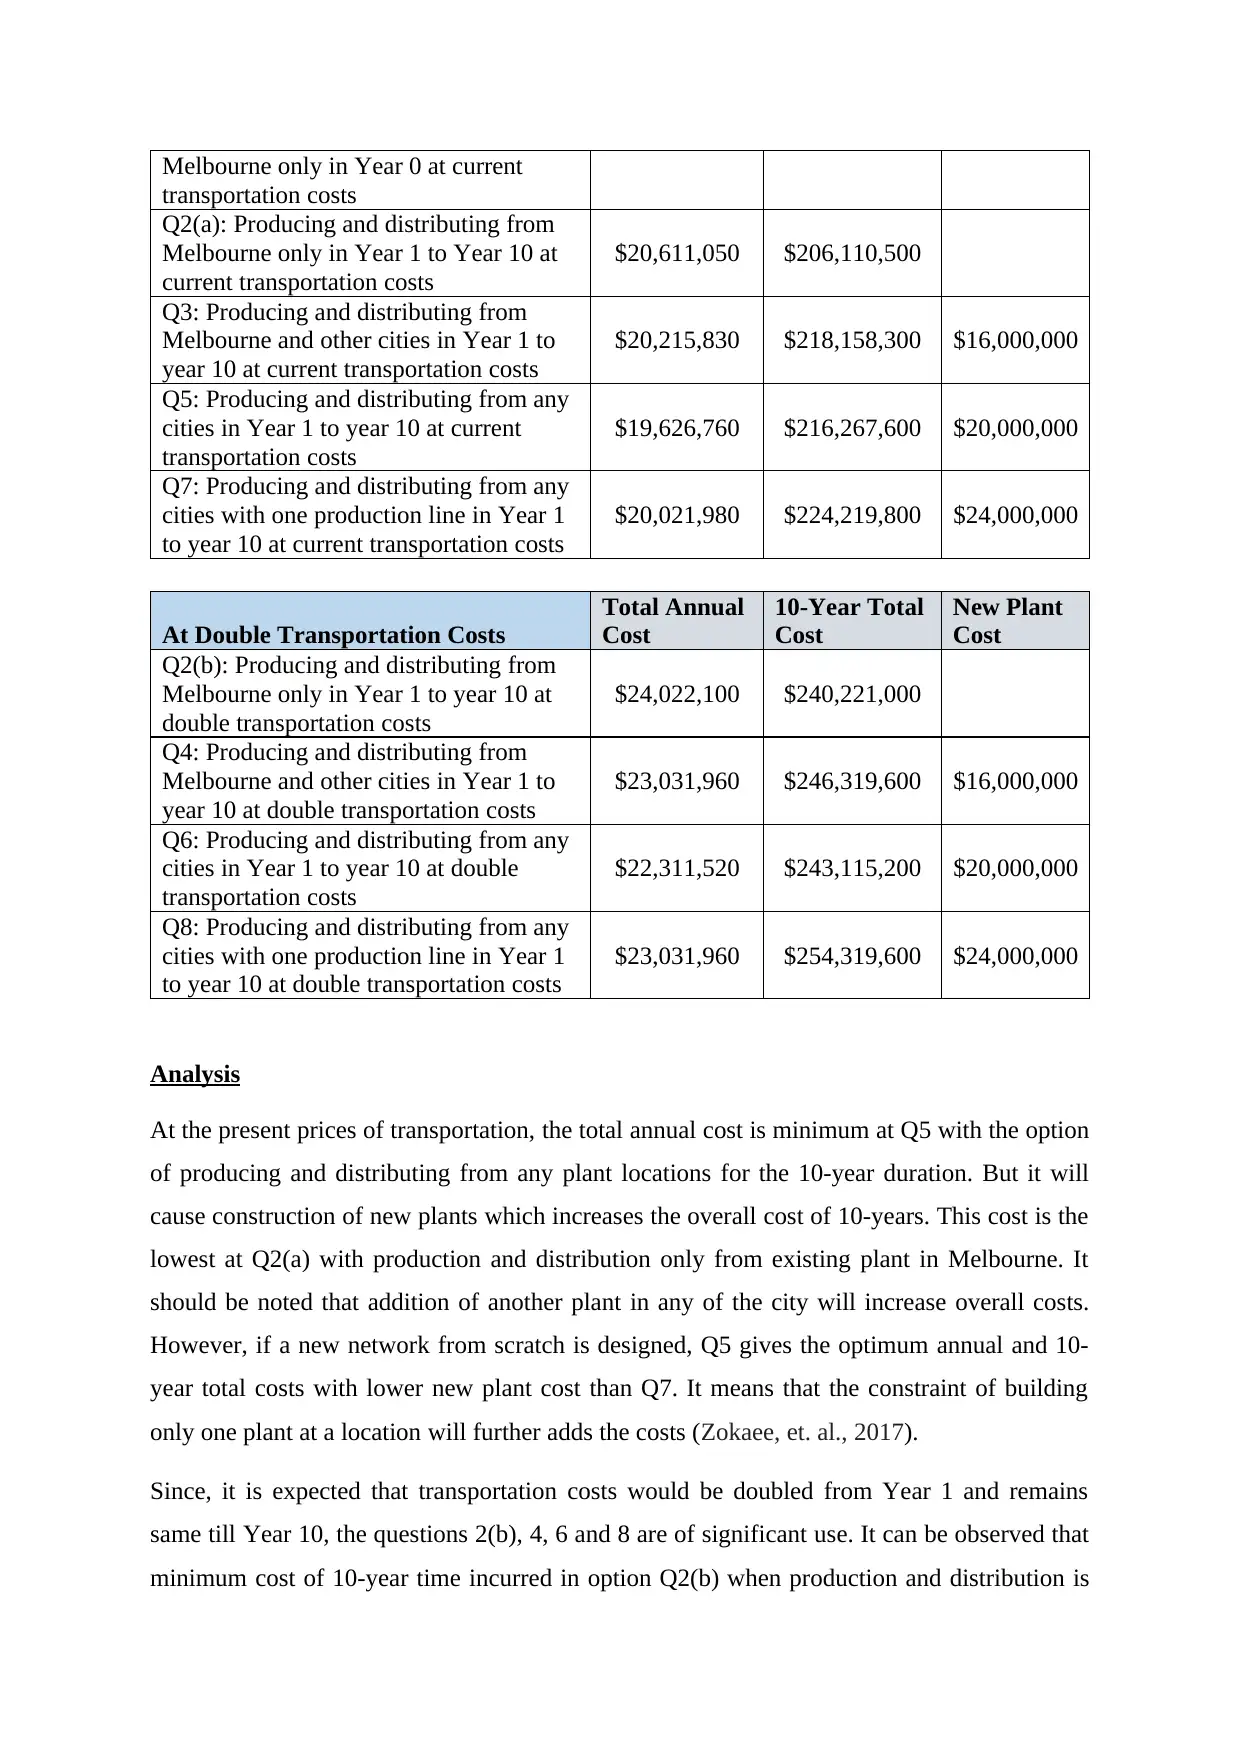
Melbourne only in Year 0 at current
transportation costs
Q2(a): Producing and distributing from
Melbourne only in Year 1 to Year 10 at
current transportation costs
$20,611,050 $206,110,500
Q3: Producing and distributing from
Melbourne and other cities in Year 1 to
year 10 at current transportation costs
$20,215,830 $218,158,300 $16,000,000
Q5: Producing and distributing from any
cities in Year 1 to year 10 at current
transportation costs
$19,626,760 $216,267,600 $20,000,000
Q7: Producing and distributing from any
cities with one production line in Year 1
to year 10 at current transportation costs
$20,021,980 $224,219,800 $24,000,000
At Double Transportation Costs
Total Annual
Cost
10-Year Total
Cost
New Plant
Cost
Q2(b): Producing and distributing from
Melbourne only in Year 1 to year 10 at
double transportation costs
$24,022,100 $240,221,000
Q4: Producing and distributing from
Melbourne and other cities in Year 1 to
year 10 at double transportation costs
$23,031,960 $246,319,600 $16,000,000
Q6: Producing and distributing from any
cities in Year 1 to year 10 at double
transportation costs
$22,311,520 $243,115,200 $20,000,000
Q8: Producing and distributing from any
cities with one production line in Year 1
to year 10 at double transportation costs
$23,031,960 $254,319,600 $24,000,000
Analysis
At the present prices of transportation, the total annual cost is minimum at Q5 with the option
of producing and distributing from any plant locations for the 10-year duration. But it will
cause construction of new plants which increases the overall cost of 10-years. This cost is the
lowest at Q2(a) with production and distribution only from existing plant in Melbourne. It
should be noted that addition of another plant in any of the city will increase overall costs.
However, if a new network from scratch is designed, Q5 gives the optimum annual and 10-
year total costs with lower new plant cost than Q7. It means that the constraint of building
only one plant at a location will further adds the costs (Zokaee, et. al., 2017).
Since, it is expected that transportation costs would be doubled from Year 1 and remains
same till Year 10, the questions 2(b), 4, 6 and 8 are of significant use. It can be observed that
minimum cost of 10-year time incurred in option Q2(b) when production and distribution is
transportation costs
Q2(a): Producing and distributing from
Melbourne only in Year 1 to Year 10 at
current transportation costs
$20,611,050 $206,110,500
Q3: Producing and distributing from
Melbourne and other cities in Year 1 to
year 10 at current transportation costs
$20,215,830 $218,158,300 $16,000,000
Q5: Producing and distributing from any
cities in Year 1 to year 10 at current
transportation costs
$19,626,760 $216,267,600 $20,000,000
Q7: Producing and distributing from any
cities with one production line in Year 1
to year 10 at current transportation costs
$20,021,980 $224,219,800 $24,000,000
At Double Transportation Costs
Total Annual
Cost
10-Year Total
Cost
New Plant
Cost
Q2(b): Producing and distributing from
Melbourne only in Year 1 to year 10 at
double transportation costs
$24,022,100 $240,221,000
Q4: Producing and distributing from
Melbourne and other cities in Year 1 to
year 10 at double transportation costs
$23,031,960 $246,319,600 $16,000,000
Q6: Producing and distributing from any
cities in Year 1 to year 10 at double
transportation costs
$22,311,520 $243,115,200 $20,000,000
Q8: Producing and distributing from any
cities with one production line in Year 1
to year 10 at double transportation costs
$23,031,960 $254,319,600 $24,000,000
Analysis
At the present prices of transportation, the total annual cost is minimum at Q5 with the option
of producing and distributing from any plant locations for the 10-year duration. But it will
cause construction of new plants which increases the overall cost of 10-years. This cost is the
lowest at Q2(a) with production and distribution only from existing plant in Melbourne. It
should be noted that addition of another plant in any of the city will increase overall costs.
However, if a new network from scratch is designed, Q5 gives the optimum annual and 10-
year total costs with lower new plant cost than Q7. It means that the constraint of building
only one plant at a location will further adds the costs (Zokaee, et. al., 2017).
Since, it is expected that transportation costs would be doubled from Year 1 and remains
same till Year 10, the questions 2(b), 4, 6 and 8 are of significant use. It can be observed that
minimum cost of 10-year time incurred in option Q2(b) when production and distribution is
carried out from Melbourne only. However, if other plant locations are to be constructed, the
option of operating from any cities (without the constraint of production line) gives optimum
results.
Conclusion
Finally, it can be concluded that though the option of constructing new plant location
minimizes the transportation costs, the building of new plant if it is costlier, can level out the
advantage of low transportation costs. Moreover, the constraint of building only one line of
production when constructing a new network, maximizes the number of new plants to be
constructed and increases the overall costs of production and distribution.
Recommendation
Based on above data analysis and conclusion, it can be recommended for Tony to construct
new plant facilities at Adelaide and Sydney for both Paper towels and Mop cloths from
scratch. However, if Tony wants to maintain the Melbourne facility, it is recommended to not
construct any new plant. Because the construction of new plant, though will decrease the
distribution cost, it will increase the overall costs of production and distribution as the cost of
new plant construction is expensive.
References
Gothwal, S. and Saha, R. (2015). Plant location selection of a manufacturing industry using
analytic hierarchy process approach. International Journal of Services and Operations
Management, 22(2), pp.235-255.
Hurter, A.P. and Martinich, J.S. (2012). Facility location and the theory of production.
Springer Science & Business Media.
Zokaee, S., Jabbarzadeh, A., Fahimnia, B. and Sadjadi, S.J. (2017). Robust supply chain
network design: an optimization model with real world application. Annals of Operations
Research, 257(1-2), pp.15-44.
1 out of 10
Related Documents


Your All-in-One AI-Powered Toolkit for Academic Success.
+13062052269
info@desklib.com
Available 24*7 on WhatsApp / Email
![[object Object]](/_next/static/media/star-bottom.7253800d.svg)
Unlock your academic potential
© 2024 | Zucol Services PVT LTD | All rights reserved.