Financial Management Assignment: Project Analysis and Tax Liability
VerifiedAdded on 2022/08/26
|6
|908
|63
Homework Assignment
AI Summary
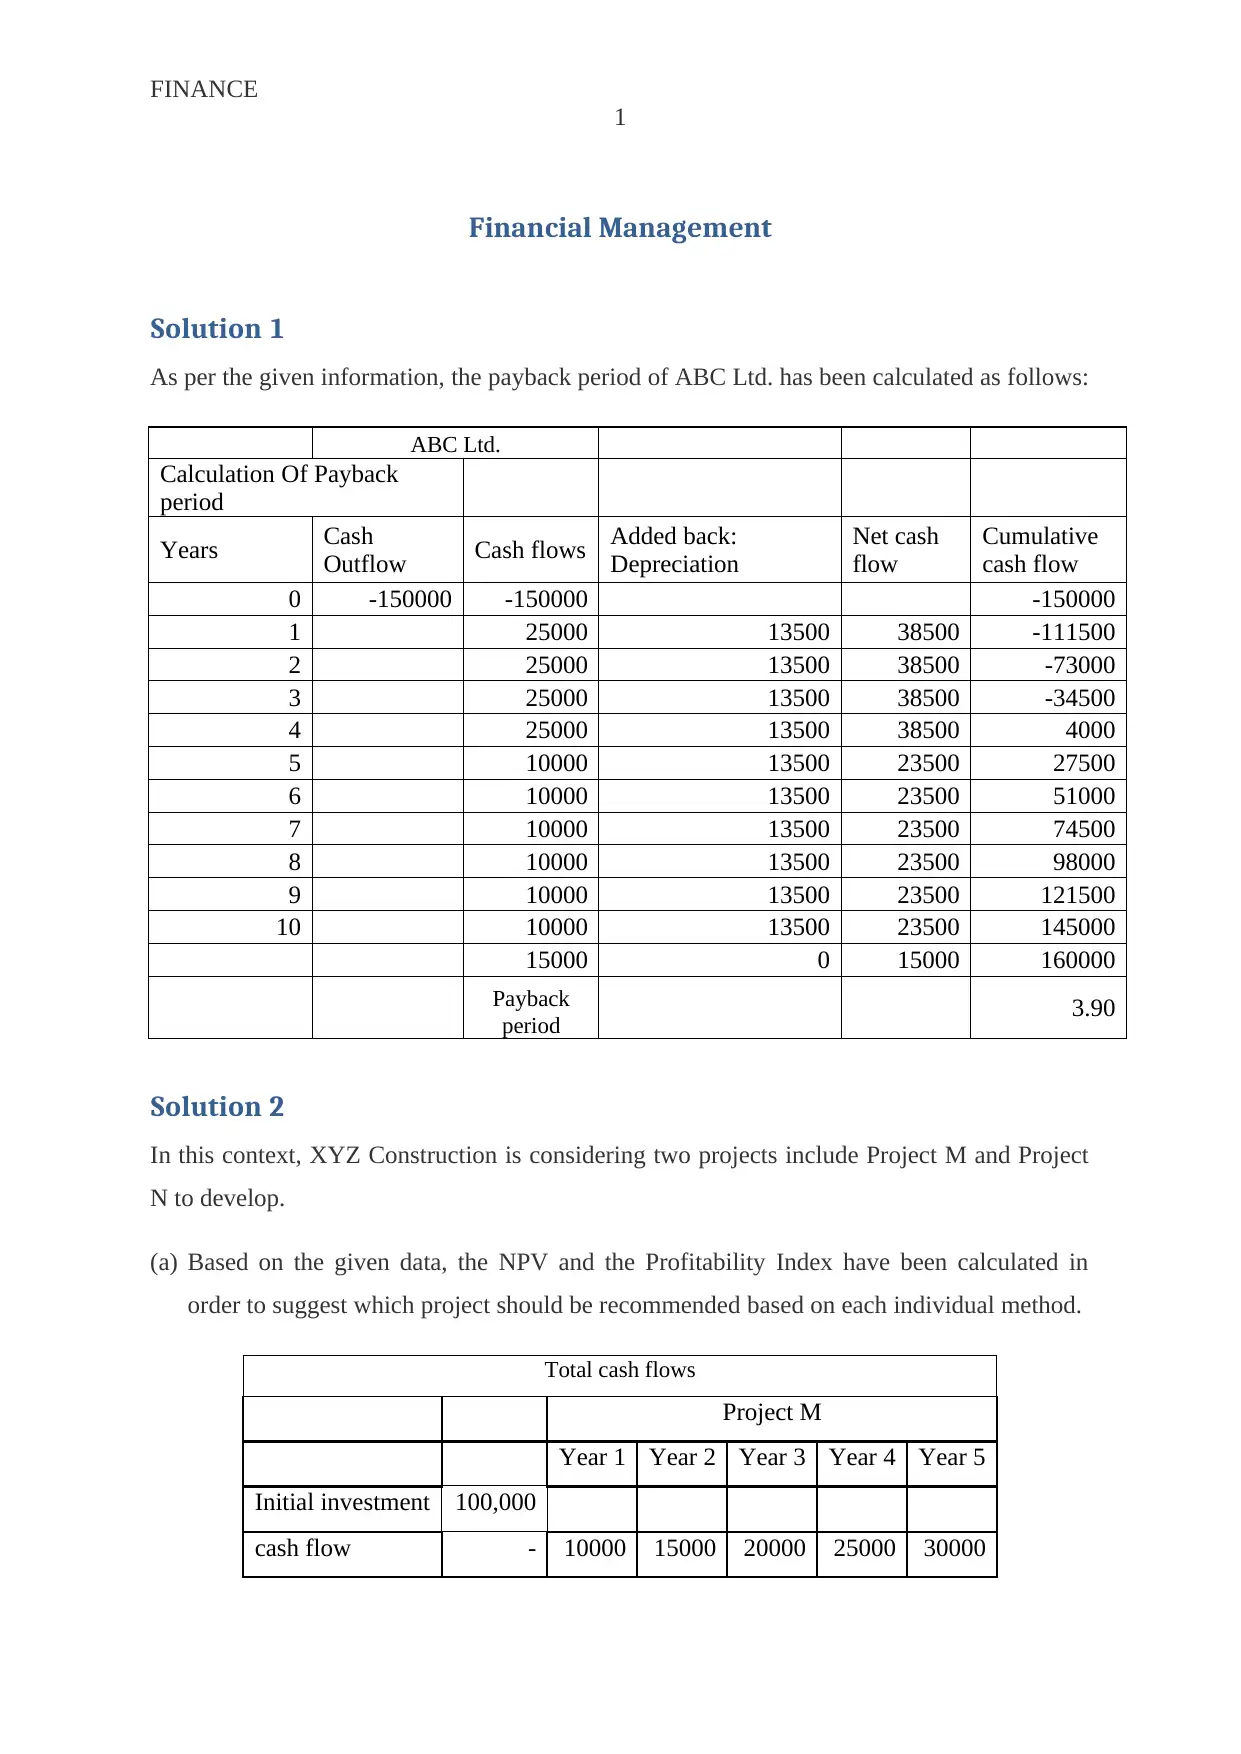
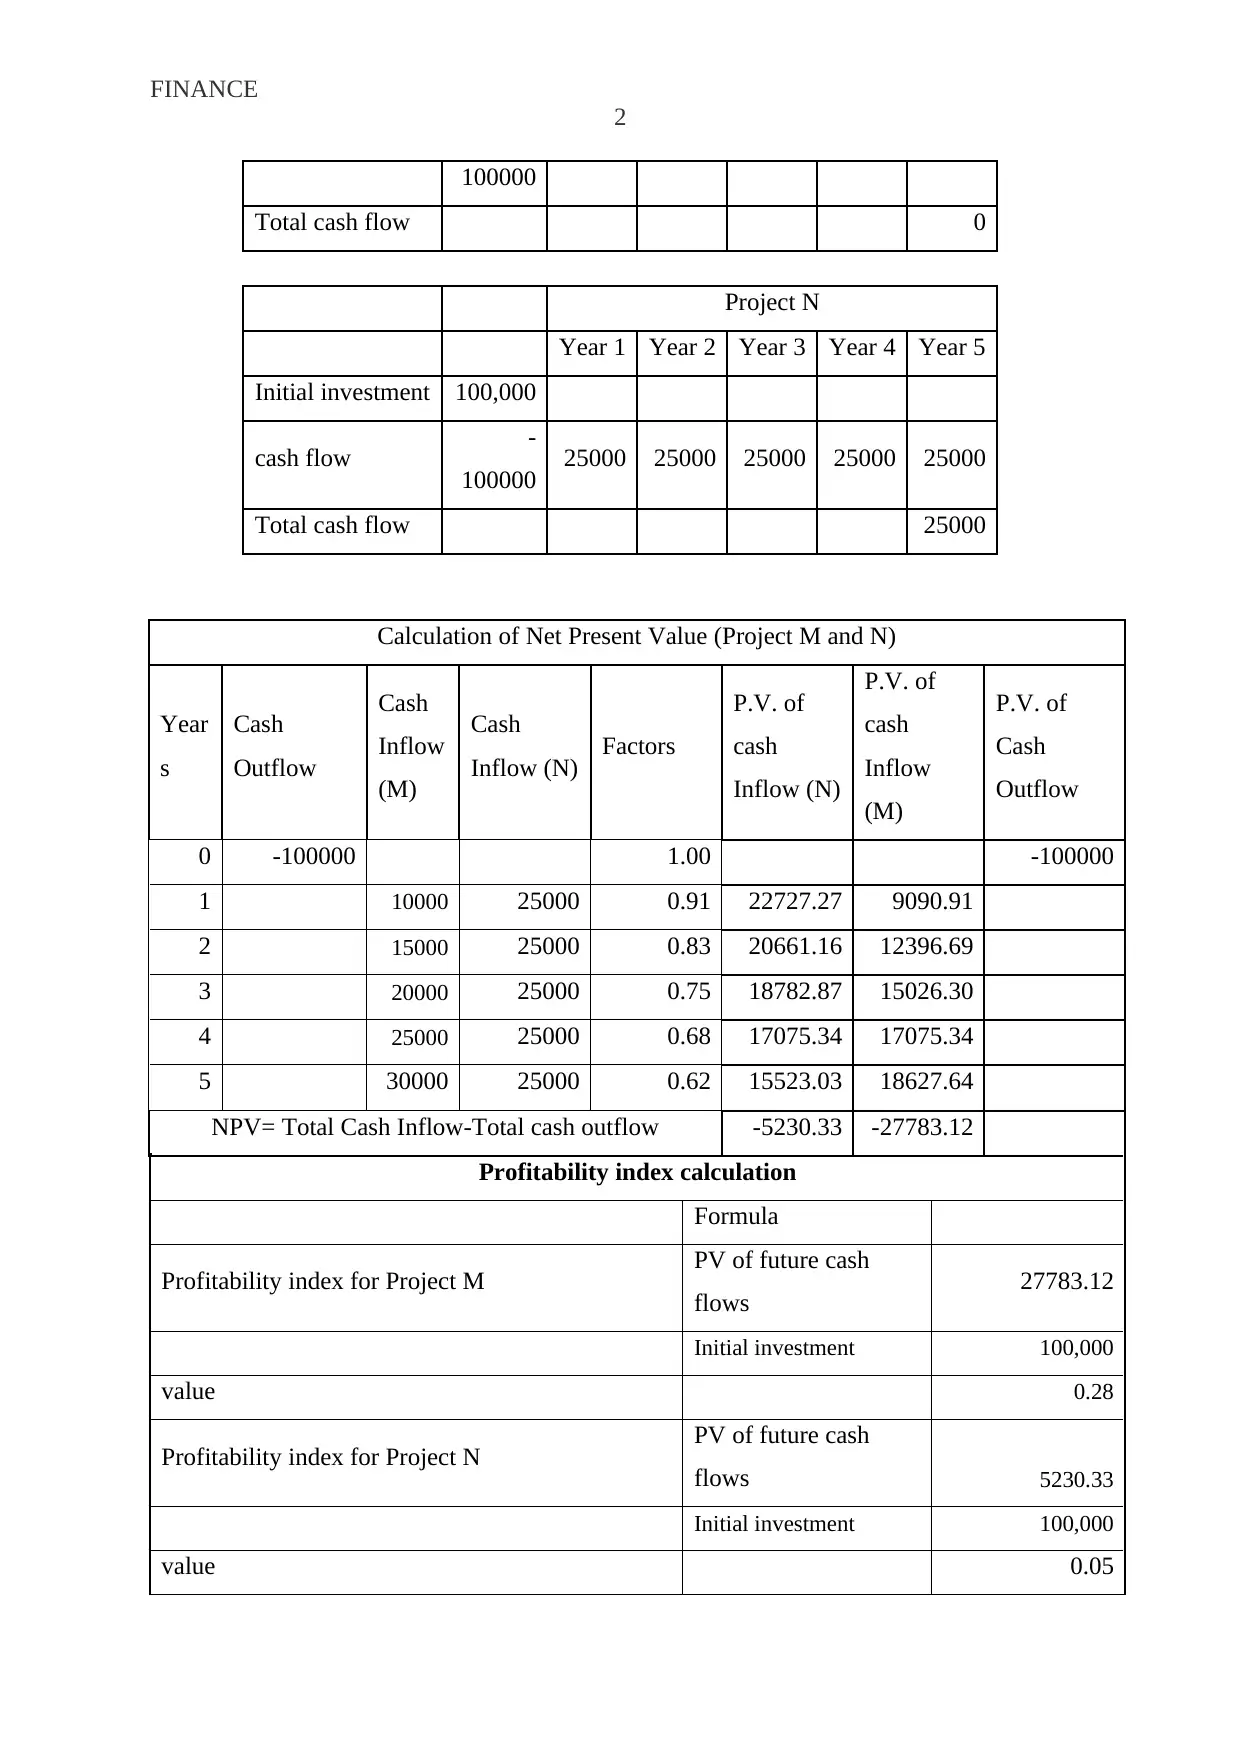
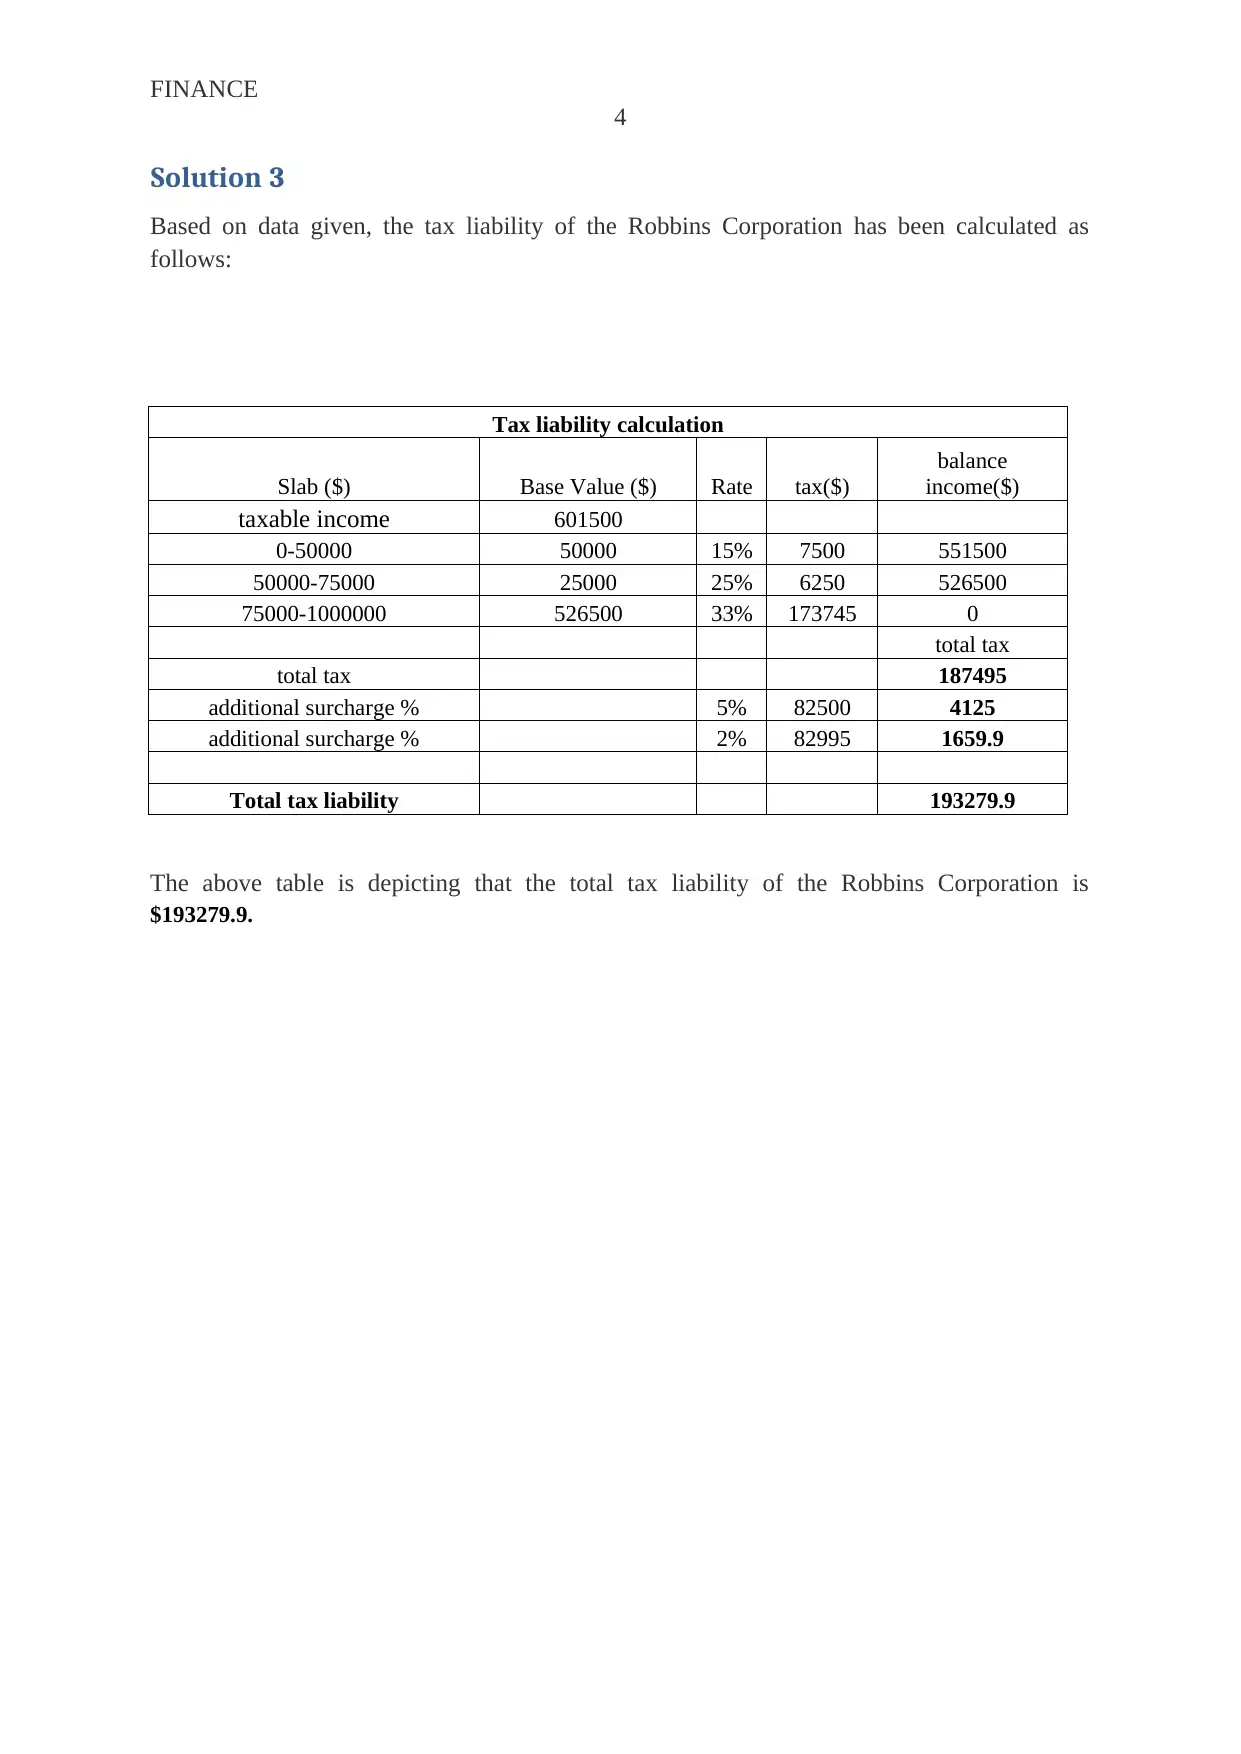
This financial management assignment solution provides detailed calculations and explanations for three key problems. The first problem calculates the payback period for ABC Ltd., considering cash outflows, inflows, and depreciation. The second problem analyzes two projects, M and N, using Net Present Value (NPV) and profitability index to determine the best investment. It also discusses the key decisions a finance manager must make, including working capital management, dividend policies, investment and financing decisions. The third problem calculates the tax liability of the Robbins Corporation based on its taxable income and the given corporate tax rates. The document includes the calculations, formulas, and relevant references.

Running Head: FINANCE
0
Financial Management
(Student Details: )
1/16/2020
0
Financial Management
(Student Details: )
1/16/2020
Paraphrase This Document
Need a fresh take? Get an instant paraphrase of this document with our AI Paraphraser

FINANCE
1
Financial Management
Solution 1
As per the given information, the payback period of ABC Ltd. has been calculated as follows:
ABC Ltd.
Calculation Of Payback
period
Years Cash
Outflow Cash flows Added back:
Depreciation
Net cash
flow
Cumulative
cash flow
0 -150000 -150000 -150000
1 25000 13500 38500 -111500
2 25000 13500 38500 -73000
3 25000 13500 38500 -34500
4 25000 13500 38500 4000
5 10000 13500 23500 27500
6 10000 13500 23500 51000
7 10000 13500 23500 74500
8 10000 13500 23500 98000
9 10000 13500 23500 121500
10 10000 13500 23500 145000
15000 0 15000 160000
Payback
period 3.90
Solution 2
In this context, XYZ Construction is considering two projects include Project M and Project
N to develop.
(a) Based on the given data, the NPV and the Profitability Index have been calculated in
order to suggest which project should be recommended based on each individual method.
Total cash flows
Project M
Year 1 Year 2 Year 3 Year 4 Year 5
Initial investment 100,000
cash flow - 10000 15000 20000 25000 30000

FINANCE
2
100000
Total cash flow 0
Project N
Year 1 Year 2 Year 3 Year 4 Year 5
Initial investment 100,000
cash flow -
100000 25000 25000 25000 25000 25000
Total cash flow 25000
Calculation of Net Present Value (Project M and N)
Year
s
Cash
Outflow
Cash
Inflow
(M)
Cash
Inflow (N) Factors
P.V. of
cash
Inflow (N)
P.V. of
cash
Inflow
(M)
P.V. of
Cash
Outflow
0 -100000 1.00 -100000
1 10000 25000 0.91 22727.27 9090.91
2 15000 25000 0.83 20661.16 12396.69
3 20000 25000 0.75 18782.87 15026.30
4 25000 25000 0.68 17075.34 17075.34
5 30000 25000 0.62 15523.03 18627.64
NPV= Total Cash Inflow-Total cash outflow -5230.33 -27783.12
Profitability index calculation
Formula
Profitability index for Project M PV of future cash
flows 27783.12
Initial investment 100,000
value 0.28
Profitability index for Project N PV of future cash
flows 5230.33
Initial investment 100,000
value 0.05
⊘ This is a preview!⊘
Do you want full access?
Subscribe today to unlock all pages.

Trusted by 1+ million students worldwide

FINANCE
3
In this way, based on the above calculations, it is clear that the value of NPV for the projects
M and N are found as -27783.12 and -5230.33 respectively. Based on NPV, the
recommended project is Project N. Moreover, based on the profitability index, Project M is
suggested.
(b) In financial management, there can be a number of decisions require to be taken by the
finance manager from the organizational growth perspective. In this context, the main
aspects of decision-making into financial management are working capital management,
dividends, investment and financing (Ehrhardt & Brigham, 2016). Thus, key decisions in
the context of financial management are as follows:
Working-capital management-related decisions
Dividend decisions (Ehrhardt & Brigham, 2016).
Financing decisions and Capital structure
Long-term investment or capital budgeting decisions
In addition to that, the financial manager also takes decisions such as short-term decisions
and financing decisions (ConnectAmericas, 2020). Here, the financial manager of an
organization should always have the capability of addressing all the aforementioned key
financial management decisions. While talking about investment decisions, capital budgeting
is mainly considered so that the most suitable investment that will bring maximum profit for
the organization can be counted into investment decisions. On the other hand, investments
decisions are taken by the financial manager usually consider the return on investment, cash
flow, the risk involved, and investment criteria (ConnectAmericas, 2020). Furthermore,
financing decisions can be segmented into 2 major categories include borrowed fund and
owner fund. Therefore, the finance manager needs to decide how much investment is to be
raised by the owners’ funds and how much money is to be raised from the borrowed fund.
Thus, the financial manager always compares the profits and disadvantages of the different
finance sources while taking decisions (Ehrhardt & Brigham, 2016). There are some
examples of such organizations which have become successful due to efficient financial
decisions include Wal-Mart, Google, Apple, Tesco and BHP-Billiton. On the other hand,
there are so many organizations those have faced serious financial crisis due to bad financial
decisions such as Comet, Kmart, Compaq, Lehman Brothers and many more.
Paraphrase This Document
Need a fresh take? Get an instant paraphrase of this document with our AI Paraphraser

FINANCE
4
Solution 3
Based on data given, the tax liability of the Robbins Corporation has been calculated as
follows:
Tax liability calculation
Slab ($) Base Value ($) Rate tax($)
balance
income($)
taxable income 601500
0-50000 50000 15% 7500 551500
50000-75000 25000 25% 6250 526500
75000-1000000 526500 33% 173745 0
total tax
total tax 187495
additional surcharge % 5% 82500 4125
additional surcharge % 2% 82995 1659.9
Total tax liability 193279.9
The above table is depicting that the total tax liability of the Robbins Corporation is
$193279.9.

FINANCE
5
References
ConnectAmericas, 2020. What decisions must a Financial Manager make? [Online]
Available at: https://connectamericas.com/content/what-decisions-must-financial-manager-
make [Accessed 2020].
Ehrhardt, M. & Brigham, E., 2016. Corporate finance: A focused approach. UK: Cengage
Learning.
5
References
ConnectAmericas, 2020. What decisions must a Financial Manager make? [Online]
Available at: https://connectamericas.com/content/what-decisions-must-financial-manager-
make [Accessed 2020].
Ehrhardt, M. & Brigham, E., 2016. Corporate finance: A focused approach. UK: Cengage
Learning.
⊘ This is a preview!⊘
Do you want full access?
Subscribe today to unlock all pages.

Trusted by 1+ million students worldwide
1 out of 6