Financial Reporting and Control Research Paper 2022
Added on 2022-09-27
22 Pages3753 Words22 Views
Financial reporting and control
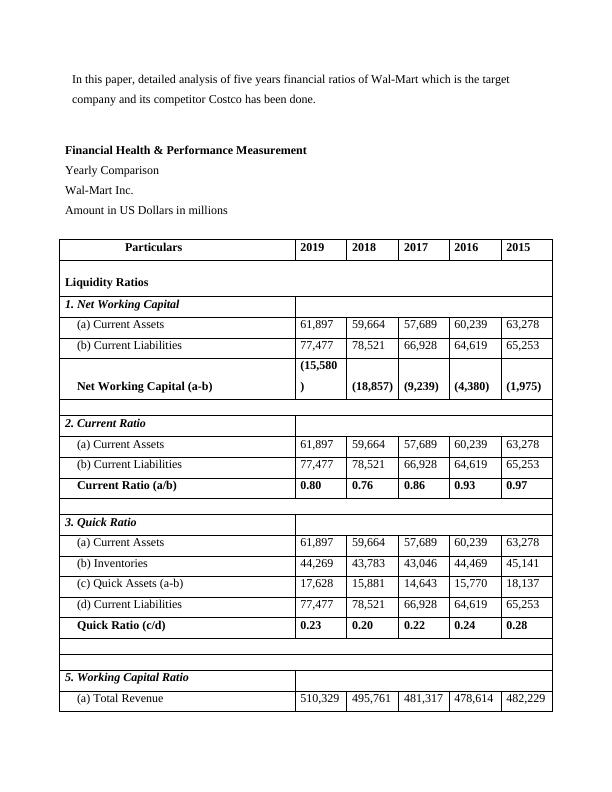
In this paper, detailed analysis of five years financial ratios of Wal-Mart which is the target
company and its competitor Costco has been done.
Financial Health & Performance Measurement
Yearly Comparison
Wal-Mart Inc.
Amount in US Dollars in millions
Particulars 2019 2018 2017 2016 2015
Liquidity Ratios
1. Net Working Capital
(a) Current Assets 61,897 59,664 57,689 60,239 63,278
(b) Current Liabilities 77,477 78,521 66,928 64,619 65,253
Net Working Capital (a-b)
(15,580
) (18,857) (9,239) (4,380) (1,975)
2. Current Ratio
(a) Current Assets 61,897 59,664 57,689 60,239 63,278
(b) Current Liabilities 77,477 78,521 66,928 64,619 65,253
Current Ratio (a/b) 0.80 0.76 0.86 0.93 0.97
3. Quick Ratio
(a) Current Assets 61,897 59,664 57,689 60,239 63,278
(b) Inventories 44,269 43,783 43,046 44,469 45,141
(c) Quick Assets (a-b) 17,628 15,881 14,643 15,770 18,137
(d) Current Liabilities 77,477 78,521 66,928 64,619 65,253
Quick Ratio (c/d) 0.23 0.20 0.22 0.24 0.28
5. Working Capital Ratio
(a) Total Revenue 510,329 495,761 481,317 478,614 482,229
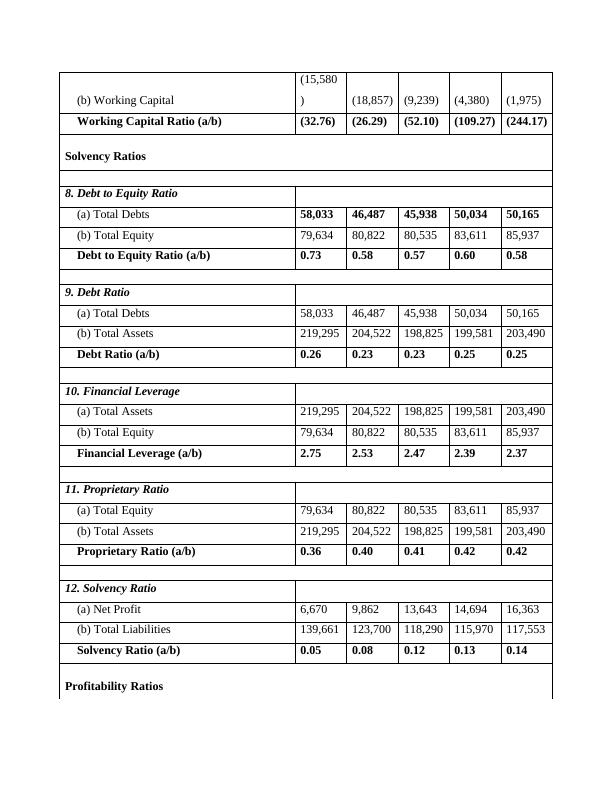
(b) Working Capital
(15,580
) (18,857) (9,239) (4,380) (1,975)
Working Capital Ratio (a/b) (32.76) (26.29) (52.10) (109.27) (244.17)
Solvency Ratios
8. Debt to Equity Ratio
(a) Total Debts 58,033 46,487 45,938 50,034 50,165
(b) Total Equity 79,634 80,822 80,535 83,611 85,937
Debt to Equity Ratio (a/b) 0.73 0.58 0.57 0.60 0.58
9. Debt Ratio
(a) Total Debts 58,033 46,487 45,938 50,034 50,165
(b) Total Assets 219,295 204,522 198,825 199,581 203,490
Debt Ratio (a/b) 0.26 0.23 0.23 0.25 0.25
10. Financial Leverage
(a) Total Assets 219,295 204,522 198,825 199,581 203,490
(b) Total Equity 79,634 80,822 80,535 83,611 85,937
Financial Leverage (a/b) 2.75 2.53 2.47 2.39 2.37
11. Proprietary Ratio
(a) Total Equity 79,634 80,822 80,535 83,611 85,937
(b) Total Assets 219,295 204,522 198,825 199,581 203,490
Proprietary Ratio (a/b) 0.36 0.40 0.41 0.42 0.42
12. Solvency Ratio
(a) Net Profit 6,670 9,862 13,643 14,694 16,363
(b) Total Liabilities 139,661 123,700 118,290 115,970 117,553
Solvency Ratio (a/b) 0.05 0.08 0.12 0.13 0.14
Profitability Ratios
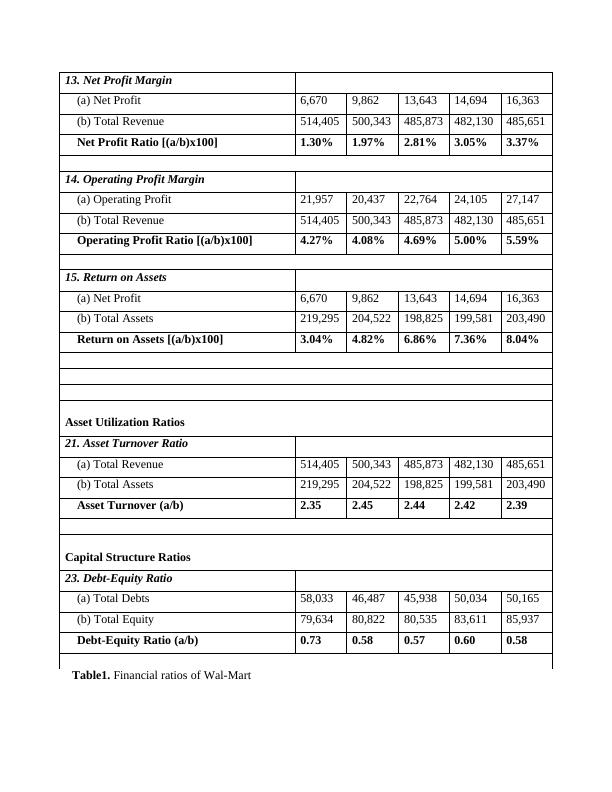
13. Net Profit Margin
(a) Net Profit 6,670 9,862 13,643 14,694 16,363
(b) Total Revenue 514,405 500,343 485,873 482,130 485,651
Net Profit Ratio [(a/b)x100] 1.30% 1.97% 2.81% 3.05% 3.37%
14. Operating Profit Margin
(a) Operating Profit 21,957 20,437 22,764 24,105 27,147
(b) Total Revenue 514,405 500,343 485,873 482,130 485,651
Operating Profit Ratio [(a/b)x100] 4.27% 4.08% 4.69% 5.00% 5.59%
15. Return on Assets
(a) Net Profit 6,670 9,862 13,643 14,694 16,363
(b) Total Assets 219,295 204,522 198,825 199,581 203,490
Return on Assets [(a/b)x100] 3.04% 4.82% 6.86% 7.36% 8.04%
Asset Utilization Ratios
21. Asset Turnover Ratio
(a) Total Revenue 514,405 500,343 485,873 482,130 485,651
(b) Total Assets 219,295 204,522 198,825 199,581 203,490
Asset Turnover (a/b) 2.35 2.45 2.44 2.42 2.39
Capital Structure Ratios
23. Debt-Equity Ratio
(a) Total Debts 58,033 46,487 45,938 50,034 50,165
(b) Total Equity 79,634 80,822 80,535 83,611 85,937
Debt-Equity Ratio (a/b) 0.73 0.58 0.57 0.60 0.58
Table1. Financial ratios of Wal-Mart
(a) Net Profit 6,670 9,862 13,643 14,694 16,363
(b) Total Revenue 514,405 500,343 485,873 482,130 485,651
Net Profit Ratio [(a/b)x100] 1.30% 1.97% 2.81% 3.05% 3.37%
14. Operating Profit Margin
(a) Operating Profit 21,957 20,437 22,764 24,105 27,147
(b) Total Revenue 514,405 500,343 485,873 482,130 485,651
Operating Profit Ratio [(a/b)x100] 4.27% 4.08% 4.69% 5.00% 5.59%
15. Return on Assets
(a) Net Profit 6,670 9,862 13,643 14,694 16,363
(b) Total Assets 219,295 204,522 198,825 199,581 203,490
Return on Assets [(a/b)x100] 3.04% 4.82% 6.86% 7.36% 8.04%
Asset Utilization Ratios
21. Asset Turnover Ratio
(a) Total Revenue 514,405 500,343 485,873 482,130 485,651
(b) Total Assets 219,295 204,522 198,825 199,581 203,490
Asset Turnover (a/b) 2.35 2.45 2.44 2.42 2.39
Capital Structure Ratios
23. Debt-Equity Ratio
(a) Total Debts 58,033 46,487 45,938 50,034 50,165
(b) Total Equity 79,634 80,822 80,535 83,611 85,937
Debt-Equity Ratio (a/b) 0.73 0.58 0.57 0.60 0.58
Table1. Financial ratios of Wal-Mart
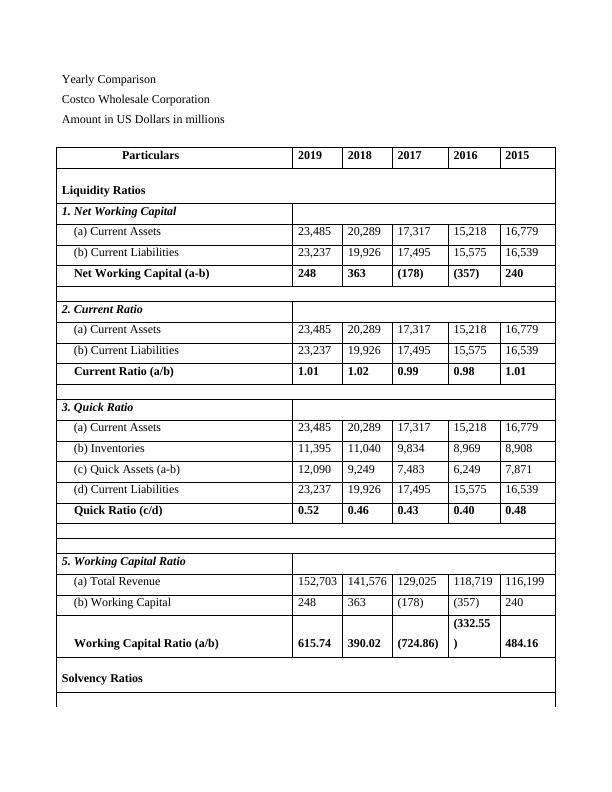
Financial Health & Performance Measurement
Yearly Comparison
Costco Wholesale Corporation
Amount in US Dollars in millions
Particulars 2019 2018 2017 2016 2015
Liquidity Ratios
1. Net Working Capital
(a) Current Assets 23,485 20,289 17,317 15,218 16,779
(b) Current Liabilities 23,237 19,926 17,495 15,575 16,539
Net Working Capital (a-b) 248 363 (178) (357) 240
2. Current Ratio
(a) Current Assets 23,485 20,289 17,317 15,218 16,779
(b) Current Liabilities 23,237 19,926 17,495 15,575 16,539
Current Ratio (a/b) 1.01 1.02 0.99 0.98 1.01
3. Quick Ratio
(a) Current Assets 23,485 20,289 17,317 15,218 16,779
(b) Inventories 11,395 11,040 9,834 8,969 8,908
(c) Quick Assets (a-b) 12,090 9,249 7,483 6,249 7,871
(d) Current Liabilities 23,237 19,926 17,495 15,575 16,539
Quick Ratio (c/d) 0.52 0.46 0.43 0.40 0.48
5. Working Capital Ratio
(a) Total Revenue 152,703 141,576 129,025 118,719 116,199
(b) Working Capital 248 363 (178) (357) 240
Working Capital Ratio (a/b) 615.74 390.02 (724.86)
(332.55
) 484.16
Solvency Ratios
End of preview
Want to access all the pages? Upload your documents or become a member.
Related Documents
Financial Analysis of Thomas Cook: Reasons for Failure and Comparison with Competitor TUI Travelslg...
|11
|2402
|80
Financial Analysis Management Tasklg...
|7
|1512
|12
financial accountinglg...
|13
|369
|84
Comparison of Financial Statements: Wal-Mart vs IKEA Grouplg...
|6
|1053
|374
Report on Accounting financial analysislg...
|7
|1187
|15
Accounting and Financial Management: Analysis of Wal-Martlg...
|15
|1695
|456