Linear Scenario Analysis: Analyzing Age and Height Regression Data
VerifiedAdded on 2022/09/27
|4
|532
|34
Homework Assignment
AI Summary
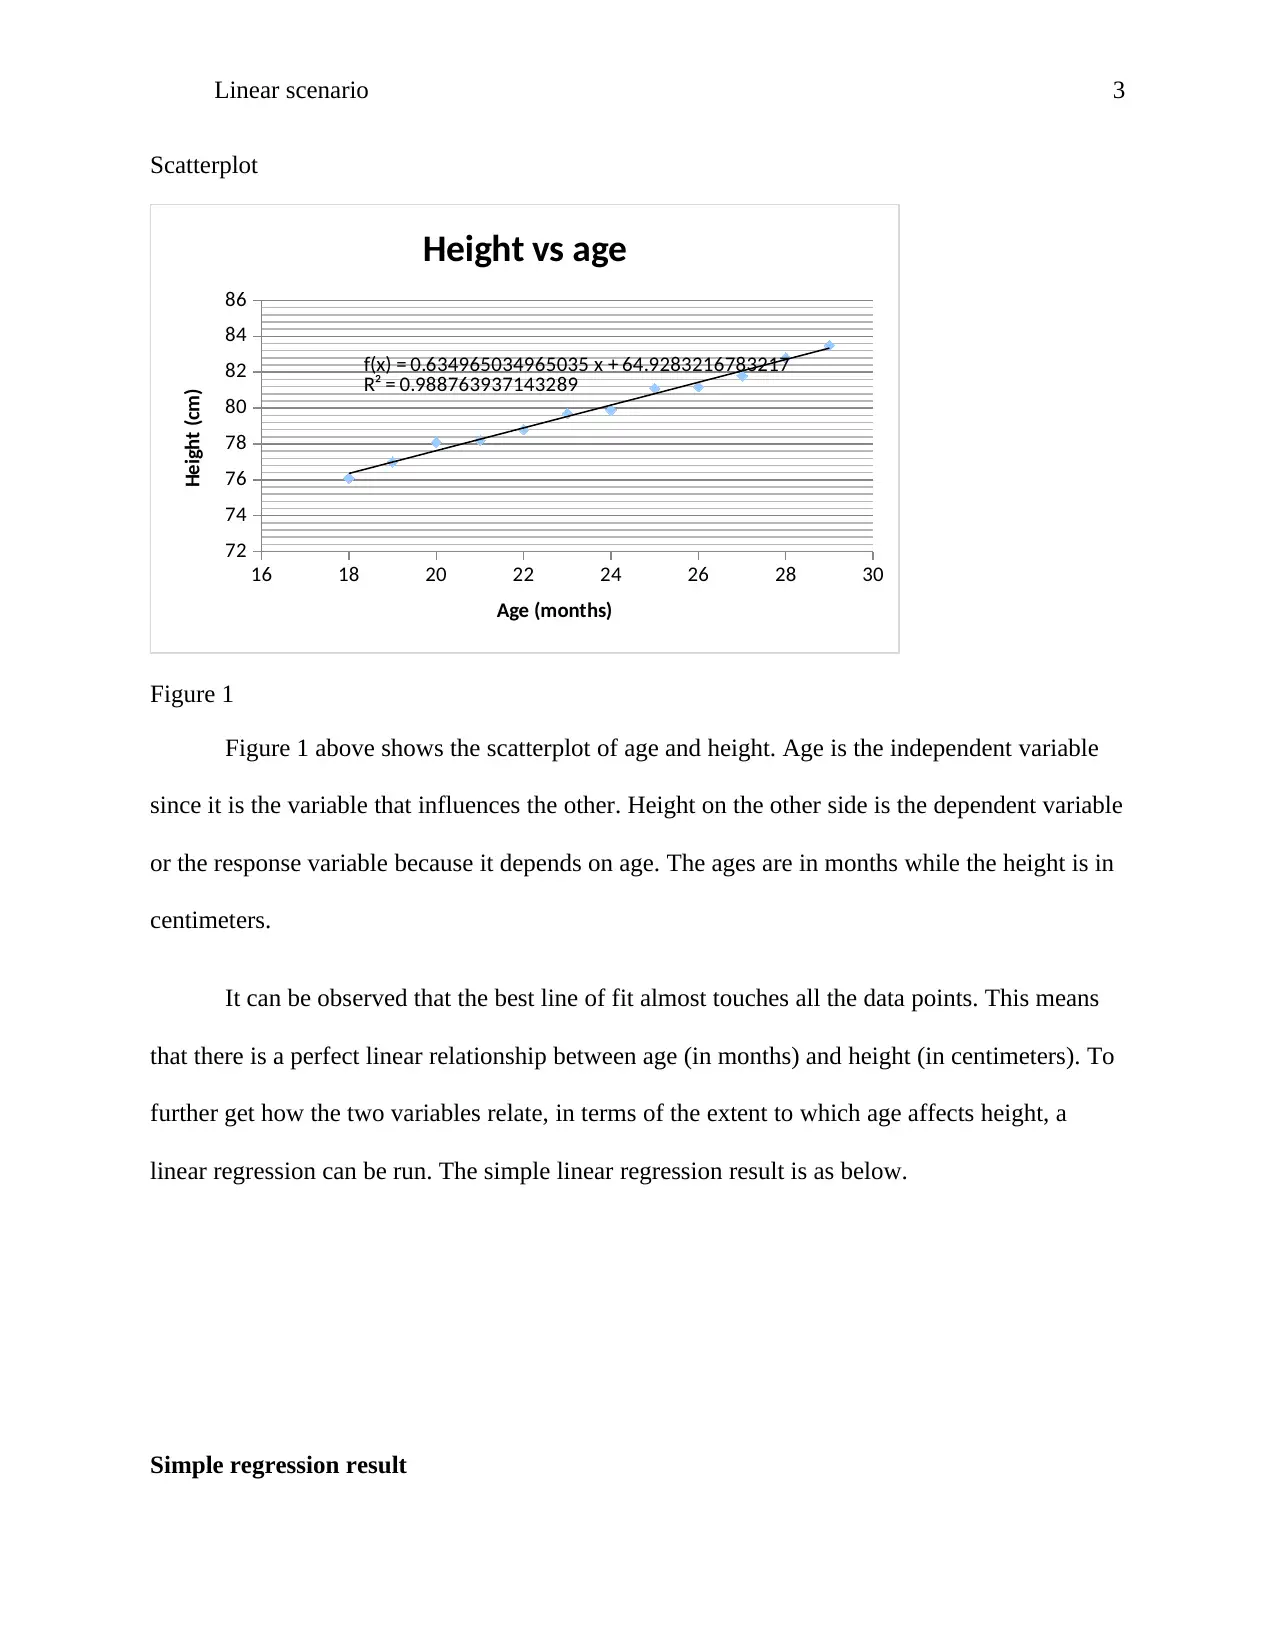
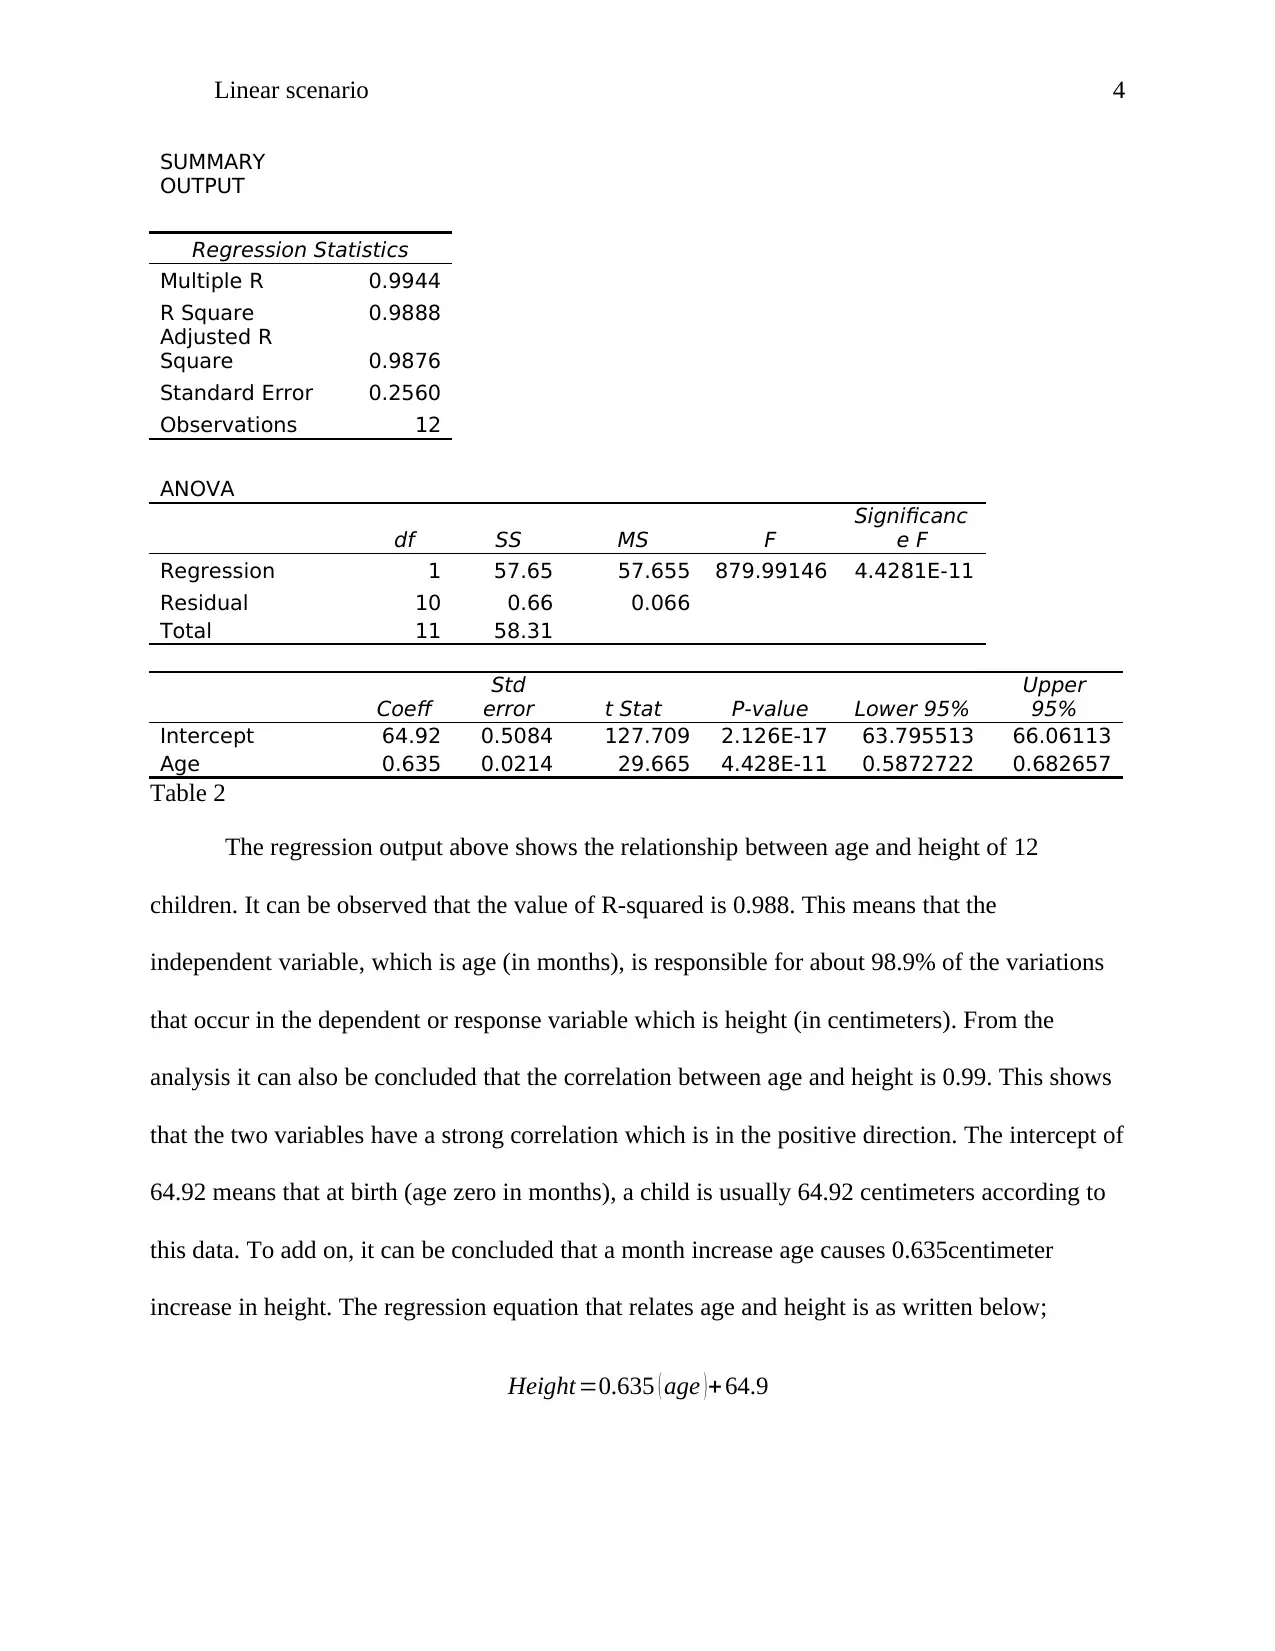
This assignment presents a linear scenario analysis, focusing on the relationship between age and height using a dataset of 12 individuals. The introduction defines linearity and provides a real-world example of age and height correlation. A scatterplot visualizes the data, showing the relationship between age (independent variable) and height (dependent variable). The analysis then proceeds with a simple linear regression, providing key statistical outputs such as R-squared, which indicates the proportion of variance in height explained by age. The R-squared value of 0.988 demonstrates a strong linear relationship. The correlation coefficient of 0.99 further supports a strong positive correlation. The regression equation is derived, and the intercept and coefficient values are interpreted, showing the relationship between age and height. The analysis effectively demonstrates the use of linear regression to model and interpret the relationship between two variables, providing valuable insights into the data and drawing meaningful conclusions.

1 out of 4
Related Documents


Your All-in-One AI-Powered Toolkit for Academic Success.
+13062052269
info@desklib.com
Available 24*7 on WhatsApp / Email
![[object Object]](/_next/static/media/star-bottom.7253800d.svg)
Copyright © 2020–2026 A2Z Services. All Rights Reserved. Developed and managed by ZUCOL.