Masterminding the Perfect Outing: Trend Analysis of Flight Prices
VerifiedAdded on 2019/09/18
|16
|1979
|483
Report
AI Summary
The provided assignment content discusses the concept of autocorrelation in time series analysis, specifically focusing on the Autocorrelation Function (ACF) to identify trends and correlations in airline ticket prices. The ACF is used to analyze four different airlines for three routes, including ORD-SEA, HKG-PEG, LGW-MAD, and JFK-LAS. The results show that some airlines have a trend, indicating non-stationarity and autocorrelation, while others do not follow any pattern, suggesting uncorrelated data with no trend. The analysis also highlights the importance of considering seasonality in time series data, as seen in the Delta Airlines' data for the JFK-LAS route.
Contribute Materials
Your contribution can guide someone’s learning journey. Share your
documents today.

Running Head: ASSIGNMENT
airlines analysis
[Document subtitle]
airlines analysis
[Document subtitle]
Secure Best Marks with AI Grader
Need help grading? Try our AI Grader for instant feedback on your assignments.
ASSIGNMENT 1
Introduction
As per instructions, routes that are chosen for business location are Chicago,USA(ORD) to
Seattle, USA(SEA) and Hongkong(HKG) to Beijing, China(PEK). Also for leisure location
the routes chosen are London, United Kingdom (LGW) to Madrid, Spain (MAD) and New
York, USA(JFK) to Las Vegas, USA(LAS).All the flights have 5th December, 2016 as their
destination time.
Selection of Airlines
1. For ORD- SEA route four flights are chosen. They are:
South West Airline
United Airline
American Airline
Alaska Airline
All flights mentioned above takes 4h34min to 4h40min to travel to destined location. All
fights have B737 aircraft type. Therefore both the requirement of similar type and similar
capacity.
2. For HKG-PEG route also four flights are chosen:
Dragon Air
China Southern
Air China
Hongkong Airlines
Above routes are for business location.
3. For LGW_MAD route three flights are chosen. They are:

ASSIGNMENT 2
Air Europa
Iberia
Easy Jet
4. For JFK-Las route also three flights are chosen:
Jet Blue
American Airlines
Delta
Above two destinations are for leisure destination.
Presentation of the data
The below graphs show the fluctuation of ticket prices with the passage of time. The graphs
below are four routes. Two for business routes and two for leisure routes.
The above graph shows price fluctuations with time for four different airlines on same route.
The price of southwest airlines and Alaska airlines got merged after first month and then
increased at the same rate. Also, American airlines has higher rate than the south west airline

ASSIGNMENT 3
and Alaska airline but lower than the united airlines. For united airlines, there is sudden
increase in rates in the last days of October and then increases gradually.
For the HKG-PEK route, the prices decrease as the time passes. The lowest price is charged
by china southern airlines. The highest cost of fare is charged by dragon air. There is
similarity for all the airlines that the prices decreased from their initial level.
Paraphrase This Document
Need a fresh take? Get an instant paraphrase of this document with our AI Paraphraser
ASSIGNMENT 4
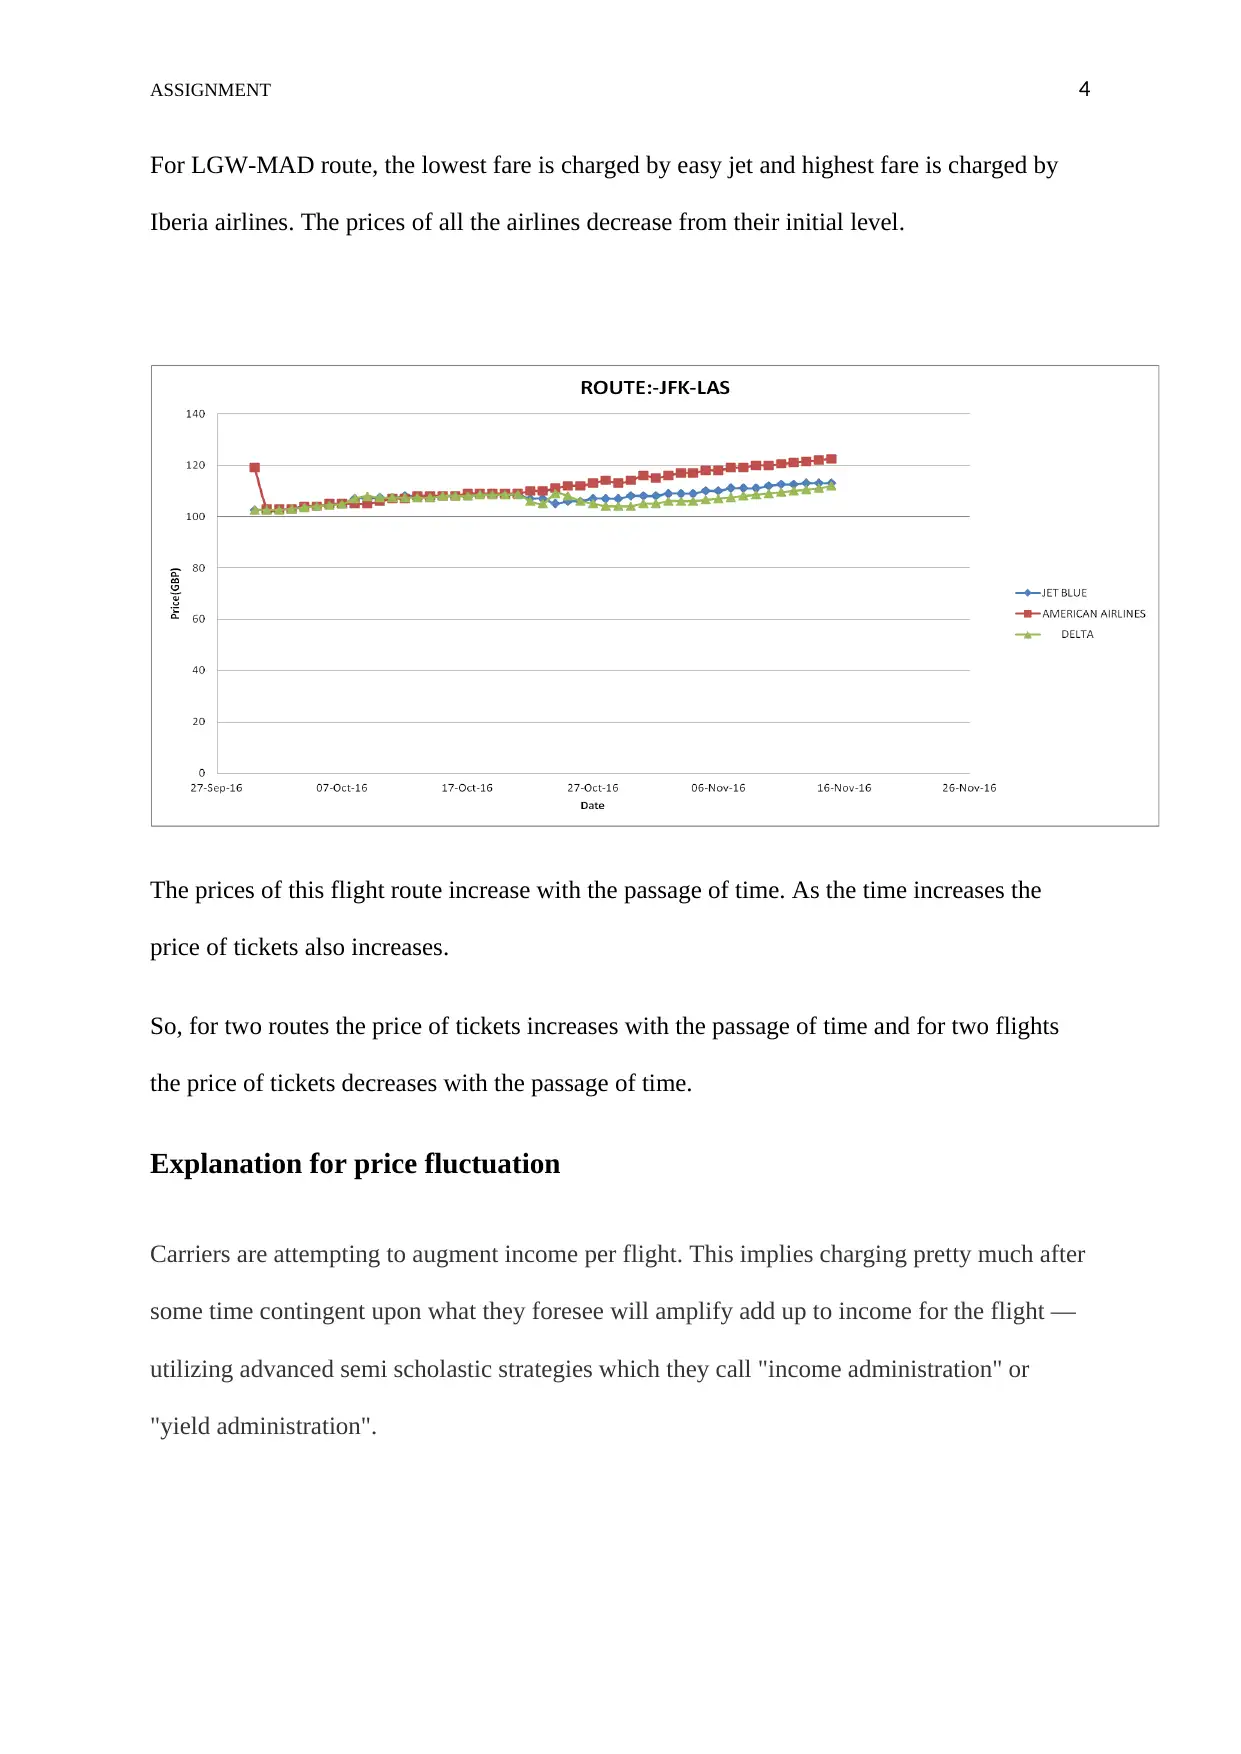
For LGW-MAD route, the lowest fare is charged by easy jet and highest fare is charged by
Iberia airlines. The prices of all the airlines decrease from their initial level.
The prices of this flight route increase with the passage of time. As the time increases the
price of tickets also increases.
So, for two routes the price of tickets increases with the passage of time and for two flights
the price of tickets decreases with the passage of time.
Explanation for price fluctuation
Carriers are attempting to augment income per flight. This implies charging pretty much after
some time contingent upon what they foresee will amplify add up to income for the flight —
utilizing advanced semi scholastic strategies which they call "income administration" or
"yield administration".

ASSIGNMENT 5
It's bad to leave a ton of seats exhaust (you charged an excessive amount of and could have
profited with a deal). It's likewise not ready out totally full (you charged pretty much nothing
and are losing cash on the excursion).
The aircraft item is additionally exceptionally abnormal — the thing they are offering comes
in irregular amounts and has a brief span restrain. Assume JetBlue is flying an A320 flying
machine from BOS-ORD. That airplane has 150 seats. In the event that JetBlue just offers
140 seats, the rest of the 10 seats "die" after takeoff time. Also, they can't, care for, give back
those seats to the producer; they have a 50-situate plane and a 150-situate plane and a 200-
situate plane and that is about as much control as they get over their item.
Confounding, the item (a seat on a plane) is worth generously more to a few people than
others. There are a wide range of voyagers to suit: a minute ago business explorers who will
pay a high cost for a helpful flight; book-route ahead of time vacationers who have become
some time off and need to mastermind an agreeable outing and quit thinking about it;
relaxation voyagers who will take whoever is least expensive on Kayak. The aircrafts need to
offer basically a similar item (a seat on a flight) to all these distinctive market sections while
attempting to boost income from people in each of them.
Carriers can fragment the market in a bundle of courses — by really offering an alternate
item (five star versus mentor), by offering an item with various qualities (better/more
regrettable toll decides on a flight that permit changes or refundability).
They can likewise change the cost of a similar item, which is the thing that you as a rule see
happening when you see "the cost of flights evolving". What you mean is that the least
expensive accessible ticket on a given flight gets progressively and less costly after some

ASSIGNMENT 6
time. This normally occurs as an endeavour to boost income in view of (1) time of
procurement examples (ensuring a minute ago buys are costly) or (2) keeping the flight as
full as they need it (raising costs on a flight which is taking care of up with a specific end
goal to lessen deals and keep down stock for those costly a minute ago costly buys).
The correct examples of admissions after some time fluctuate in light of the aircraft (and the
clients they get).
On no-change-expenses Southwest, reserving ahead of time is extraordinary for relaxation
explorers. Voyagers precisely look for when Southwest "augments the calendar" to book at
the edges and shoddy tickets are generally accessible way out. In any case, as the flight date
approaches and the flight tops off, costs get way high, leaving space for business voyagers
who will pay more for a decent timetable.
On United, costs begin high since they would prefer not to fill the plane too soon at too
minimal effort; costs will plunge to match contenders' business; costs may hit a nadir a
couple of months out on especially exhaust flights; and inside 1-3 weeks flights get costly to
catch a minute ago business explorers. (UA just said in a late discussion with financial
specialists that they fouled up a couple quarters back and coincidentally sold an excessive
number of modest seats too far ahead of time, so they're going to take a stab at keeping costs
high until near takeoff to kinda play "chicken" with clients.)
As a flight tops off, tickets get more costly, in light of the fact that the aircraft needs to keep
down stock that could conceivably be sold to a costly a minute ago cost inhumane client. As
travelers scratch off or change their arrangements, or as rivalry or business reasons request a
deal or a value climb, costs may go up or down.
Data analysis
Secure Best Marks with AI Grader
Need help grading? Try our AI Grader for instant feedback on your assignments.

ASSIGNMENT 7
To find the trend and correlation, Autocorrelation function (ACF) [1] can be used to draw
correlogram through which we can see trends.
One simple test of stationarity (or trend) is based on the so-called autocorrelation function
(ACF). The ACF at lag k, denoted by ρk, is defined as ρk = γk/γ0= covariance at lag
k/variance.
Note that if k = 0, ρ0 = 1
Since both covariance and variance are measured in the same units of measurement, ρk is a
unit less, or pure, number. It lies between −1 and +1, as any correlation coefficient does. If
we plot ρk against k, the graph we obtain is known as the population correlogram.[2]
For ORD- SEA route four flights are chosen. They are:
South West Airline
United Airline
American Airline
Alaska Airline
For all the four airlines ACF is shown in graphs. If ACF decreases or increases gradually then
it shows non stationarity and autocorrelation. If it doesn’t follow any pattern then it is
uncorrelated and doesn’t have any trend.
For South West Airlines ACF is given below

ASSIGNMENT 8
Series SWA represents South West Airlines with increasing lags. As the ACF is decreasing
slowly with increasing lags, follows a trend and also is correlated.
Series UA represents United Airlines. It also has trend
Series SWA represents South West Airlines with increasing lags. As the ACF is decreasing
slowly with increasing lags, follows a trend and also is correlated.
Series UA represents United Airlines. It also has trend

ASSIGNMENT 9
Series AA represents American Ailines.The American Ailrlines also shows trend.
For HKG-PEG route also four flights are chosen:
Dragon Air
China Southern
Air China
Hongkong Airlines
For all the three airlines ACF is shown in graphs. If ACF decreases or increases gradually
then it shows non stationarity and autocorrelation. If it doesn’t follow any pattern then it is
uncorrelated and doesn’t have any trend.
The below graph shows Autocorrelation function for Drafon Air Airlines. It doesnt show any
trend and it seems not to be correlated.
The below graph shows Autocorrelation function for China Southern Air Airlines. It shows
trend and it seems to be correlated
Paraphrase This Document
Need a fresh take? Get an instant paraphrase of this document with our AI Paraphraser

ASSIGNMENT 10
The below graph shows Autocorrelation function for Air ChinaAir Airlines. It shows trend
and it seems to be correlated
The below graph shows Autocorrelation function for Air HongKong Airlines. It shows trend
and it seems to be correlated
The below graph shows Autocorrelation function for Air ChinaAir Airlines. It shows trend
and it seems to be correlated
The below graph shows Autocorrelation function for Air HongKong Airlines. It shows trend
and it seems to be correlated

ASSIGNMENT 11
For LGW_MAD route three flights are chosen. They are:
Air Europa
Iberia
Easy Jet
For all the three airlines ACF is shown in graphs. If ACF decreases or increases gradually
then it shows non stationarity and autocorrelation. If it doesn’t follow any pattern then it
is uncorrelated and doesn’t have any trend.
The Series AE represents Air Europa Airlines. This graph shows autocorrelation.
This time series doesn’t have any trend.

ASSIGNMENT 12
The Series AE represents Iberia Airlines. This graph shows autocorrelation. This time
series have trend.
The Series AE represents Easy Jet Airlines. This graph shows autocorrelation. This
time series have trend.
For JFK-Las route also three flights are chosen:
Jet Blue
American Airlines
Delta
For all the three airlines ACF is shown in graphs. If ACF decreases or increases gradually
then it shows non stationarity and autocorrelation. If it doesn’t follow any pattern then it
is uncorrelated and doesn’t have any trend.
Secure Best Marks with AI Grader
Need help grading? Try our AI Grader for instant feedback on your assignments.
ASSIGNMENT 13
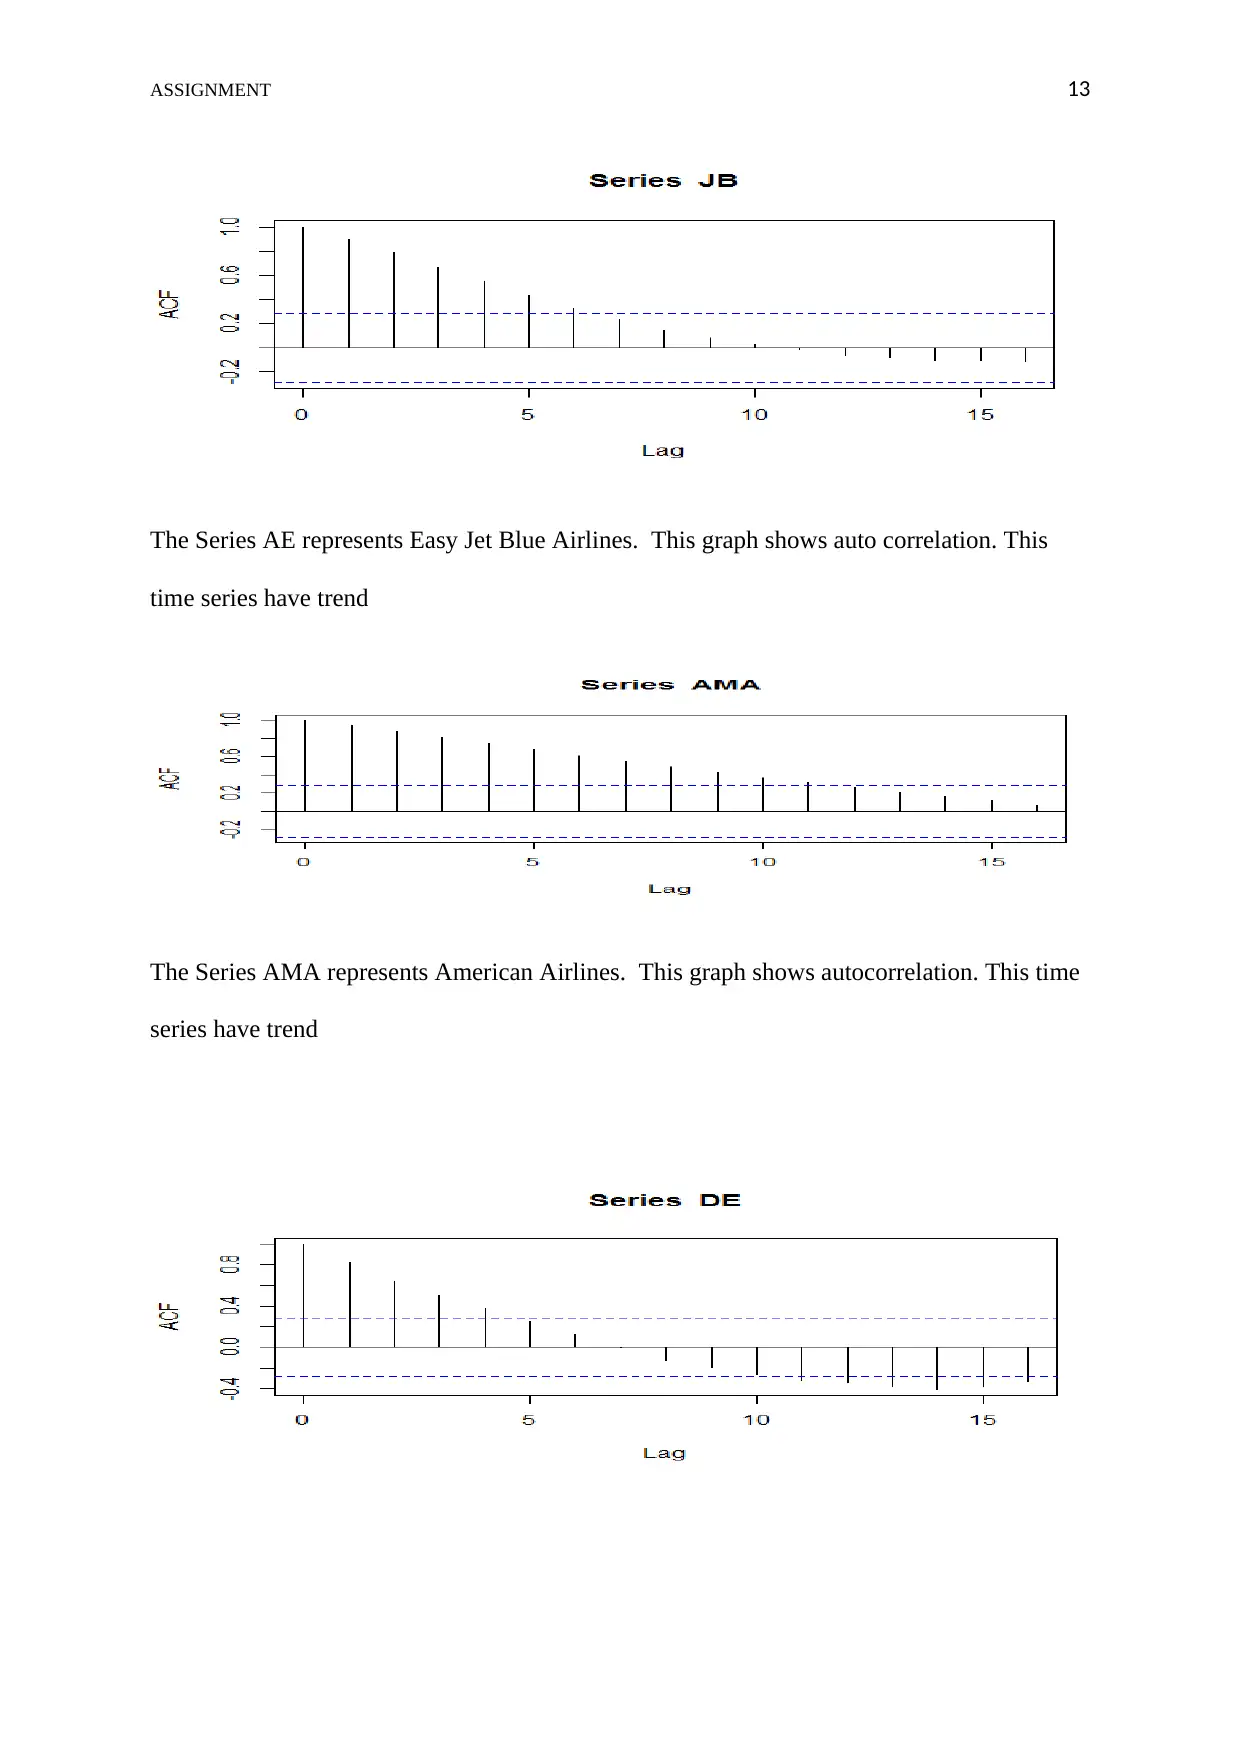
The Series AE represents Easy Jet Blue Airlines. This graph shows auto correlation. This
time series have trend
The Series AMA represents American Airlines. This graph shows autocorrelation. This time
series have trend
The Series AE represents Easy Jet Blue Airlines. This graph shows auto correlation. This
time series have trend
The Series AMA represents American Airlines. This graph shows autocorrelation. This time
series have trend

ASSIGNMENT 14
The Series DE represents Delta Airlines. This graph shows auto correlation . This time series
have seasonal trend
The Series DE represents Delta Airlines. This graph shows auto correlation . This time series
have seasonal trend
ASSIGNMENT 15
Reference:
Anon, “Autocorrelation”, Accessed from:
http://www.itl.nist.gov/div898/handbook/eda/section3/eda35c.htm
Anon, “Time Series Analysis”, Accessed from:
http://www.wright.edu/~thaddeus.tarpey/ES714timeseries.pdf
Chatfield (2004), The Analysis of Time Series, Chapman & Hall.
Gujarati D.N. ,”Basic Econometrics” , Accessed from:
https://www.hse.ru/data/2011/04/26/1210823708/Gujarati%20D.N.%20Basic
%20Econometrics,%203e,%201995.pdf
1 out of 16
Related Documents

Your All-in-One AI-Powered Toolkit for Academic Success.
+13062052269
info@desklib.com
Available 24*7 on WhatsApp / Email
![[object Object]](/_next/static/media/star-bottom.7253800d.svg)
Unlock your academic potential
© 2024 | Zucol Services PVT LTD | All rights reserved.