BUECO5903: Macroeconomics Assignment B - Semester 1 Analysis
VerifiedAdded on 2023/03/21
|11
|1813
|48
Homework Assignment
AI Summary
This assignment solution for a macroeconomics course (BUECO5903) addresses key macroeconomic concepts. It begins by differentiating between demand-pull and cost-push inflation, providing diagrams and causes for each. The solution then examines how firm managers' skill improvements, perso...

Running head: ASSIGNMENT B 1
MACROECONOMICS: ASSIGNMENT B
Student Name
Institutional Affiliation
Facilitator
Course
Date
MACROECONOMICS: ASSIGNMENT B
Student Name
Institutional Affiliation
Facilitator
Course
Date
Paraphrase This Document
Need a fresh take? Get an instant paraphrase of this document with our AI Paraphraser
ASSIGNMENT B 2
Question3
a.
i. Demand-pull Inflation
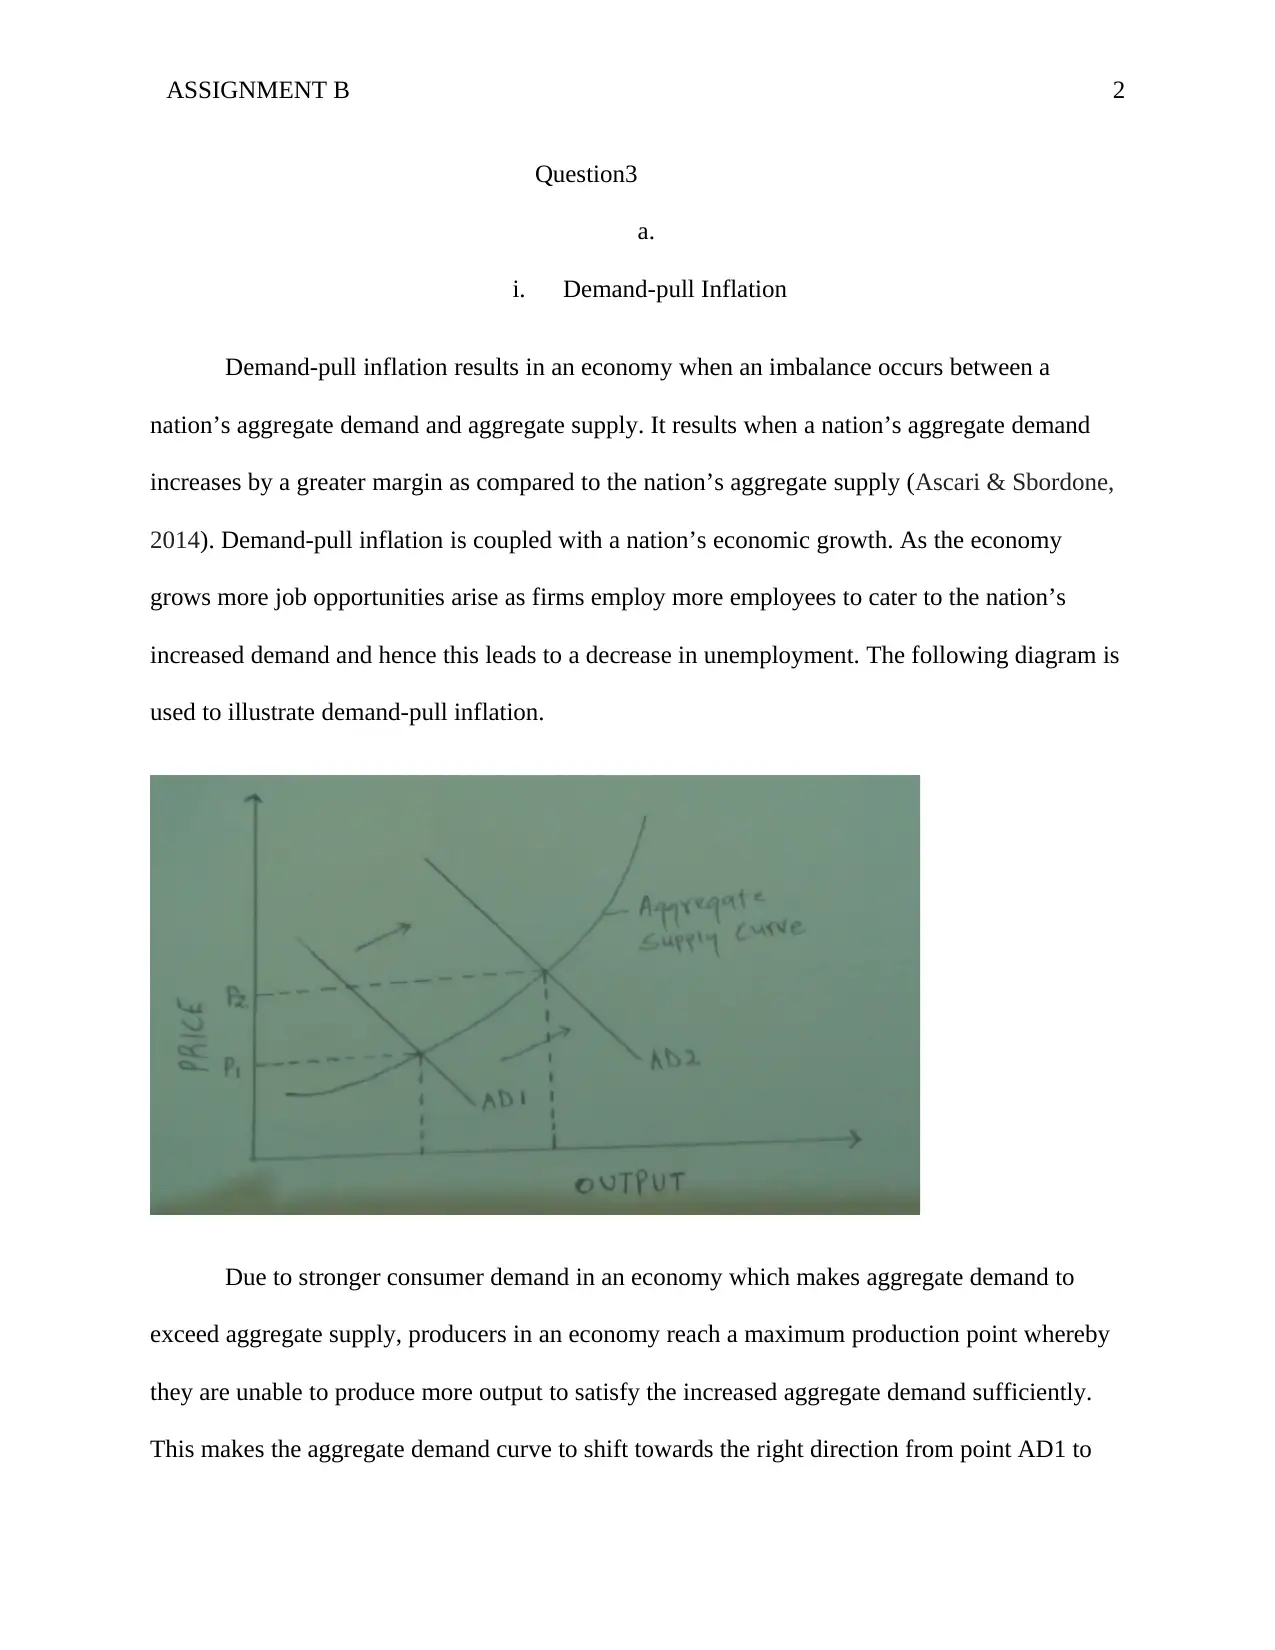
Demand-pull inflation results in an economy when an imbalance occurs between a
nation’s aggregate demand and aggregate supply. It results when a nation’s aggregate demand
increases by a greater margin as compared to the nation’s aggregate supply (Ascari & Sbordone,
2014). Demand-pull inflation is coupled with a nation’s economic growth. As the economy
grows more job opportunities arise as firms employ more employees to cater to the nation’s
increased demand and hence this leads to a decrease in unemployment. The following diagram is
used to illustrate demand-pull inflation.
Due to stronger consumer demand in an economy which makes aggregate demand to
exceed aggregate supply, producers in an economy reach a maximum production point whereby
they are unable to produce more output to satisfy the increased aggregate demand sufficiently.
This makes the aggregate demand curve to shift towards the right direction from point AD1 to
Question3
a.
i. Demand-pull Inflation
Demand-pull inflation results in an economy when an imbalance occurs between a
nation’s aggregate demand and aggregate supply. It results when a nation’s aggregate demand
increases by a greater margin as compared to the nation’s aggregate supply (Ascari & Sbordone,
2014). Demand-pull inflation is coupled with a nation’s economic growth. As the economy
grows more job opportunities arise as firms employ more employees to cater to the nation’s
increased demand and hence this leads to a decrease in unemployment. The following diagram is
used to illustrate demand-pull inflation.
Due to stronger consumer demand in an economy which makes aggregate demand to
exceed aggregate supply, producers in an economy reach a maximum production point whereby
they are unable to produce more output to satisfy the increased aggregate demand sufficiently.
This makes the aggregate demand curve to shift towards the right direction from point AD1 to
ASSIGNMENT B 3
AD2 and this makes the nation’s general price for products to rise from P1 to P2 and this leads to
demand-pull inflation.
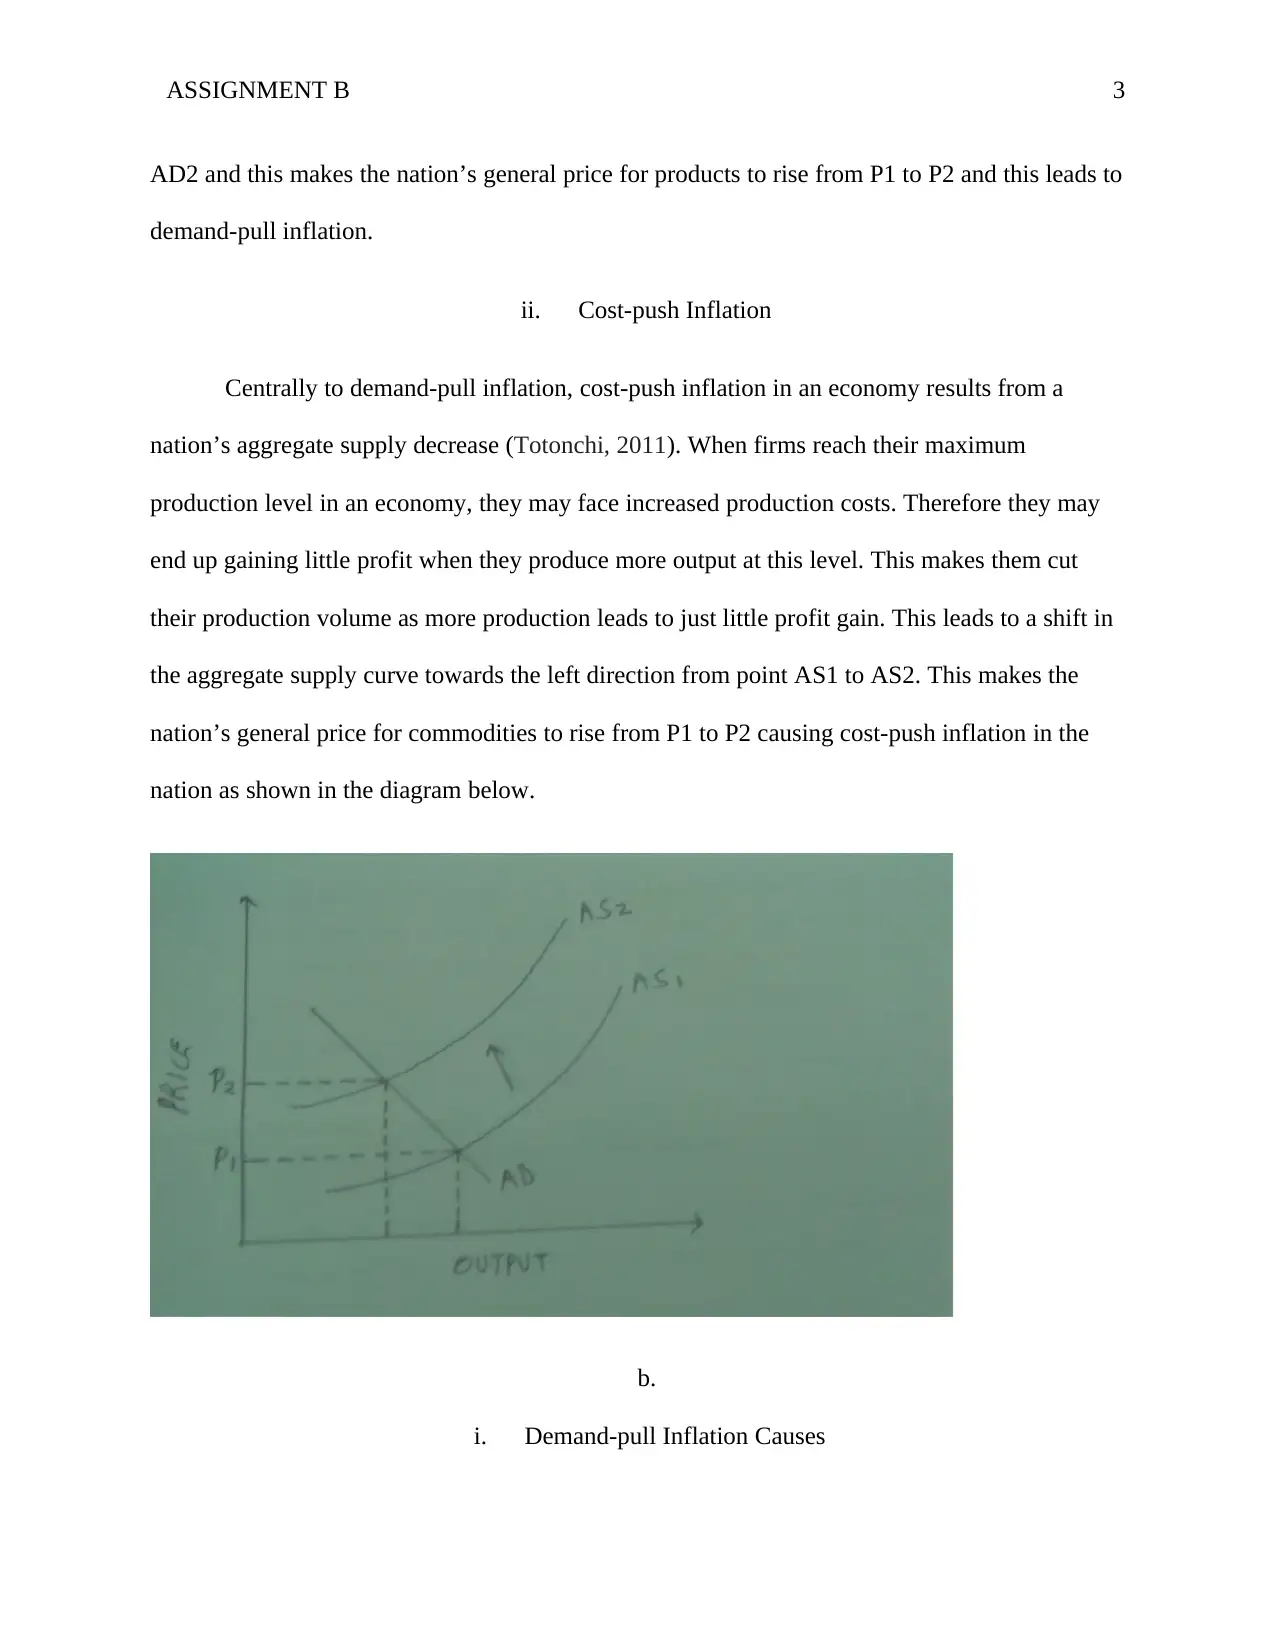
ii. Cost-push Inflation
Centrally to demand-pull inflation, cost-push inflation in an economy results from a
nation’s aggregate supply decrease (Totonchi, 2011). When firms reach their maximum
production level in an economy, they may face increased production costs. Therefore they may
end up gaining little profit when they produce more output at this level. This makes them cut
their production volume as more production leads to just little profit gain. This leads to a shift in
the aggregate supply curve towards the left direction from point AS1 to AS2. This makes the
nation’s general price for commodities to rise from P1 to P2 causing cost-push inflation in the
nation as shown in the diagram below.
b.
i. Demand-pull Inflation Causes
AD2 and this makes the nation’s general price for products to rise from P1 to P2 and this leads to
demand-pull inflation.
ii. Cost-push Inflation
Centrally to demand-pull inflation, cost-push inflation in an economy results from a
nation’s aggregate supply decrease (Totonchi, 2011). When firms reach their maximum
production level in an economy, they may face increased production costs. Therefore they may
end up gaining little profit when they produce more output at this level. This makes them cut
their production volume as more production leads to just little profit gain. This leads to a shift in
the aggregate supply curve towards the left direction from point AS1 to AS2. This makes the
nation’s general price for commodities to rise from P1 to P2 causing cost-push inflation in the
nation as shown in the diagram below.
b.
i. Demand-pull Inflation Causes
⊘ This is a preview!⊘
Do you want full access?
Subscribe today to unlock all pages.
Trusted by 1+ million students worldwide
ASSIGNMENT B 4
Consumers’ expectations of prices for goods and services to increase in the future: This
makes consumers buy more goods and services to avoid future higher prices. As a result
aggregate demand increases while the aggregate supply decreases and this leads to an increase in
prices.
A rise in the income level of consumers: When consumers have more income, they
increase their spending. This increases their demand and hence makes a nation’s aggregate
demand to increase at a faster pace as compared to aggregate supply. This leads to a price rise.
Cost-push Inflation Causes
A rise in employees’ salaries: When employees’ salaries are increased either by trade
unions or other labor organizations in a nation, employers pass the salary increment burden to
final consumers inform of increased prices. This leads to cost-push inflation as it increases
producers’ production costs which are paid by the final consumers.
A rise in profit margin for companies: An increase in profit margin for companies makes
them increase commodities prices. This leads to cost-push inflation as it is classified under
production costs which are met by the final consumers.
Question5
a.
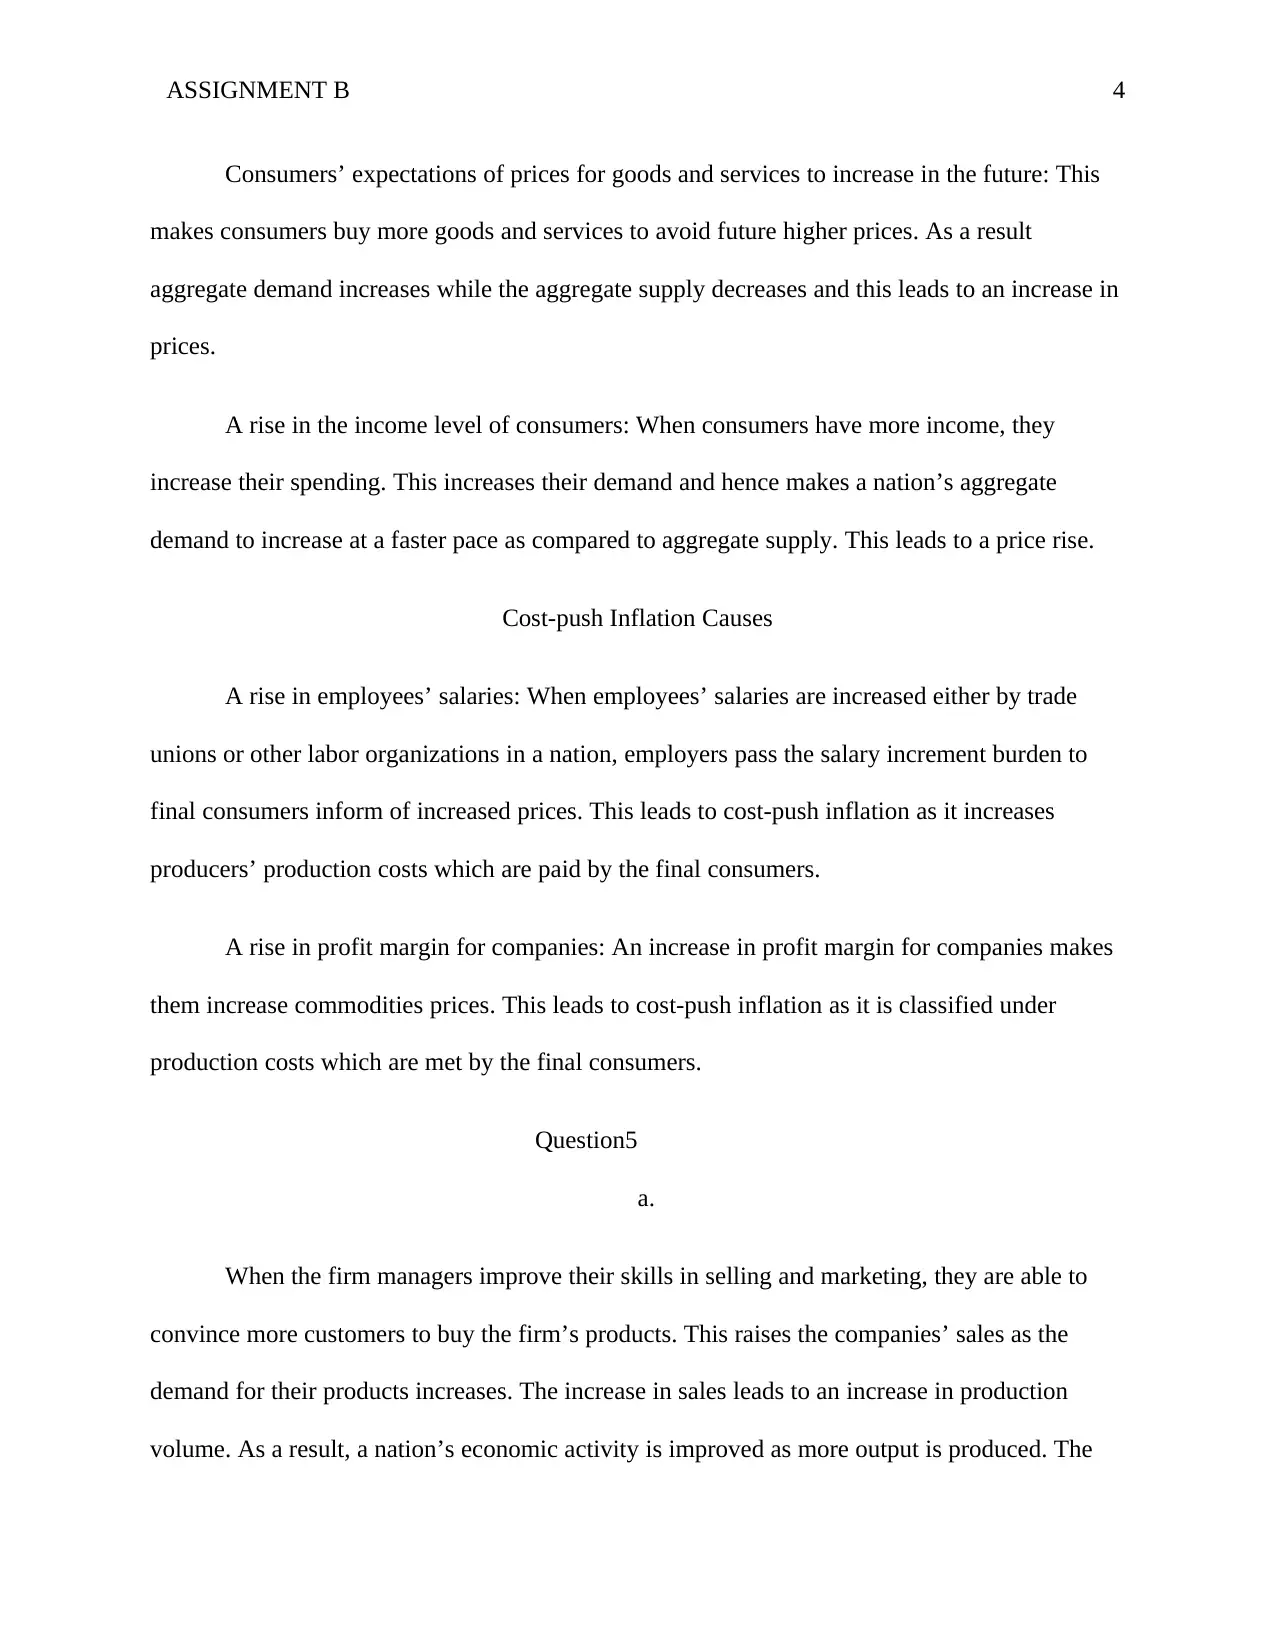
When the firm managers improve their skills in selling and marketing, they are able to
convince more customers to buy the firm’s products. This raises the companies’ sales as the
demand for their products increases. The increase in sales leads to an increase in production
volume. As a result, a nation’s economic activity is improved as more output is produced. The
Consumers’ expectations of prices for goods and services to increase in the future: This
makes consumers buy more goods and services to avoid future higher prices. As a result
aggregate demand increases while the aggregate supply decreases and this leads to an increase in
prices.
A rise in the income level of consumers: When consumers have more income, they
increase their spending. This increases their demand and hence makes a nation’s aggregate
demand to increase at a faster pace as compared to aggregate supply. This leads to a price rise.
Cost-push Inflation Causes
A rise in employees’ salaries: When employees’ salaries are increased either by trade
unions or other labor organizations in a nation, employers pass the salary increment burden to
final consumers inform of increased prices. This leads to cost-push inflation as it increases
producers’ production costs which are paid by the final consumers.
A rise in profit margin for companies: An increase in profit margin for companies makes
them increase commodities prices. This leads to cost-push inflation as it is classified under
production costs which are met by the final consumers.
Question5
a.
When the firm managers improve their skills in selling and marketing, they are able to
convince more customers to buy the firm’s products. This raises the companies’ sales as the
demand for their products increases. The increase in sales leads to an increase in production
volume. As a result, a nation’s economic activity is improved as more output is produced. The
Paraphrase This Document
Need a fresh take? Get an instant paraphrase of this document with our AI Paraphraser
ASSIGNMENT B 5
nation’s aggregate demand curve shifts towards the right direction from point AD1 to AD2. The
quantity of output demanded increases from Q0 to Q1 hence improving the economic activity
while prices increase from P0 to P1. An illustration is shown below.
b.
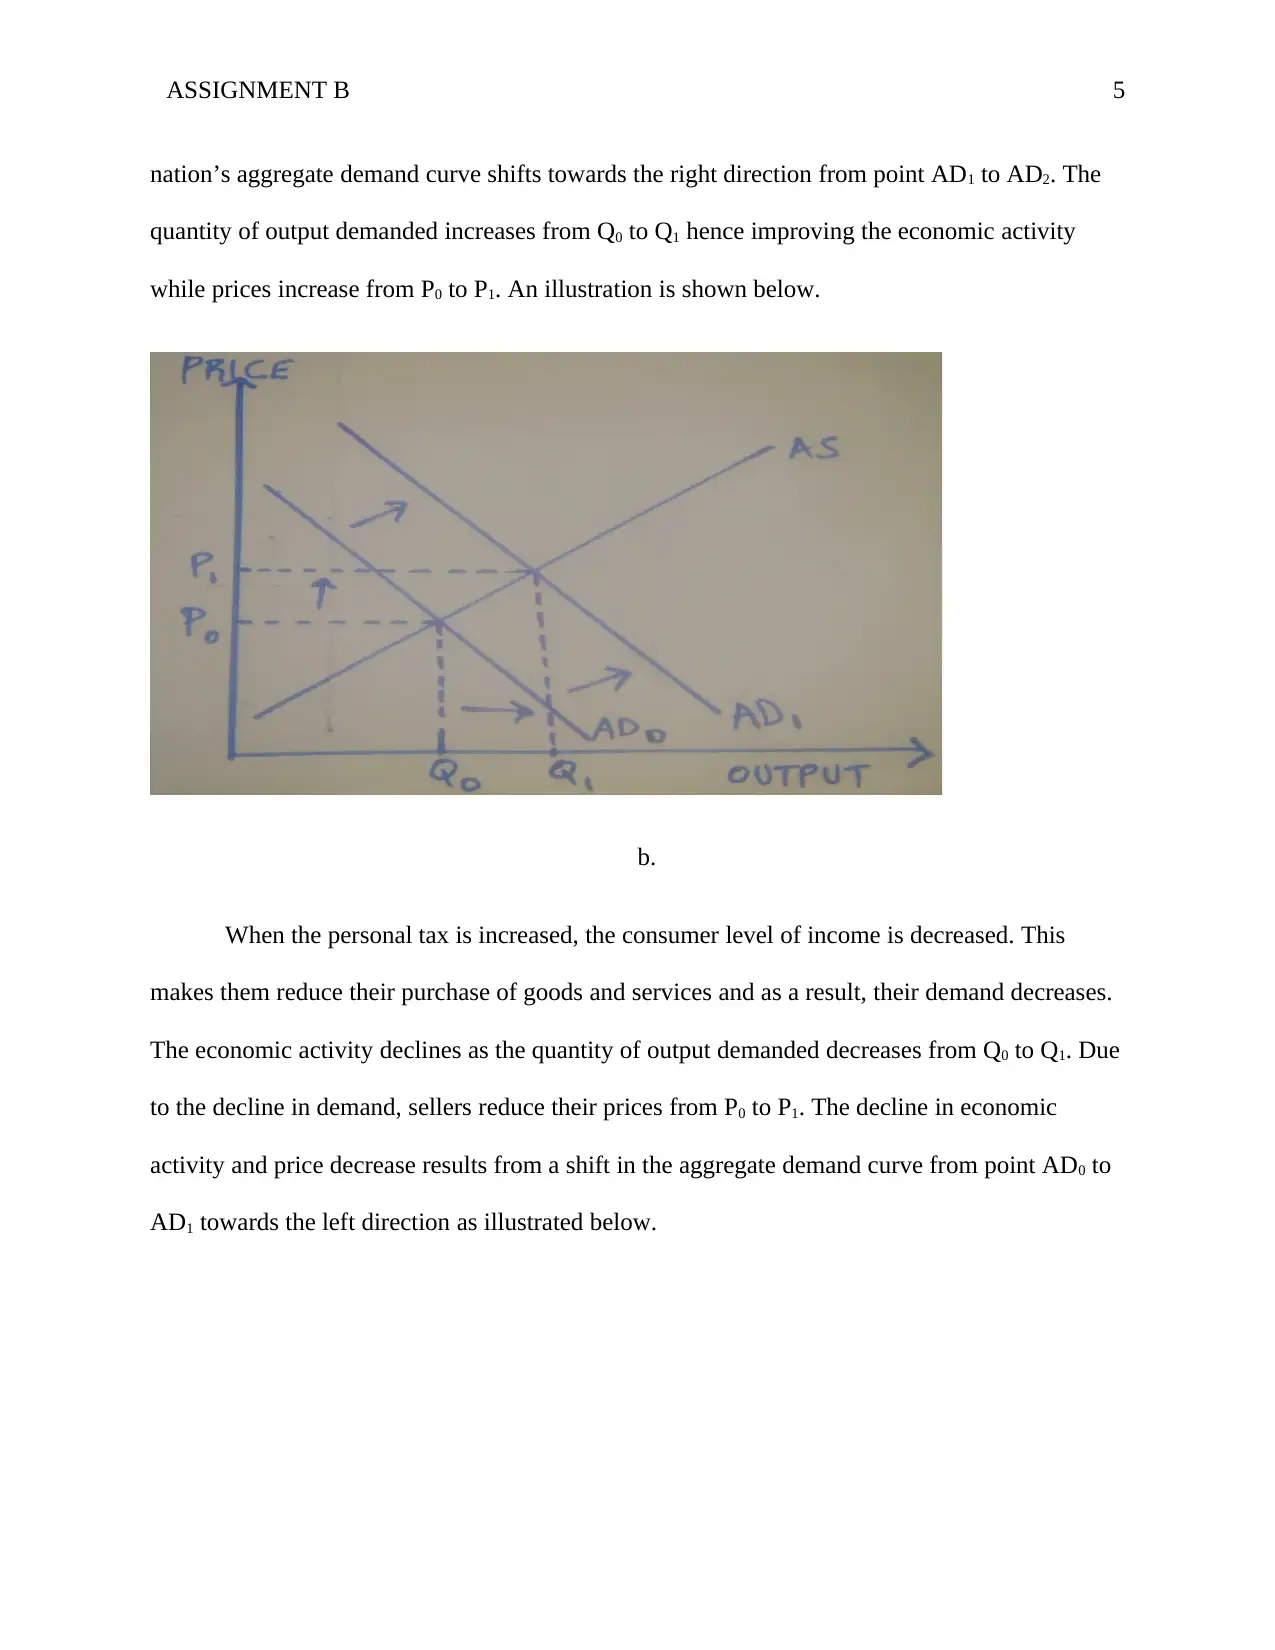
When the personal tax is increased, the consumer level of income is decreased. This
makes them reduce their purchase of goods and services and as a result, their demand decreases.
The economic activity declines as the quantity of output demanded decreases from Q0 to Q1. Due
to the decline in demand, sellers reduce their prices from P0 to P1. The decline in economic
activity and price decrease results from a shift in the aggregate demand curve from point AD0 to
AD1 towards the left direction as illustrated below.
nation’s aggregate demand curve shifts towards the right direction from point AD1 to AD2. The
quantity of output demanded increases from Q0 to Q1 hence improving the economic activity
while prices increase from P0 to P1. An illustration is shown below.
b.
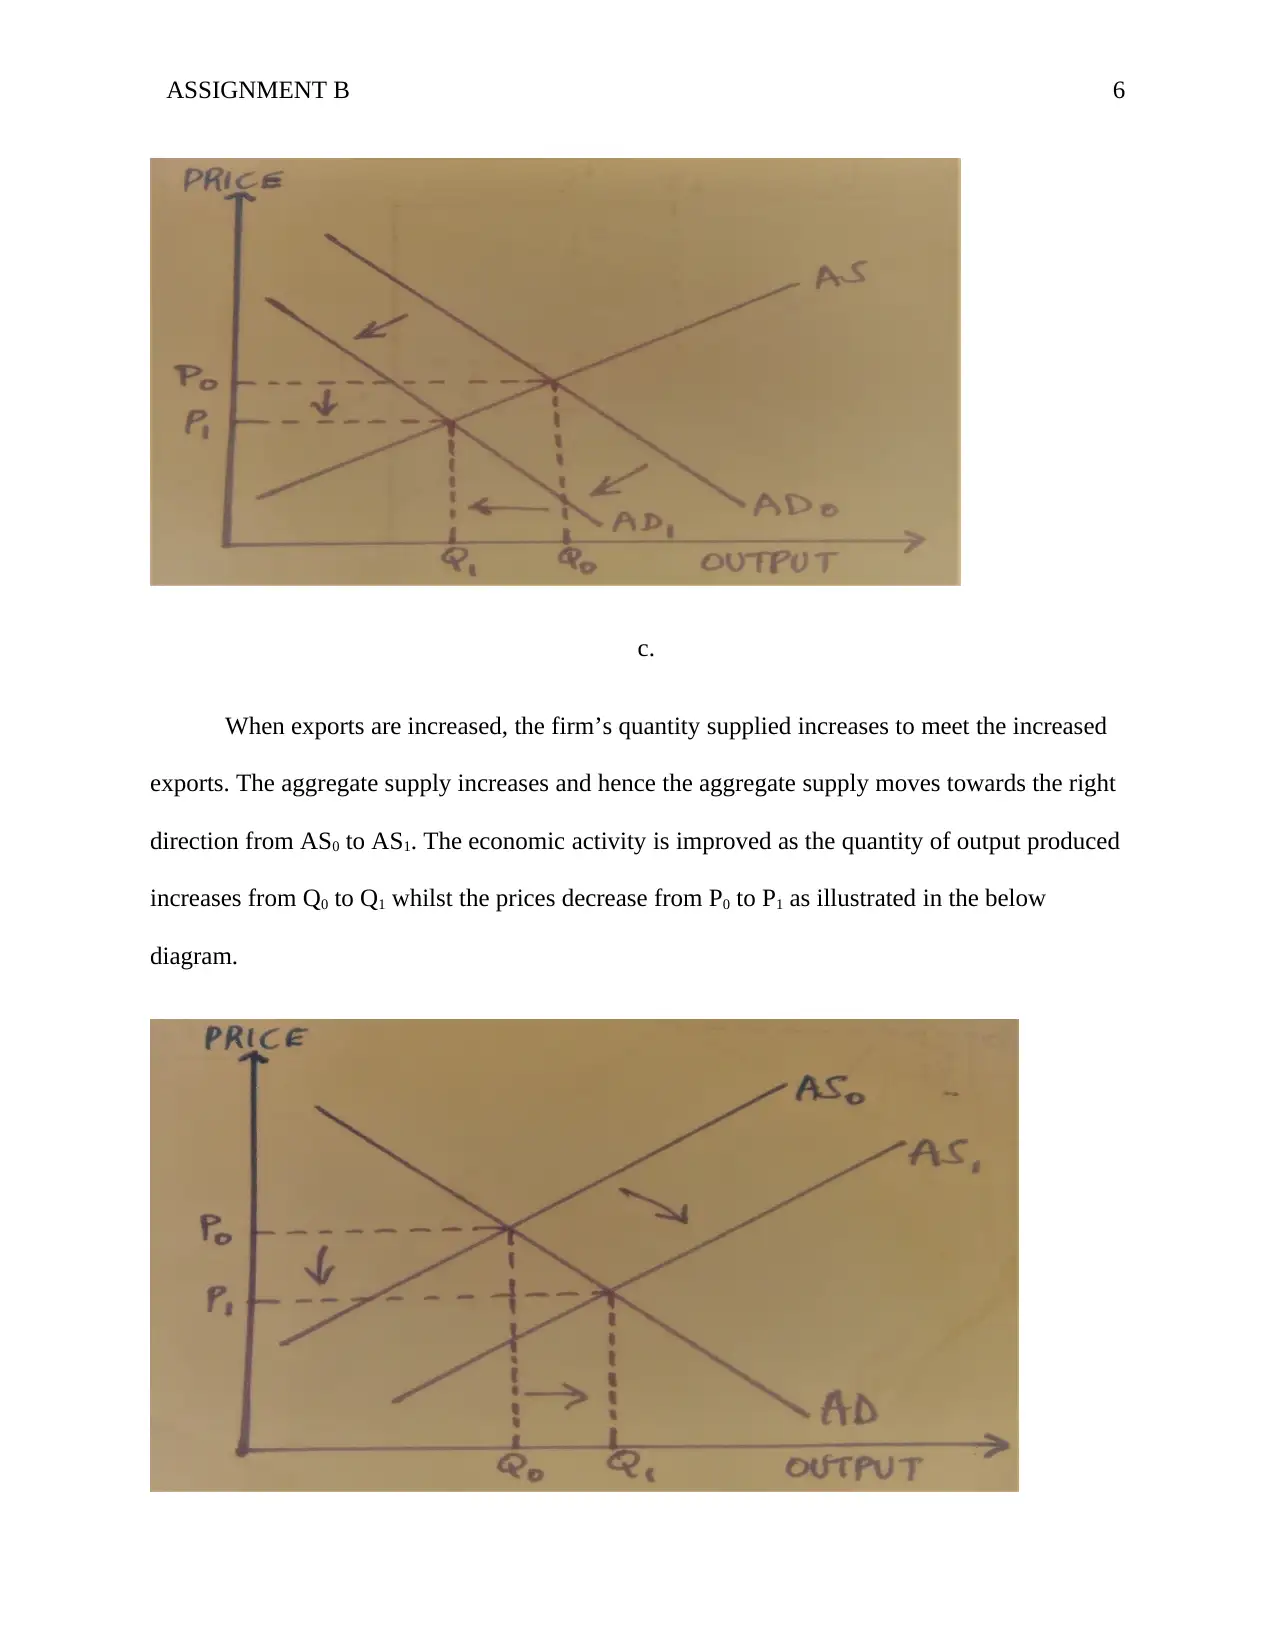
When the personal tax is increased, the consumer level of income is decreased. This
makes them reduce their purchase of goods and services and as a result, their demand decreases.
The economic activity declines as the quantity of output demanded decreases from Q0 to Q1. Due
to the decline in demand, sellers reduce their prices from P0 to P1. The decline in economic
activity and price decrease results from a shift in the aggregate demand curve from point AD0 to
AD1 towards the left direction as illustrated below.
ASSIGNMENT B 6
c.
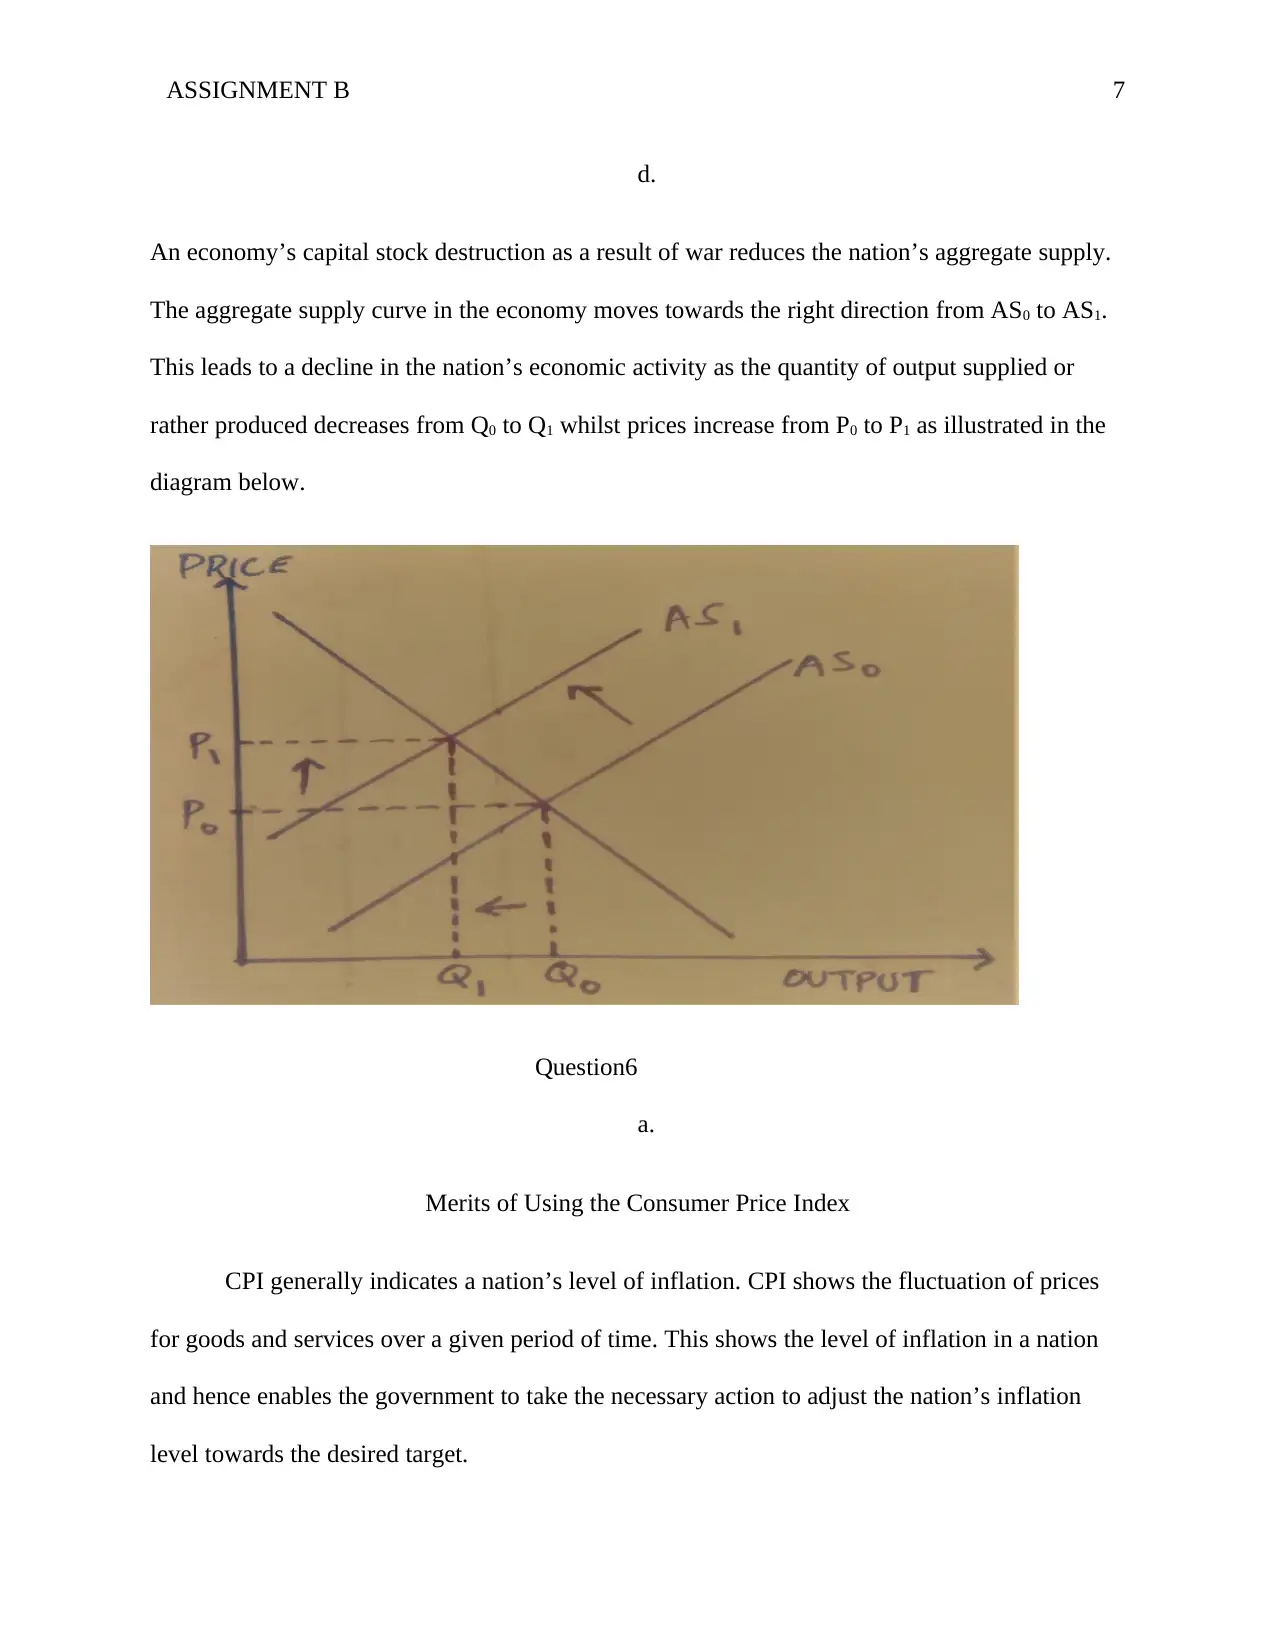
When exports are increased, the firm’s quantity supplied increases to meet the increased
exports. The aggregate supply increases and hence the aggregate supply moves towards the right
direction from AS0 to AS1. The economic activity is improved as the quantity of output produced
increases from Q0 to Q1 whilst the prices decrease from P0 to P1 as illustrated in the below
diagram.
c.
When exports are increased, the firm’s quantity supplied increases to meet the increased
exports. The aggregate supply increases and hence the aggregate supply moves towards the right
direction from AS0 to AS1. The economic activity is improved as the quantity of output produced
increases from Q0 to Q1 whilst the prices decrease from P0 to P1 as illustrated in the below
diagram.
⊘ This is a preview!⊘
Do you want full access?
Subscribe today to unlock all pages.
Trusted by 1+ million students worldwide
ASSIGNMENT B 7
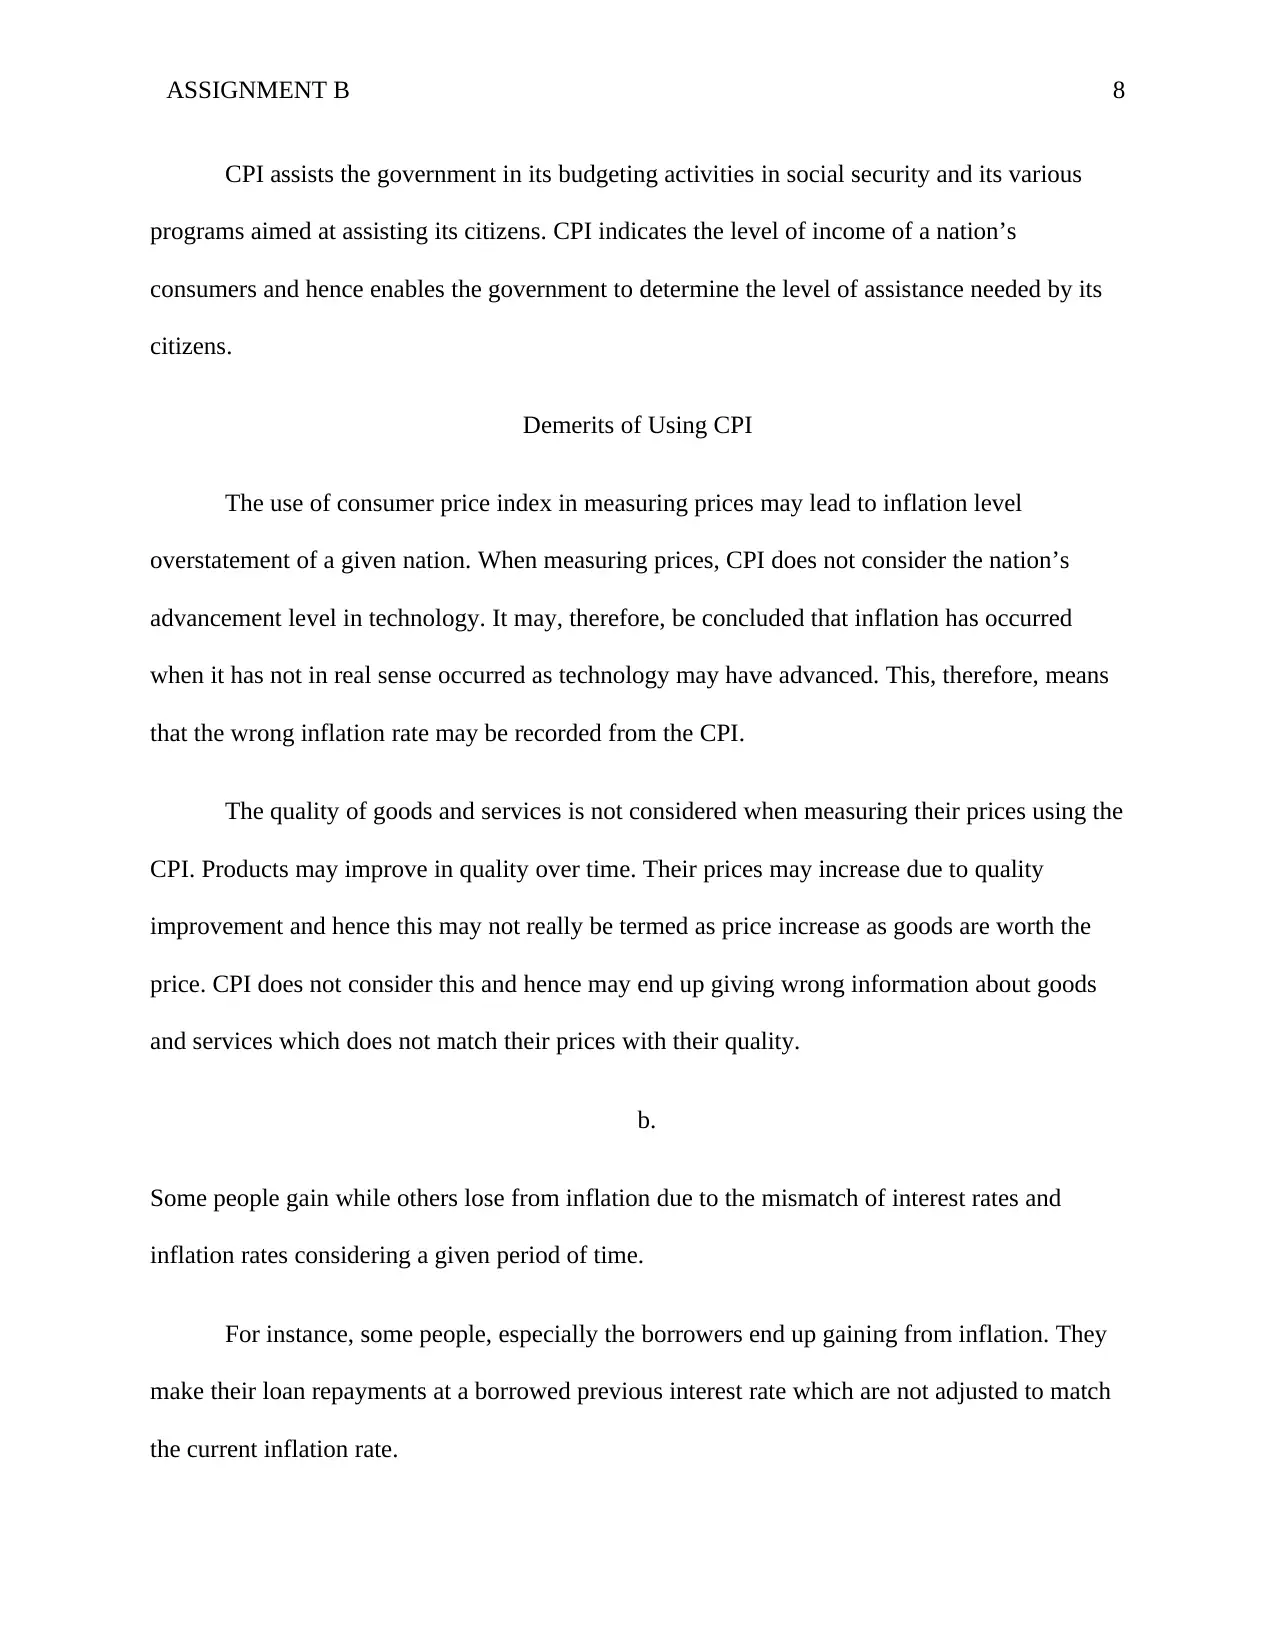
d.
An economy’s capital stock destruction as a result of war reduces the nation’s aggregate supply.
The aggregate supply curve in the economy moves towards the right direction from AS0 to AS1.
This leads to a decline in the nation’s economic activity as the quantity of output supplied or
rather produced decreases from Q0 to Q1 whilst prices increase from P0 to P1 as illustrated in the
diagram below.
Question6
a.
Merits of Using the Consumer Price Index
CPI generally indicates a nation’s level of inflation. CPI shows the fluctuation of prices
for goods and services over a given period of time. This shows the level of inflation in a nation
and hence enables the government to take the necessary action to adjust the nation’s inflation
level towards the desired target.
Paraphrase This Document
Need a fresh take? Get an instant paraphrase of this document with our AI Paraphraser
ASSIGNMENT B 8
CPI assists the government in its budgeting activities in social security and its various
programs aimed at assisting its citizens. CPI indicates the level of income of a nation’s
consumers and hence enables the government to determine the level of assistance needed by its
citizens.
Demerits of Using CPI
The use of consumer price index in measuring prices may lead to inflation level
overstatement of a given nation. When measuring prices, CPI does not consider the nation’s
advancement level in technology. It may, therefore, be concluded that inflation has occurred
when it has not in real sense occurred as technology may have advanced. This, therefore, means
that the wrong inflation rate may be recorded from the CPI.
The quality of goods and services is not considered when measuring their prices using the
CPI. Products may improve in quality over time. Their prices may increase due to quality
improvement and hence this may not really be termed as price increase as goods are worth the
price. CPI does not consider this and hence may end up giving wrong information about goods
and services which does not match their prices with their quality.
b.
Some people gain while others lose from inflation due to the mismatch of interest rates and
inflation rates considering a given period of time.
For instance, some people, especially the borrowers end up gaining from inflation. They
make their loan repayments at a borrowed previous interest rate which are not adjusted to match
the current inflation rate.
ASSIGNMENT B 9
On the other hand some people especially those who earn fixed income like pensioners
and lenders lose from inflation. Fixed income earners continue earning previous fixed income
which does not match the current inflation. Lenders receive their lend money at a lower initial
previous interest rate which does not match the current inflation rate.
Question7
a. No. when government securities are sold to banks, banks are left with little cash for
lending. This reduces the money supply in the economy.
b. Yes. When interest rates fall, businesses and individuals borrow more money for
investment and daily use as capital borrowing costs become less. This increases the
money supply in the economy.
c. Yes. An increase in government expenditure increases the money supply in the economy
as it finances projects aimed at improving economic growth.
d. Yes. When the central bank purchases government securities from the banking sector,
banks have more money for lending. They lend more cash to businesses and individuals
and hence increase the money supply in the economy.
e. No. the reduction of the targeted inflation rate is achieved by increasing interest rates.
This discourages borrowing as capital borrowing costs increase and hence reduce money
supply in the economy.
Question8
a. Imports of goods. Import of DVD recorders from Japan into the nation is the import of
goods.
b. Capital transfers to the nation from overseas. Purchase of insurance covers by overseas
residents is grouped under this category.
⊘ This is a preview!⊘
Do you want full access?
Subscribe today to unlock all pages.
Trusted by 1+ million students worldwide
ASSIGNMENT B 10
c. Capital transfers sent overseas from the nation. When a developing nation is given aid,
then this is put under this category.
d. Investment in the nation from overseas. A factory set up in the nation by a US car
company is under this category.
e. Short-term financial outflows. A holiday by residents in Bali is under this category.
f. Other income inflows. When residents earn interest on assets overseas, then this is
classified under this category.
g. Drawing on reserves. Foreign exchange run down in the nation’s central bank is put
under this category.
h. Short-term financial inflows. Property transfer by migrants into the nation is put under
this category as this activity is only for a short period.
i. Adding to reserves. When overseas residents make deposits into nation banks, this is put
under this category as it adds to the nation’s bank reserves.
j. Exports of goods. The selling of palm oil of the nation in the UK is classified under this
category.
Paraphrase This Document
Need a fresh take? Get an instant paraphrase of this document with our AI Paraphraser
ASSIGNMENT B 11
References
Ascari, G., & Sbordone, A. M. (2014). The macroeconomics of trend inflation. Journal of
Economic Literature, 52(3), 679-739.
Totonchi, J. (2011). Macroeconomic theories of inflation. In International Conference on
Economics and Finance Research (págs. 459-462). Singapore: IACSIT Press.
References
Ascari, G., & Sbordone, A. M. (2014). The macroeconomics of trend inflation. Journal of
Economic Literature, 52(3), 679-739.
Totonchi, J. (2011). Macroeconomic theories of inflation. In International Conference on
Economics and Finance Research (págs. 459-462). Singapore: IACSIT Press.
1 out of 11
Related Documents


Your All-in-One AI-Powered Toolkit for Academic Success.
+13062052269
info@desklib.com
Available 24*7 on WhatsApp / Email
![[object Object]](/_next/static/media/star-bottom.7253800d.svg)
Unlock your academic potential
© 2024 | Zucol Services PVT LTD | All rights reserved.