Corporate Financial Management Analysis 2022
Complete valuation and recommendation report for a chosen firm.
22 Pages5335 Words22 Views
Added on 2022-10-01
Corporate Financial Management Analysis 2022
Complete valuation and recommendation report for a chosen firm.
Added on 2022-10-01
ShareRelated Documents
Running Head: CORPORATE FINANCIAL MANAGEMENT
1
CORPORATE FINANCIAL MANAGEMENT
1
CORPORATE FINANCIAL MANAGEMENT
Running Head: CORPORATE FINANCIAL MANAGEMENT
Contents
Part A........................................................................................................................... 3
Introduction.................................................................................................................... 3
Corporate governance....................................................................................................... 4
Financial performance....................................................................................................... 4
Dividend Policy............................................................................................................... 7
Risk Profile.................................................................................................................... 8
Optimal Capital Structure of Rio Tinto.................................................................................. 9
DCF Model.................................................................................................................. 11
Part B......................................................................................................................... 13
NPV........................................................................................................................ 14
IRR......................................................................................................................... 15
Payback Period.......................................................................................................... 16
Profitability Index....................................................................................................... 17
Conclusion................................................................................................................... 18
References................................................................................................................... 20
Running Head: CORPORATE FINANCIAL MANAGEMENT
Part A
Introduction
Corporate finance is an area of finance that deals with the sources of funding, capital structure,
the action that manager take to increase the value of the organization. It is required to use the
financial tool to allocate the financial resources appropriately (Fracassi, 2016). It is essential to
analyze the financial position of the company to allocate the resources in an appropriate manner.
There are different terms and policy developed in the form of standard just to manage the
financial statements of the company accurately such as income statements, profit and loss and
balance sheet. The items are recorded under the different heads as per the standards and policy so
that the financial performance of the company is easily evaluated (Dang, Li, and Yang, 2018).
However, the analysis or forecasting the financial position of the company it is necessary to
evaluate the financial ratios and the other calculations (Tricker, and Tricker, 2015). In this
report, the discussion is based on the financial analysis of the company. In this paper, Rio Tinto
has been taken into consideration to evaluate the financial performance as per the standards.
Rio Tinto is an Australian multinational company which operates the business in metals and
mining. It was founded in the year 1873 while purchasing the mine complex. The company is
growing with the method of mergers and acquisitions. It operates in six components such as
Australia and Canada (Rio Tinto, 2018a).
The report is classified in two parts such as task 1 and task 2. In task 1, the different terms and
policy of financial statements will be discussed. In task 2, investment appraisal techniques will
be discussed with the evaluation.
Running Head: CORPORATE FINANCIAL MANAGEMENT
Corporate governance
Corporate governance is the grouping of processes, rules or laws by which organization are
functions are operated, controlled and regulated (McCahery, Sautner, and Starks, 2016). In the
case of Rio Tinto, the board of directors develops laws, rules to control or operates the functions
of the business. It has been seen that the directors of the company are collectively responsible for
the long term success of the group. Board of Directors of the company is classified in three
positions such as chairman, executive and non-executive. The chairman of the company is Simon
Thompson, Chief executive is Jean Sesbastien Jacques, Chief Financial Officer is Jackob
Stausholm, and non-executive director is Megan Clark AC.
There are also other committee’s such as Audit committee, chairman committee, sustainability
committee, remuneration committee (Rio Tinto, 2018b). Different committee manages the
different activities of the company such as executive committee responsible for delivering of
strategy, annual plans and commercial objectives. The role of board of directors of the company
is to develop the laws and rules to operate the business effectively. The rules and regulation are
introduced by the directors as per the financial performance of the company just to control the
functions (Tricker, and Tricker, 2015).
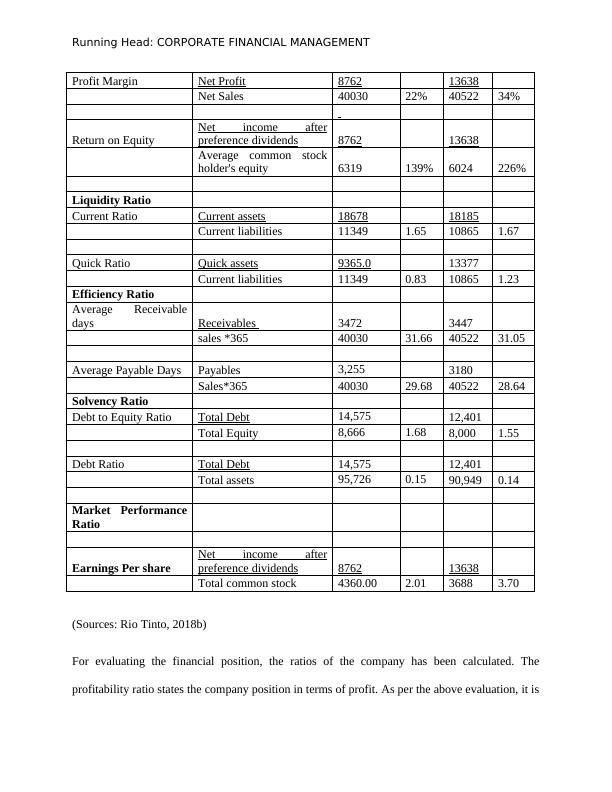
Financial performance
Financial Ratio
Analysis
Rio Tinto
2017 2018
Profitability Ratio
Gross Profit Margin Gross Profit 24223 23963
Net Sales 40030 61% 40522 59%
Corporate governance
Corporate governance is the grouping of processes, rules or laws by which organization are
functions are operated, controlled and regulated (McCahery, Sautner, and Starks, 2016). In the
case of Rio Tinto, the board of directors develops laws, rules to control or operates the functions
of the business. It has been seen that the directors of the company are collectively responsible for
the long term success of the group. Board of Directors of the company is classified in three
positions such as chairman, executive and non-executive. The chairman of the company is Simon
Thompson, Chief executive is Jean Sesbastien Jacques, Chief Financial Officer is Jackob
Stausholm, and non-executive director is Megan Clark AC.
There are also other committee’s such as Audit committee, chairman committee, sustainability
committee, remuneration committee (Rio Tinto, 2018b). Different committee manages the
different activities of the company such as executive committee responsible for delivering of
strategy, annual plans and commercial objectives. The role of board of directors of the company
is to develop the laws and rules to operate the business effectively. The rules and regulation are
introduced by the directors as per the financial performance of the company just to control the
functions (Tricker, and Tricker, 2015).
Financial performance
Financial Ratio
Analysis
Rio Tinto
2017 2018
Profitability Ratio
Gross Profit Margin Gross Profit 24223 23963
Net Sales 40030 61% 40522 59%
Running Head: CORPORATE FINANCIAL MANAGEMENT
Profit Margin Net Profit 8762 13638
Net Sales 40030 22% 40522 34%
Return on Equity
Net income after
preference dividends 8762 13638
Average common stock
holder's equity 6319 139% 6024 226%
Liquidity Ratio
Current Ratio Current assets 18678 18185
Current liabilities 11349 1.65 10865 1.67
Quick Ratio Quick assets 9365.0 13377
Current liabilities 11349 0.83 10865 1.23
Efficiency Ratio
Average Receivable
days Receivables 3472 3447
sales *365 40030 31.66 40522 31.05
Average Payable Days Payables 3,255 3180
Sales*365 40030 29.68 40522 28.64
Solvency Ratio
Debt to Equity Ratio Total Debt 14,575 12,401
Total Equity 8,666 1.68 8,000 1.55
Debt Ratio Total Debt 14,575 12,401
Total assets 95,726 0.15 90,949 0.14
Market Performance
Ratio
Earnings Per share
Net income after
preference dividends 8762 13638
Total common stock 4360.00 2.01 3688 3.70
(Sources: Rio Tinto, 2018b)
For evaluating the financial position, the ratios of the company has been calculated. The
profitability ratio states the company position in terms of profit. As per the above evaluation, it is
Running Head: CORPORATE FINANCIAL MANAGEMENT
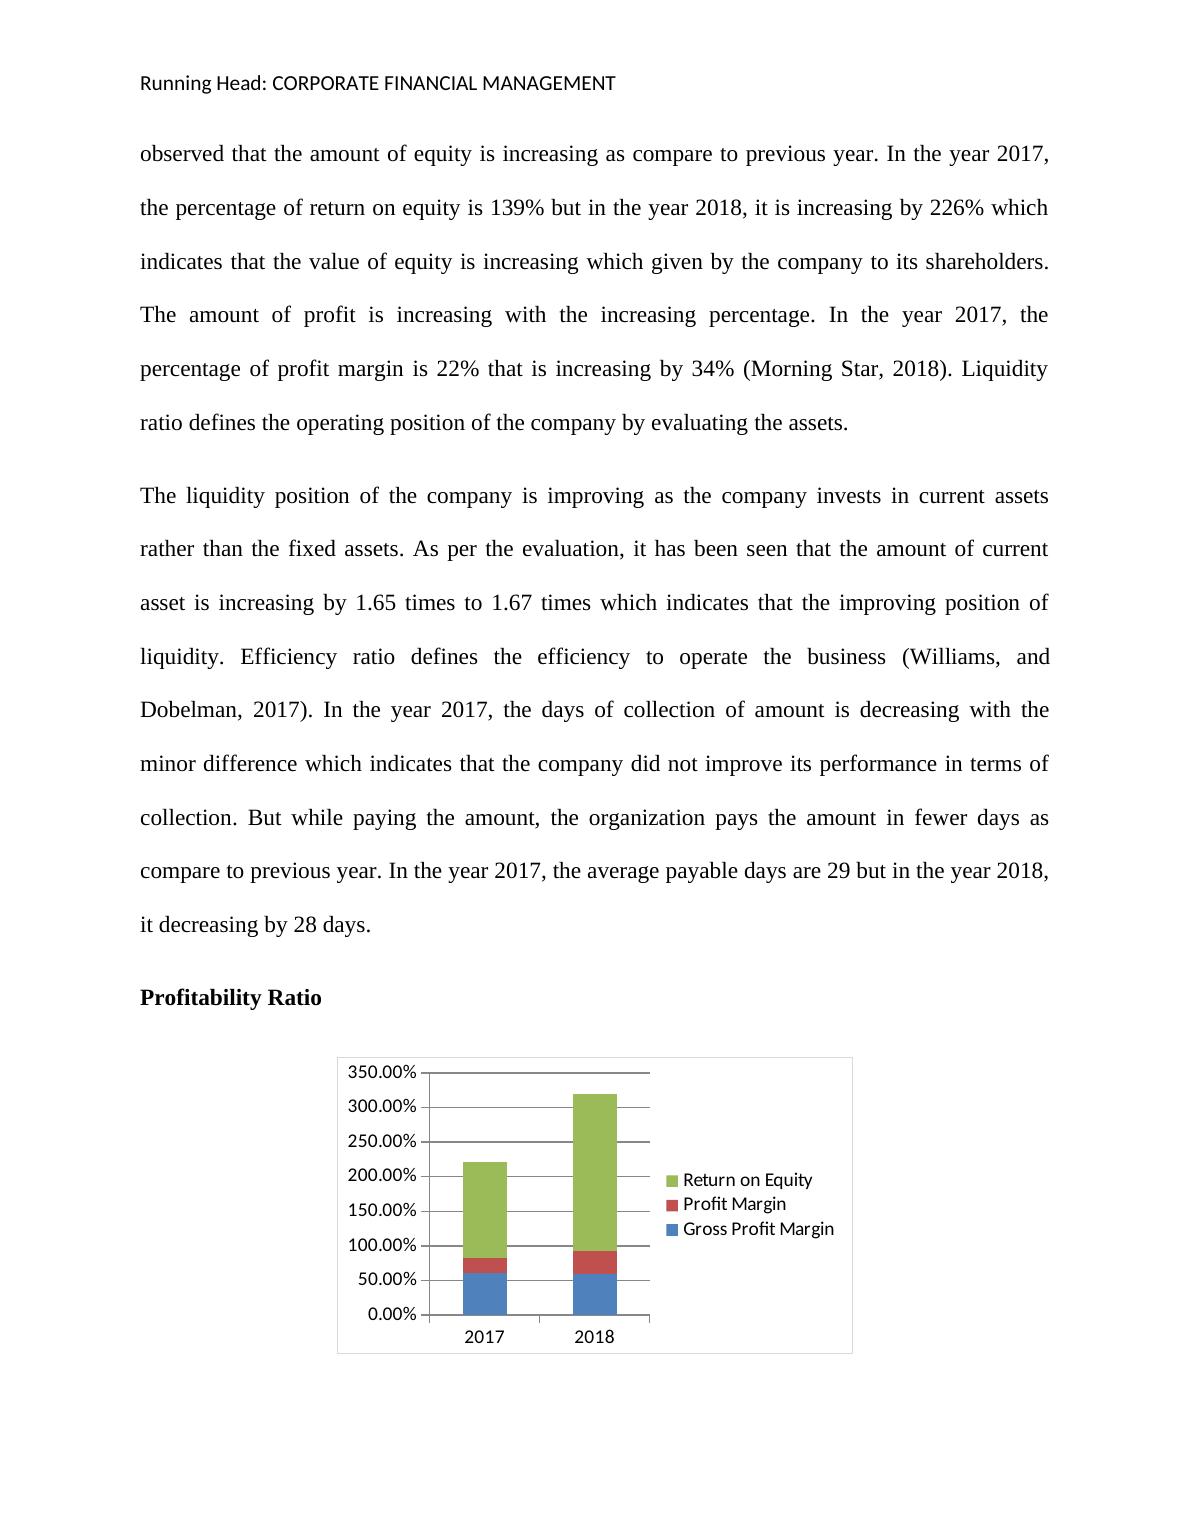
observed that the amount of equity is increasing as compare to previous year. In the year 2017,
the percentage of return on equity is 139% but in the year 2018, it is increasing by 226% which
indicates that the value of equity is increasing which given by the company to its shareholders.
The amount of profit is increasing with the increasing percentage. In the year 2017, the
percentage of profit margin is 22% that is increasing by 34% (Morning Star, 2018). Liquidity
ratio defines the operating position of the company by evaluating the assets.
The liquidity position of the company is improving as the company invests in current assets
rather than the fixed assets. As per the evaluation, it has been seen that the amount of current
asset is increasing by 1.65 times to 1.67 times which indicates that the improving position of
liquidity. Efficiency ratio defines the efficiency to operate the business (Williams, and
Dobelman, 2017). In the year 2017, the days of collection of amount is decreasing with the
minor difference which indicates that the company did not improve its performance in terms of
collection. But while paying the amount, the organization pays the amount in fewer days as
compare to previous year. In the year 2017, the average payable days are 29 but in the year 2018,
it decreasing by 28 days.
Profitability Ratio
2017 2018
0.00%
50.00%
100.00%
150.00%
200.00%
250.00%
300.00%
350.00%
Return on
Equity
Profit Margin
Gross Profit
Margin
End of preview
Want to access all the pages? Upload your documents or become a member.
Related Documents
Report Management Accounting 2022lg...
|11
|2960
|7
Corporate Accounting and Corporate Social Responsibility: A Case Study of Rio Tintolg...
|14
|2820
|306
Corporate Social Responsibility and Ethics - Report on Rio Tintolg...
|15
|2909
|258
Accounting Theory and Corporate Governancelg...
|12
|2255
|56
Aspects of Corporate Governance- Reportlg...
|14
|2852
|40
Corporate governance: Principles, policies, and practiceslg...
|12
|2481
|20