Business Intelligence And Data Warehousing Design and Compilation
Added on 2020-04-07
23 Pages4672 Words479 Views
Running head: ITECH7406- Business Intelligence And Data WarehousingITECH7406- Business Intelligence and Data WarehousingName of the StudentName of the UniversityAuthor NoteExecutive summary
1 ITECH7406- BUSINESS INTELLIGENCE AND DATA WAREHOUSINGThis report deals with designing and compilation for the better understanding of thebusiness intelligence process along with the working procedure of the datawarehousing. The following report has been strategically assembled with the help ofan environmental related to the renewable fresh water resources data set. The dataset has been used for the descriptive and predictive analysis of the data collected.The report includes a justification on why the dashboards has been included in thereport. For the conclusion of the report, there is an inclusion of a recommendation forthe CEO of an organization, which can be followed. The recommendation can befollowed by the organization to improve their profit margin change the objectives oftheir business procedure to make the organization better in the competition of themarket.
2 ITECH7406- BUSINESS INTELLIGENCE AND DATA WAREHOUSINGTable of ContentsIntroduction........................................................................................................3Description of the data set used for the analysis...............................................3Descriptive analysis...........................................................................................5Predictive analysis.............................................................................................9Justification of dashboard usage.....................................................................14Recommendation to the CEO..........................................................................16Conclusion.......................................................................................................17References.......................................................................................................18Bibliography.....................................................................................................20
3 ITECH7406- BUSINESS INTELLIGENCE AND DATA WAREHOUSINGIntroductionBusiness intelligence can be termed as the use of different applicationsoftware’s and infrastructures. This is used for the analysis of information and datafor the use in the improvement procedure of the decision making of an organizationfor the direct improvement of the performance. For the compilation of this report, asoftware by the name of SAP Lumira has been used. The software has been usedfor the benefit of the effect of changing the structure of the data that is being used forthe analysis. The correlation between the data can also be visualized and analyzedfor the benefit of the organization and decision making procedures. The report hasbeen compiled with the help of the environmental related issues of the world (Shollo& Galliers, 2016) (Arnott, Lizama & Song, 2017). The following report has beenstrategically assembled with the help of an environmental related to the renewablefresh water resources data set. The data set has been used for the descriptive andpredictive analysis of the data collected. The report includes a justification on whythe dashboards has been included in the report. There is a further description of thediscussion based on the descriptive analysis of the data set, which has beencompiled on a data analysis software, future prediction of data set that has beenused for the analysis and a justification for the creation of the dashboard. There isalso a brief recommendation to the CEO of an organization based on the dataanalysis compiled in the report (Basole, 2014).Description of the data set used for the analysisThe data set that has been used for the analysis of the repost is based on theconcept of freshwater resources in the world. The factors which are being talliedagainst are Fresh water availability, Fresh water consumption, Fresh water wastage,
4 ITECH7406- BUSINESS INTELLIGENCE AND DATA WAREHOUSINGFresh water recharge and Polluted fresh water. These factors have been selected fora period of 5 years ranging from 2011 to 2015. The data has been collected fromvarious locations, which include:1.Argentina2.Australia3.Brazil4.Canada5.China6.France7.Germany8.India9.Indonesia10.Italy11.Japan12.Korea, Dem. Rep.13.Mexico14.Russia15.Saudi Arabia16.South Africa17.Turkey18.United Kingdom19.United StatesThe original data set, which had been, acquired form the online sources werelarge and would make the analysis complicated. To produce a simple yet detailedanalysis of the data the data was reduced to the data set that has been chosen. The
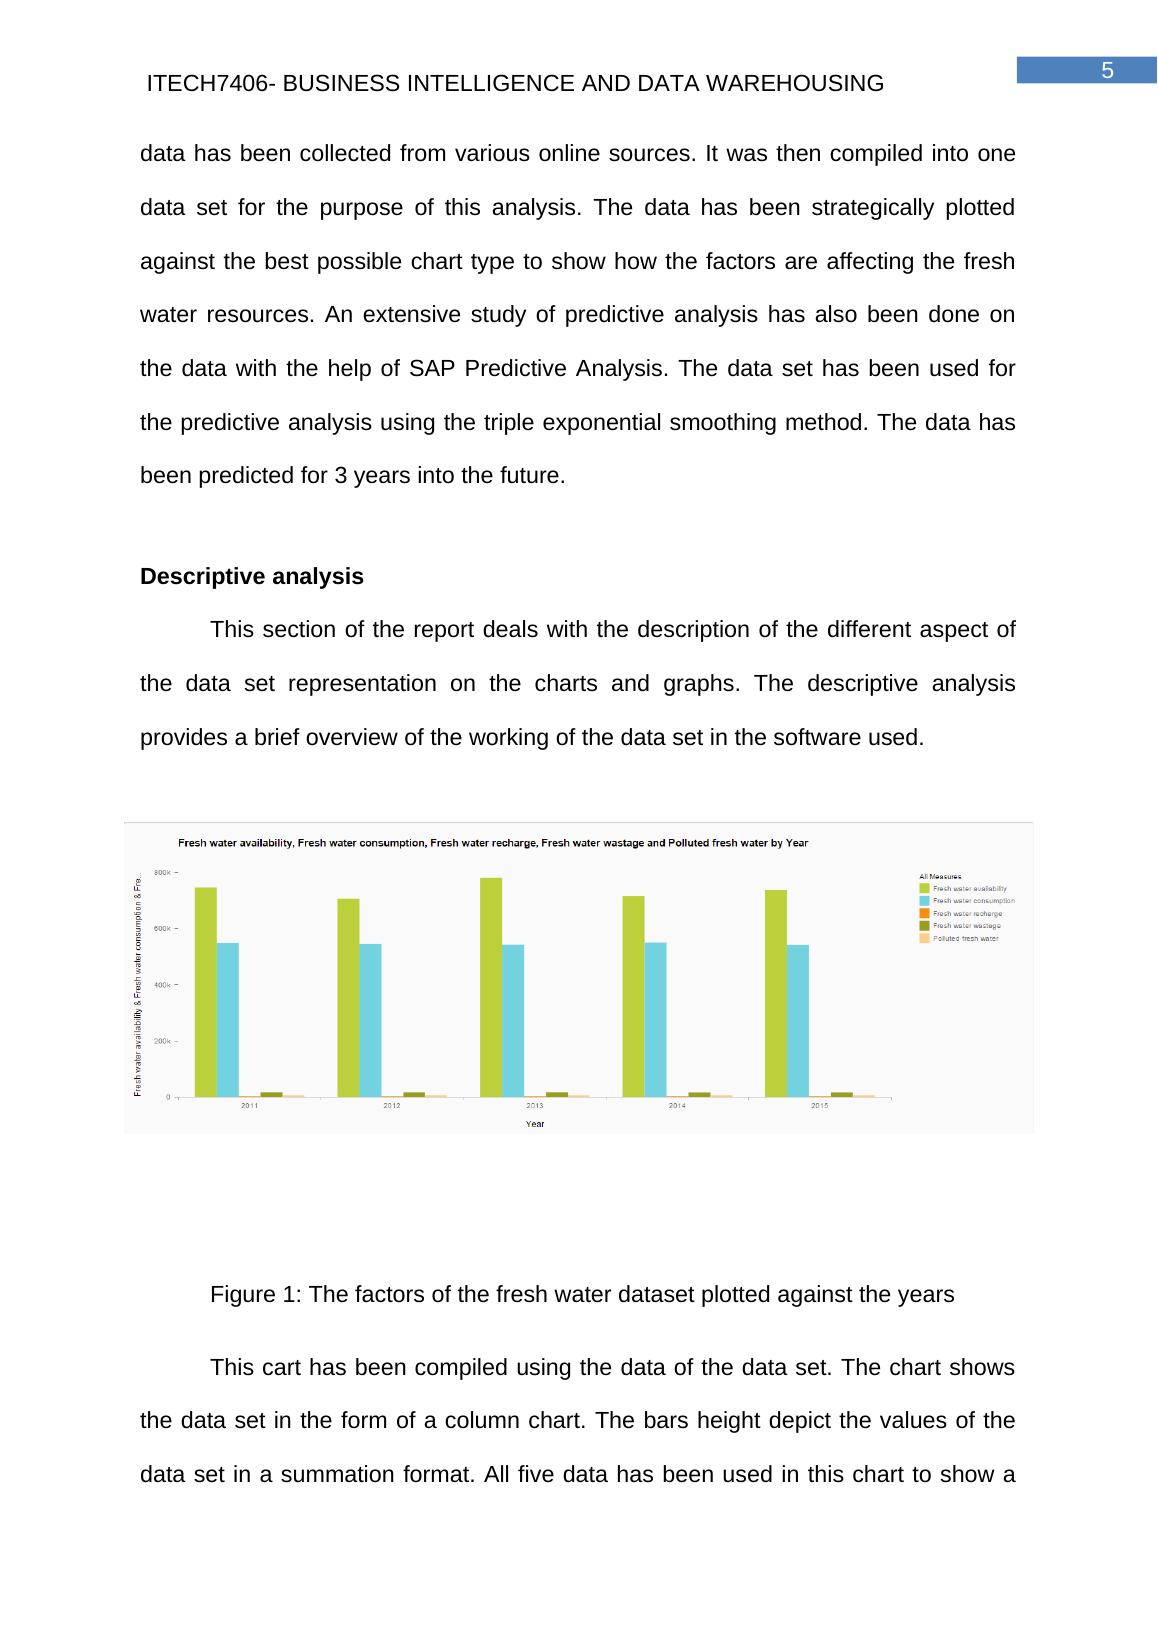
5 ITECH7406- BUSINESS INTELLIGENCE AND DATA WAREHOUSINGdata has been collected from various online sources. It was then compiled into onedata set for the purpose of this analysis. The data has been strategically plottedagainst the best possible chart type to show how the factors are affecting the freshwater resources. An extensive study of predictive analysis has also been done onthe data with the help of SAP Predictive Analysis. The data set has been used forthe predictive analysis using the triple exponential smoothing method. The data hasbeen predicted for 3 years into the future. Descriptive analysisThis section of the report deals with the description of the different aspect ofthe data set representation on the charts and graphs. The descriptive analysisprovides a brief overview of the working of the data set in the software used. Figure 1: The factors of the fresh water dataset plotted against the yearsThis cart has been compiled using the data of the data set. The chart showsthe data set in the form of a column chart. The bars height depict the values of thedata set in a summation format. All five data has been used in this chart to show a
End of preview
Want to access all the pages? Upload your documents or become a member.
Related Documents
ITECH7406- Business Intelligence and Data Warehousinglg...
|27
|4746
|204
ITECH7406 Business Intelligence and Data Warehousinglg...
|26
|4697
|33
MIS781 Business Intelligence Reportlg...
|21
|5240
|75
Business Intelligence Reporting Solution or Dashboard?lg...
|25
|3799
|155
University *** Semester.lg...
|25
|4138
|90
ITECH7407 Real Time Analytics | Business Intelligencelg...
|17
|3956
|168