Business Statistics Report: Employee Education Impact on Absenteeism
VerifiedAdded on 2022/09/22
|6
|1046
|23
Report
AI Summary
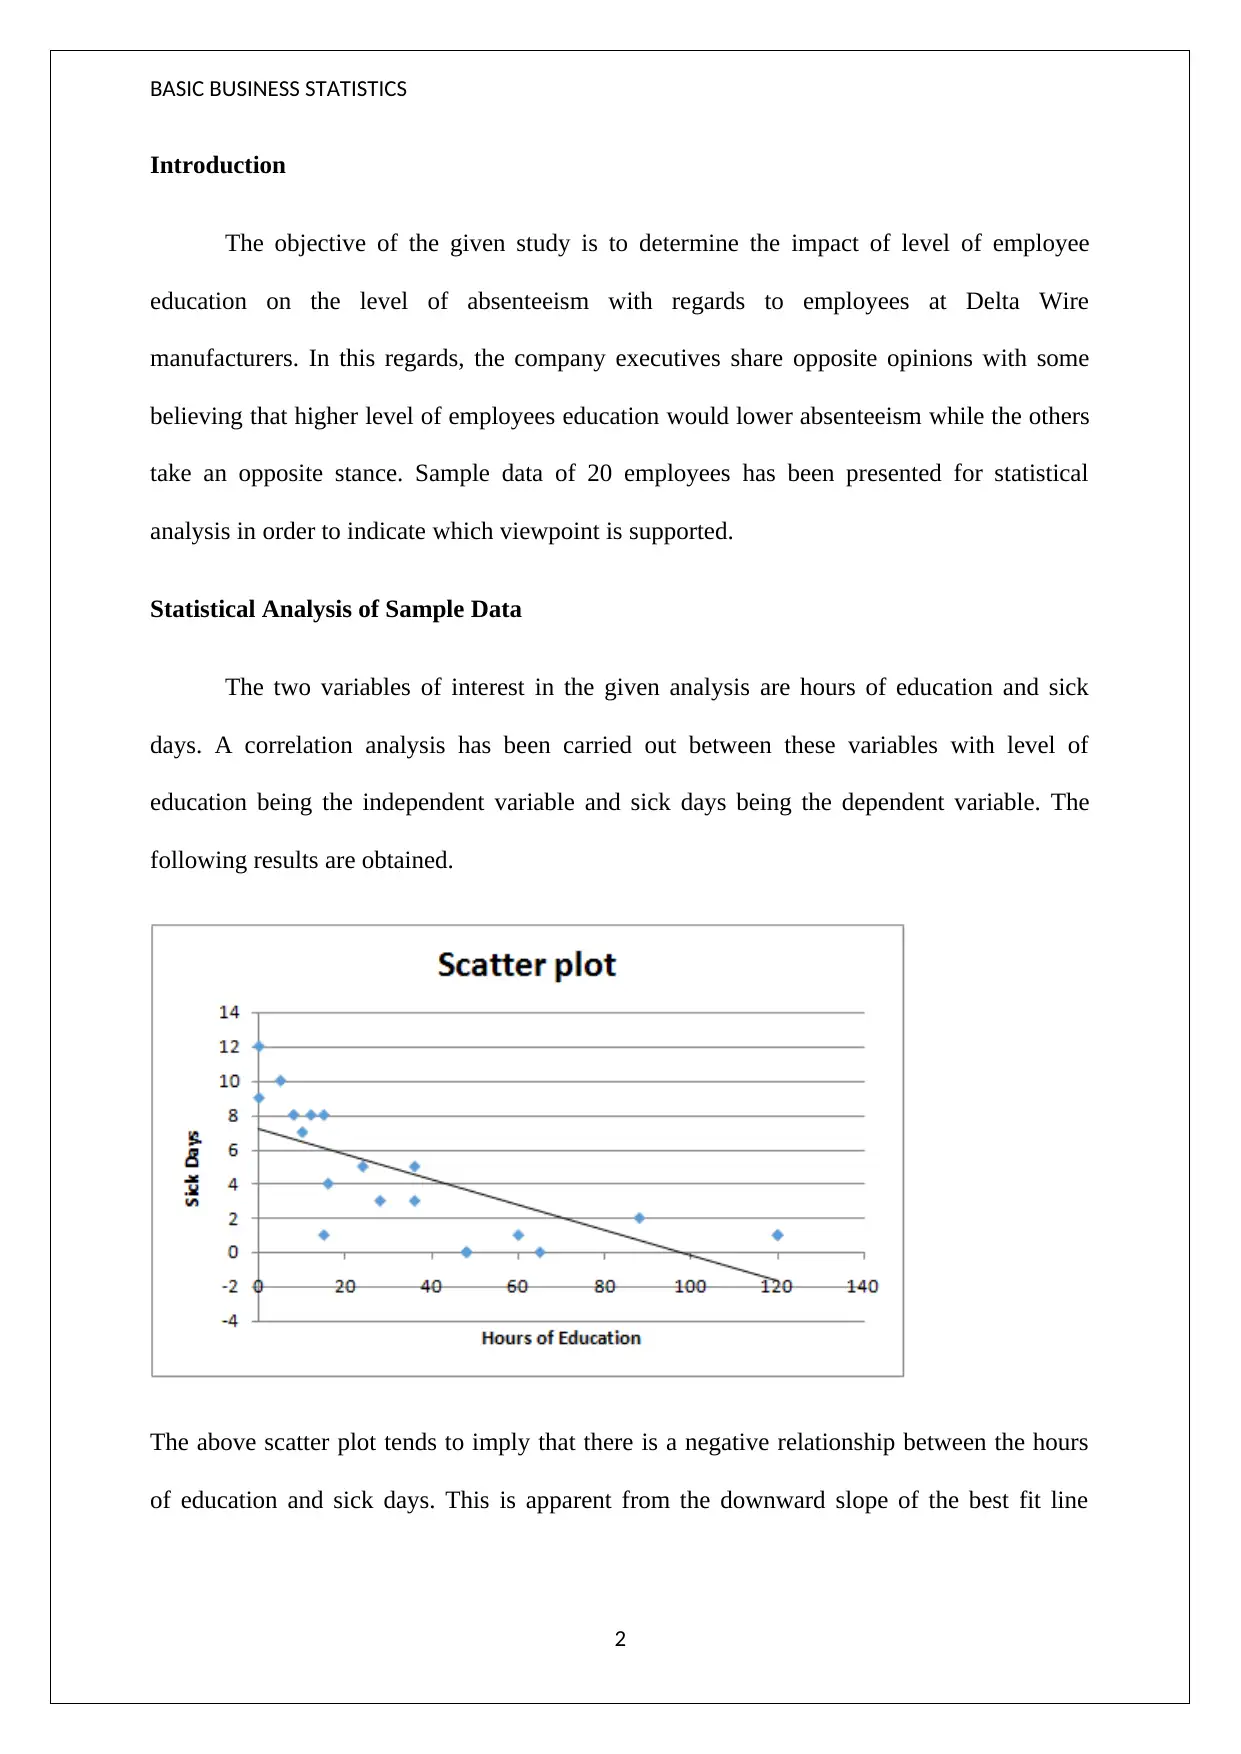
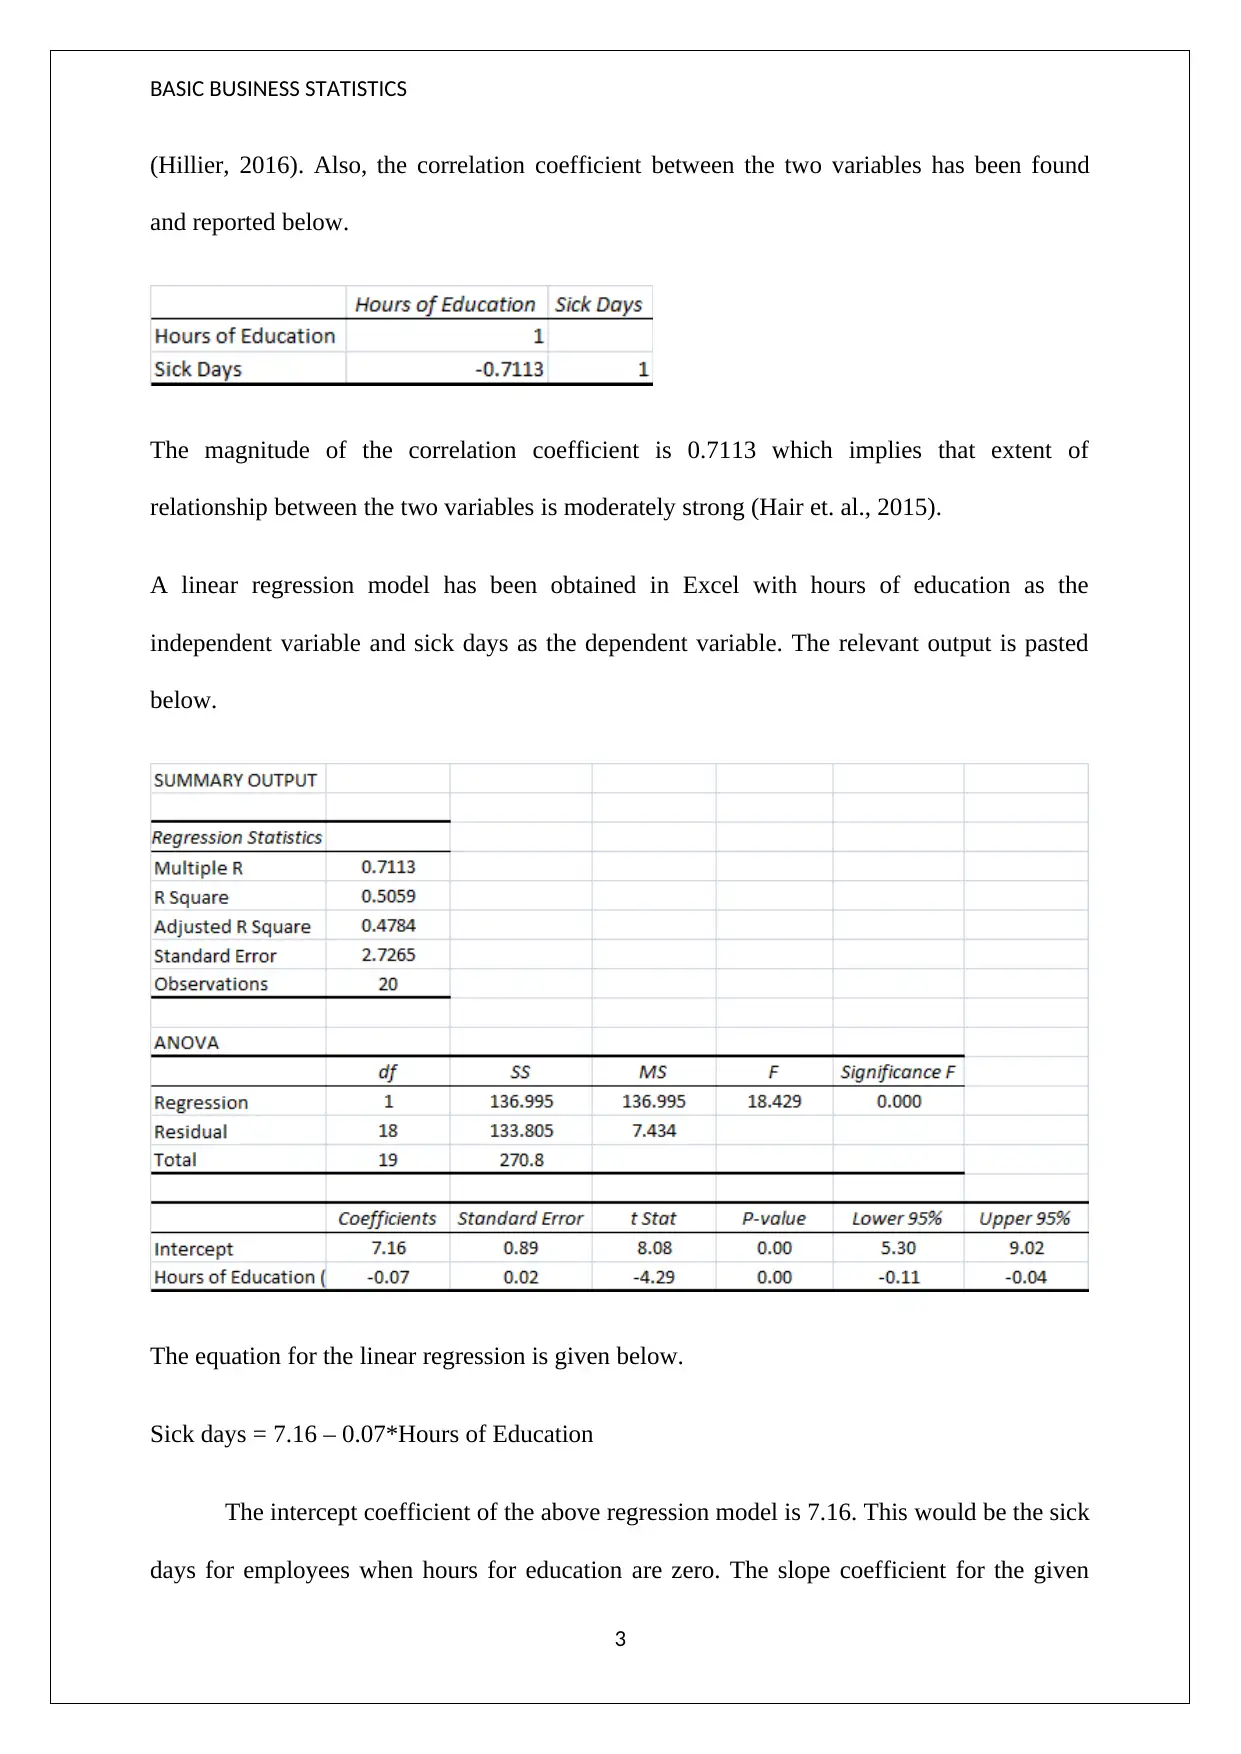
This report presents a statistical analysis of the relationship between employee education and absenteeism at Delta Wire. The study utilizes a sample of 20 employees to determine if there is a correlation between the number of hours of education received and the number of sick days taken. The analysis includes correlation analysis, scatter plots, and linear regression models to assess the strength and direction of the relationship. The results indicate a negative correlation, suggesting that higher levels of employee education are associated with lower absenteeism rates. However, the report also acknowledges the limitations of the study, such as the small sample size, and recommends further research with a larger, more representative sample to validate the findings and provide more reliable insights for management decisions regarding employee education investments. The report concludes with a discussion of the results, shortcomings, and recommendations based on the statistical analysis.

BASIC BUSINESS STATISTICS
STUDENT ID:
[Pick the date]
STUDENT ID:
[Pick the date]
Paraphrase This Document
Need a fresh take? Get an instant paraphrase of this document with our AI Paraphraser

BASIC BUSINESS STATISTICS
Introduction
The objective of the given study is to determine the impact of level of employee
education on the level of absenteeism with regards to employees at Delta Wire
manufacturers. In this regards, the company executives share opposite opinions with some
believing that higher level of employees education would lower absenteeism while the others
take an opposite stance. Sample data of 20 employees has been presented for statistical
analysis in order to indicate which viewpoint is supported.
Statistical Analysis of Sample Data
The two variables of interest in the given analysis are hours of education and sick
days. A correlation analysis has been carried out between these variables with level of
education being the independent variable and sick days being the dependent variable. The
following results are obtained.
The above scatter plot tends to imply that there is a negative relationship between the hours
of education and sick days. This is apparent from the downward slope of the best fit line
2

BASIC BUSINESS STATISTICS
(Hillier, 2016). Also, the correlation coefficient between the two variables has been found
and reported below.
The magnitude of the correlation coefficient is 0.7113 which implies that extent of
relationship between the two variables is moderately strong (Hair et. al., 2015).
A linear regression model has been obtained in Excel with hours of education as the
independent variable and sick days as the dependent variable. The relevant output is pasted
below.
The equation for the linear regression is given below.
Sick days = 7.16 – 0.07*Hours of Education
The intercept coefficient of the above regression model is 7.16. This would be the sick
days for employees when hours for education are zero. The slope coefficient for the given
3
⊘ This is a preview!⊘
Do you want full access?
Subscribe today to unlock all pages.

Trusted by 1+ million students worldwide

BASIC BUSINESS STATISTICS
regression model is -0.07 which implies that a unit change in the hours of education would
lead to a change of 0.07 in the sick days. Since the slope coefficient is negative, hence the
direction of change in both variables would be opposite. Also, the p value of the slope is zero
which implies that the slope is statistically significant (Eriksson & Kovalainen, 2015).
The R2 value is 0.5059. This implies that 50.59% of the variation in the sick days is
accounted for by the corresponding changes in the hours of education. As a result, there is
requirement of other relevant independent variables to be added to the regression model in
order to improve the predictive capability. Further, ANOVA analysis indicates that the
regression model on the whole is significant. Thus, the given regression model presents a
good fit despite low prediction capability (Flick, 2015).
Interpretation and Discussion of Results
In context of the given business problem, the above results indicate that higher hours
of employee education would lower the incidence of absenteeism. Also, it can be estimated
that for every one hour incrementally spent on employee education, the sick days is expected
to come down by 0.07. Additionally, it has been established that hours of education does have
a significant impact on the sick days of employees. Hence, this seems to be supportive of the
viewpoint that employee education potentially leads to a positive outlook and higher
motivation thereby resulting in lower incidence of absenteeism. However, it is noteworthy
that levels of absenteeism for an employee are dependent on certain other factors besides the
hours of education.
Shortcomings with study
The key shortcoming of the given study is that the sample selected for the study may
not be representative of the population of employee working at the company. This is because
4
Paraphrase This Document
Need a fresh take? Get an instant paraphrase of this document with our AI Paraphraser

BASIC BUSINESS STATISTICS
out of a population of interest of 20,000 employee, only a sample size of 20 employees has
been taken. This is 0.01% of the population size and is clearly insufficient. Also, the nature of
the population is such that it would be heterogenous owing to a host of employee specific
factors particularly demographics. Thus, in order to capture the given population of 20,000
employees faithfully and accurately, a larger sample size should have been chosen. Owing to
the unrepresentative sample used for this study, the results may not be reliable (Hastie,
Tibshirani & Friedman, 2016).
Recommendation
Based on the statistical analysis and the interpretation of the results obtained, there
seems to be lower absenteeism if more time is spent on employee education. As a result, it
makes sense for the company to continue with its existing practice of investing significantly
in employee education as it potentially leads to productivity gains. However, in wake of the
sample not being representative of all employees, it is recommended that a new study is
performed where the sample size is large enough and chosen as per the appropriate random
sampling technique so that it is representative of the underlying population. Based on the
results of that new study, the management should take a decision with regards to investing in
employee education.
5

BASIC BUSINESS STATISTICS
References
Eriksson, P. & Kovalainen, A. (2015). Quantitative methods in business research (3rded.).
London: Sage Publications.
Flick, U. (2015). Introducing research methodology: A beginner's guide to doing a research
project (4thed.). New York: Sage Publications.
Hair, J. F., Wolfinbarger, M., Money, A. H., Samouel, P., & Page, M. J. (2015). Essentials of
business research methods (2nded.). New York: Routledge.
Hastie, T., Tibshirani, R. & Friedman, J. (2016). The Elements of Statistical Learning
(4thed.). New York: Springer Publications.
Hillier, F. (2016).Introduction to Operations Research.(6thed.). New York: McGraw Hill
Publications
6
⊘ This is a preview!⊘
Do you want full access?
Subscribe today to unlock all pages.

Trusted by 1+ million students worldwide
1 out of 6
Related Documents

Your All-in-One AI-Powered Toolkit for Academic Success.
+13062052269
info@desklib.com
Available 24*7 on WhatsApp / Email
Unlock your academic potential
Copyright © 2020–2025 A2Z Services. All Rights Reserved. Developed and managed by ZUCOL.