Assignment : Business Economics
Added on 2020-11-23
28 Pages3728 Words291 Views
Business Economics

Table of ContentsINTRODUCTION...........................................................................................................................1(1)Data on key macroeconomic indicators of Australia and USA from 1995 to 2015................1(2)Summary of change in Australia's and USA macroeconomic factors.................................113.pair wise graphs of Australia and USA from 1995 to 2015....................................................14P4.paulisable economic explanation including Govt. policies..................................................19P4(b): short prediction macroeconomic outlook of Australia......................................................2CONCLUSION................................................................................................................................4
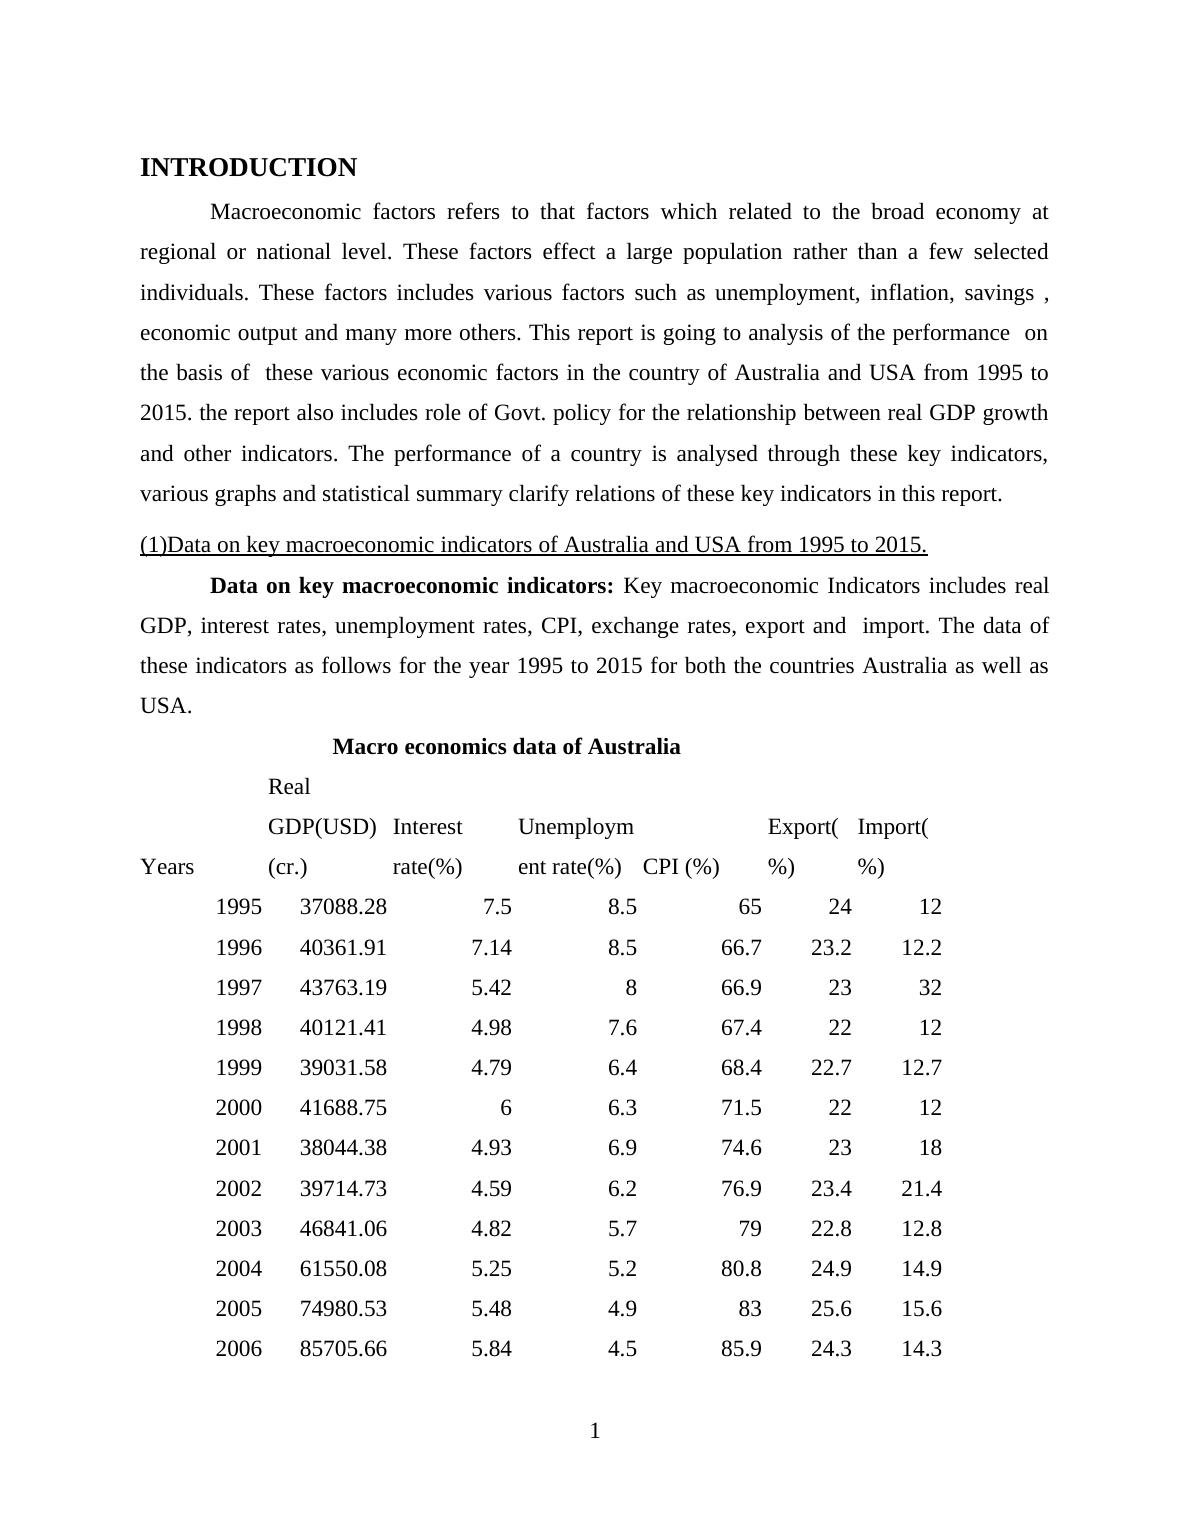
INTRODUCTIONMacroeconomic factors refers to that factors which related to the broad economy atregional or national level. These factors effect a large population rather than a few selectedindividuals. These factors includes various factors such as unemployment, inflation, savings ,economic output and many more others. This report is going to analysis of the performance onthe basis of these various economic factors in the country of Australia and USA from 1995 to2015. the report also includes role of Govt. policy for the relationship between real GDP growthand other indicators. The performance of a country is analysed through these key indicators,various graphs and statistical summary clarify relations of these key indicators in this report. (1)Data on key macroeconomic indicators of Australia and USA from 1995 to 2015.Data on key macroeconomic indicators: Key macroeconomic Indicators includes realGDP, interest rates, unemployment rates, CPI, exchange rates, export and import. The data ofthese indicators as follows for the year 1995 to 2015 for both the countries Australia as well asUSA. Macro economics data of AustraliaYears Real GDP(USD)(cr.)Interest rate(%)Unemployment rate(%)CPI (%)Export(%)Import(%)199537088.287.58.5652412199640361.917.148.566.723.212.2199743763.195.42866.92332199840121.414.987.667.42212199939031.584.796.468.422.712.7200041688.7566.371.52212200138044.384.936.974.62318200239714.734.596.276.923.421.4200346841.064.825.77922.812.8200461550.085.255.280.824.914.9200574980.535.484.98325.615.6200685705.665.844.585.924.314.320071.66 lakh6.414.487.923.913.9200892644.826.644.591.8221220091.44 lakh3.185.693.421.511.520101.39 lakh4.415.196.120.080.0820111.54 lakh4.685.299.317.87.820121.57 lakh3.645.3101161.61
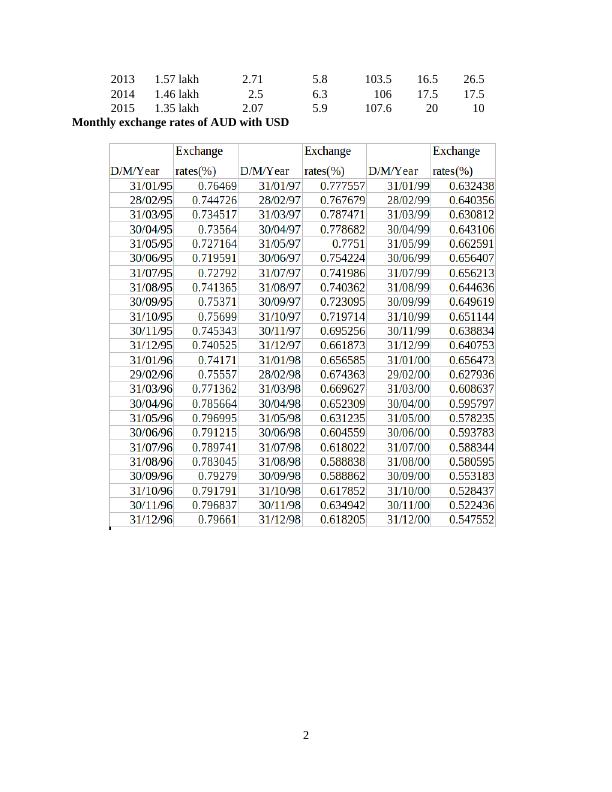
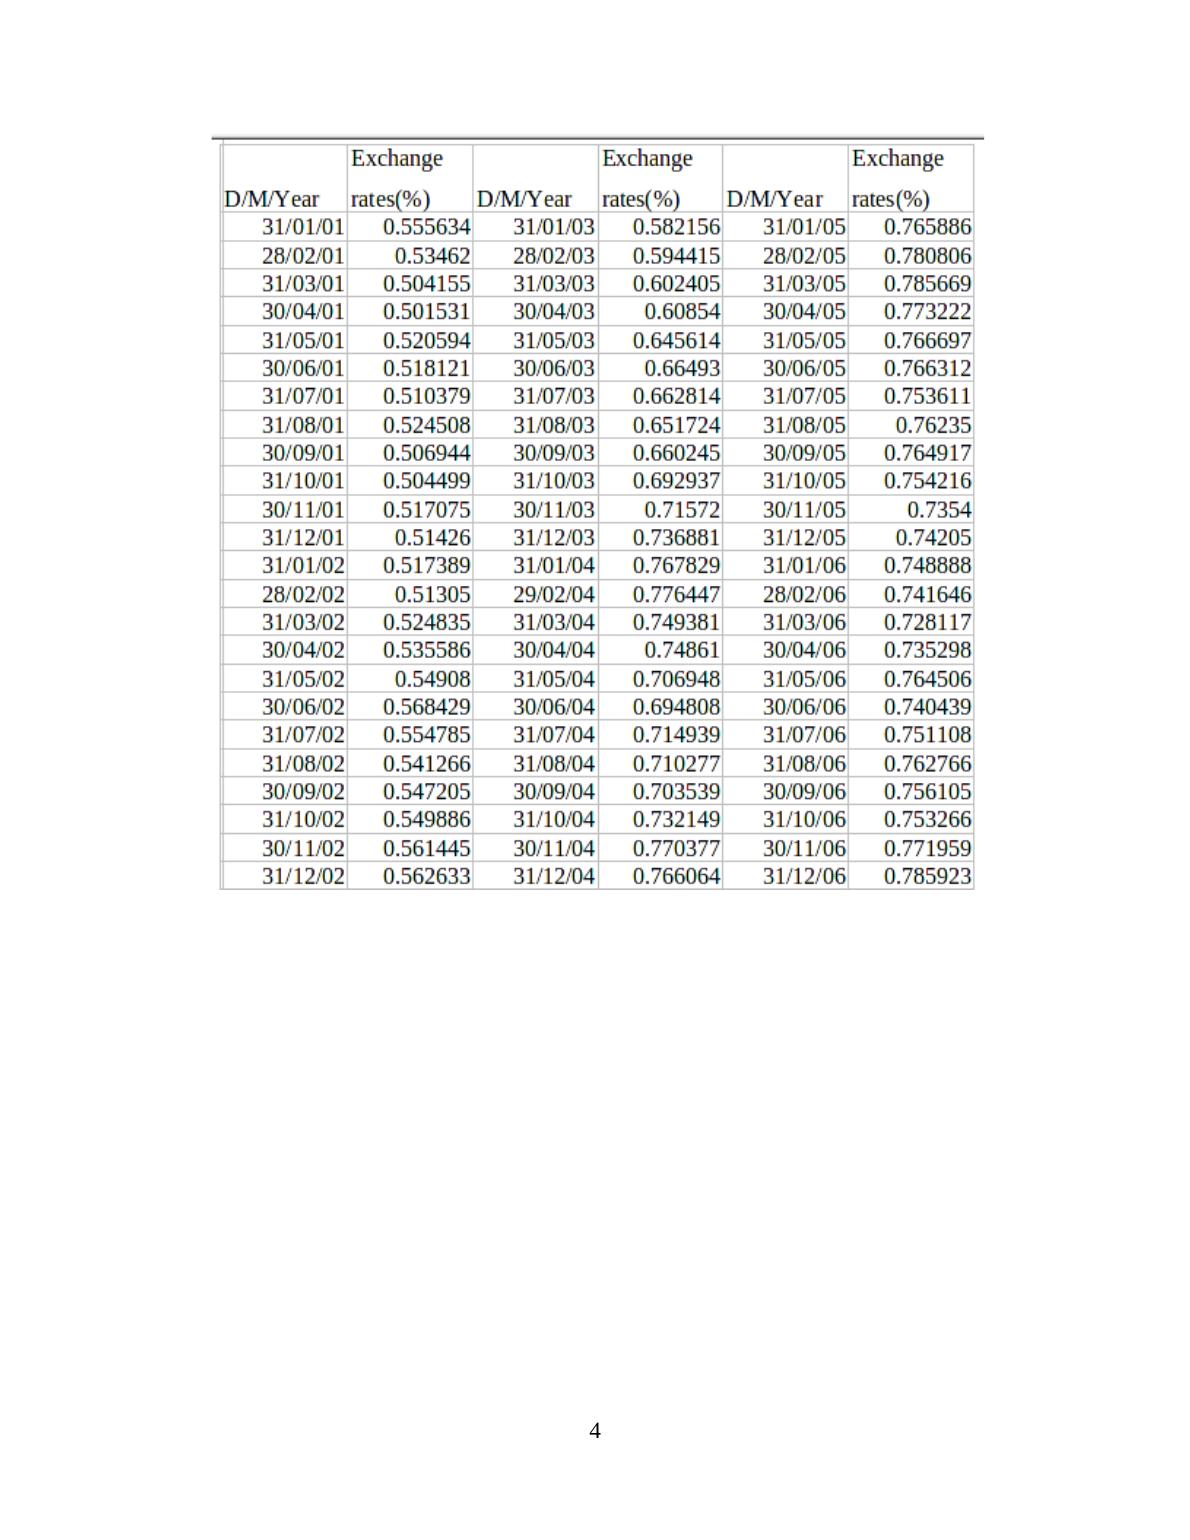
20131.57 lakh2.715.8103.516.526.520141.46 lakh2.56.310617.517.520151.35 lakh2.075.9107.62010Monthly exchange rates of AUD with USD 2
3

4
End of preview
Want to access all the pages? Upload your documents or become a member.