Business Process Intelligence Research Paper 2022
VerifiedAdded on 2022/09/17
|14
|6448
|21
AI Summary
Contribute Materials
Your contribution can guide someone’s learning journey. Share your
documents today.
See discussions, stats, and author profiles for this publication at: https://www.researchgate.net/publication/2899961
Business Process Intelligence
Article · June 2002
Source: CiteSeer
CITATIONS
37
READS
311
4 authors, including:
Mehmet Sayal
HP Inc.
43PUBLICATIONS1,274CITATIONS
SEE PROFILE
All content following this page was uploaded by Mehmet Sayal on 10 April 2014.
The user has requested enhancement of the downloaded file.
Secure Best Marks with AI Grader
Need help grading? Try our AI Grader for instant feedback on your assignments.
Business Process Intelligence
Fabio Casati, Umesh Dayal, Mehmet Sayal, Ming-Chien Shan
Software Technology Laboratory
HP Laboratories Palo Alto
HPL-2002-119
April 25th , 2002*
E-mail: {casati, dayal, sayal, shan}@hpl.hp.com
workflows,
data
warehousing,
business
intelligence
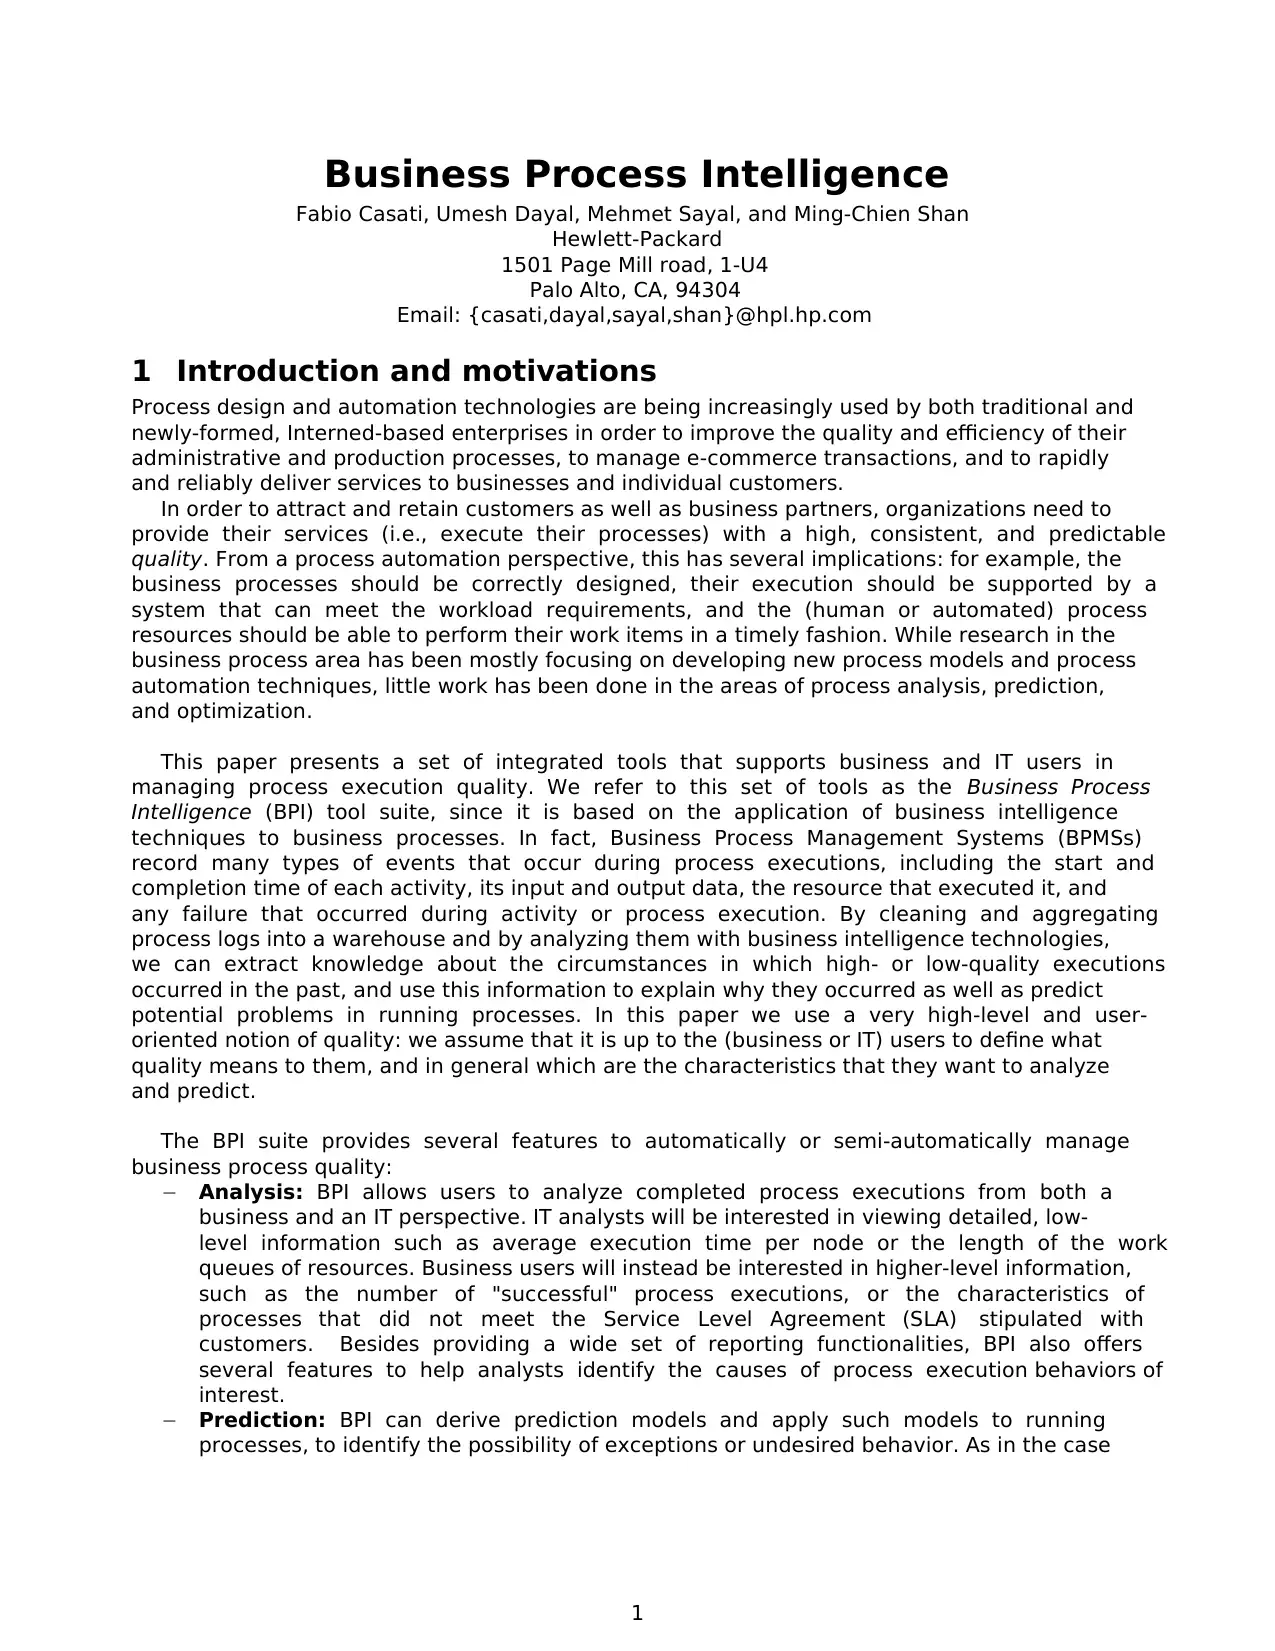
Process design and automation technologies are being increasingly
used by both traditional and newly-formed, Internet-based
enterprises in order to improve the quality and efficiency of their
administrative and production processes, to manage e-commerce
transactions, and to rapidly and reliably deliver services to
businesses and individual customers.
In order to attract and retain customers as well as business partners,
organizations need to provide their services (i.e., execute their
processes) with a high, consistent, and predictable quality. From a
process automation perspective, this has several implications: for
example, the business processes should be correctly designed, their
execution should be supported by a system that can meet the
workload requirements, and the (human or automated) process
resources should be able to perform their work items in a timely
fashion.
This paper presents a set of integrated tools that supports business
and IT users in managing process execution quality. We refer to this
set of tools as the Business Process Intelligence (BPI) tool suite,
since it is based on the application of business intelligence
techniques to business processes.
* Internal Accession Date Only Approved for External Publication
Copyright Hewlett-Packard Company 2002
Fabio Casati, Umesh Dayal, Mehmet Sayal, Ming-Chien Shan
Software Technology Laboratory
HP Laboratories Palo Alto
HPL-2002-119
April 25th , 2002*
E-mail: {casati, dayal, sayal, shan}@hpl.hp.com
workflows,
data
warehousing,
business
intelligence
Process design and automation technologies are being increasingly
used by both traditional and newly-formed, Internet-based
enterprises in order to improve the quality and efficiency of their
administrative and production processes, to manage e-commerce
transactions, and to rapidly and reliably deliver services to
businesses and individual customers.
In order to attract and retain customers as well as business partners,
organizations need to provide their services (i.e., execute their
processes) with a high, consistent, and predictable quality. From a
process automation perspective, this has several implications: for
example, the business processes should be correctly designed, their
execution should be supported by a system that can meet the
workload requirements, and the (human or automated) process
resources should be able to perform their work items in a timely
fashion.
This paper presents a set of integrated tools that supports business
and IT users in managing process execution quality. We refer to this
set of tools as the Business Process Intelligence (BPI) tool suite,
since it is based on the application of business intelligence
techniques to business processes.
* Internal Accession Date Only Approved for External Publication
Copyright Hewlett-Packard Company 2002
1
Business Process Intelligence
Fabio Casati, Umesh Dayal, Mehmet Sayal, and Ming-Chien Shan
Hewlett-Packard
1501 Page Mill road, 1-U4
Palo Alto, CA, 94304
Email: {casati,dayal,sayal,shan}@hpl.hp.com
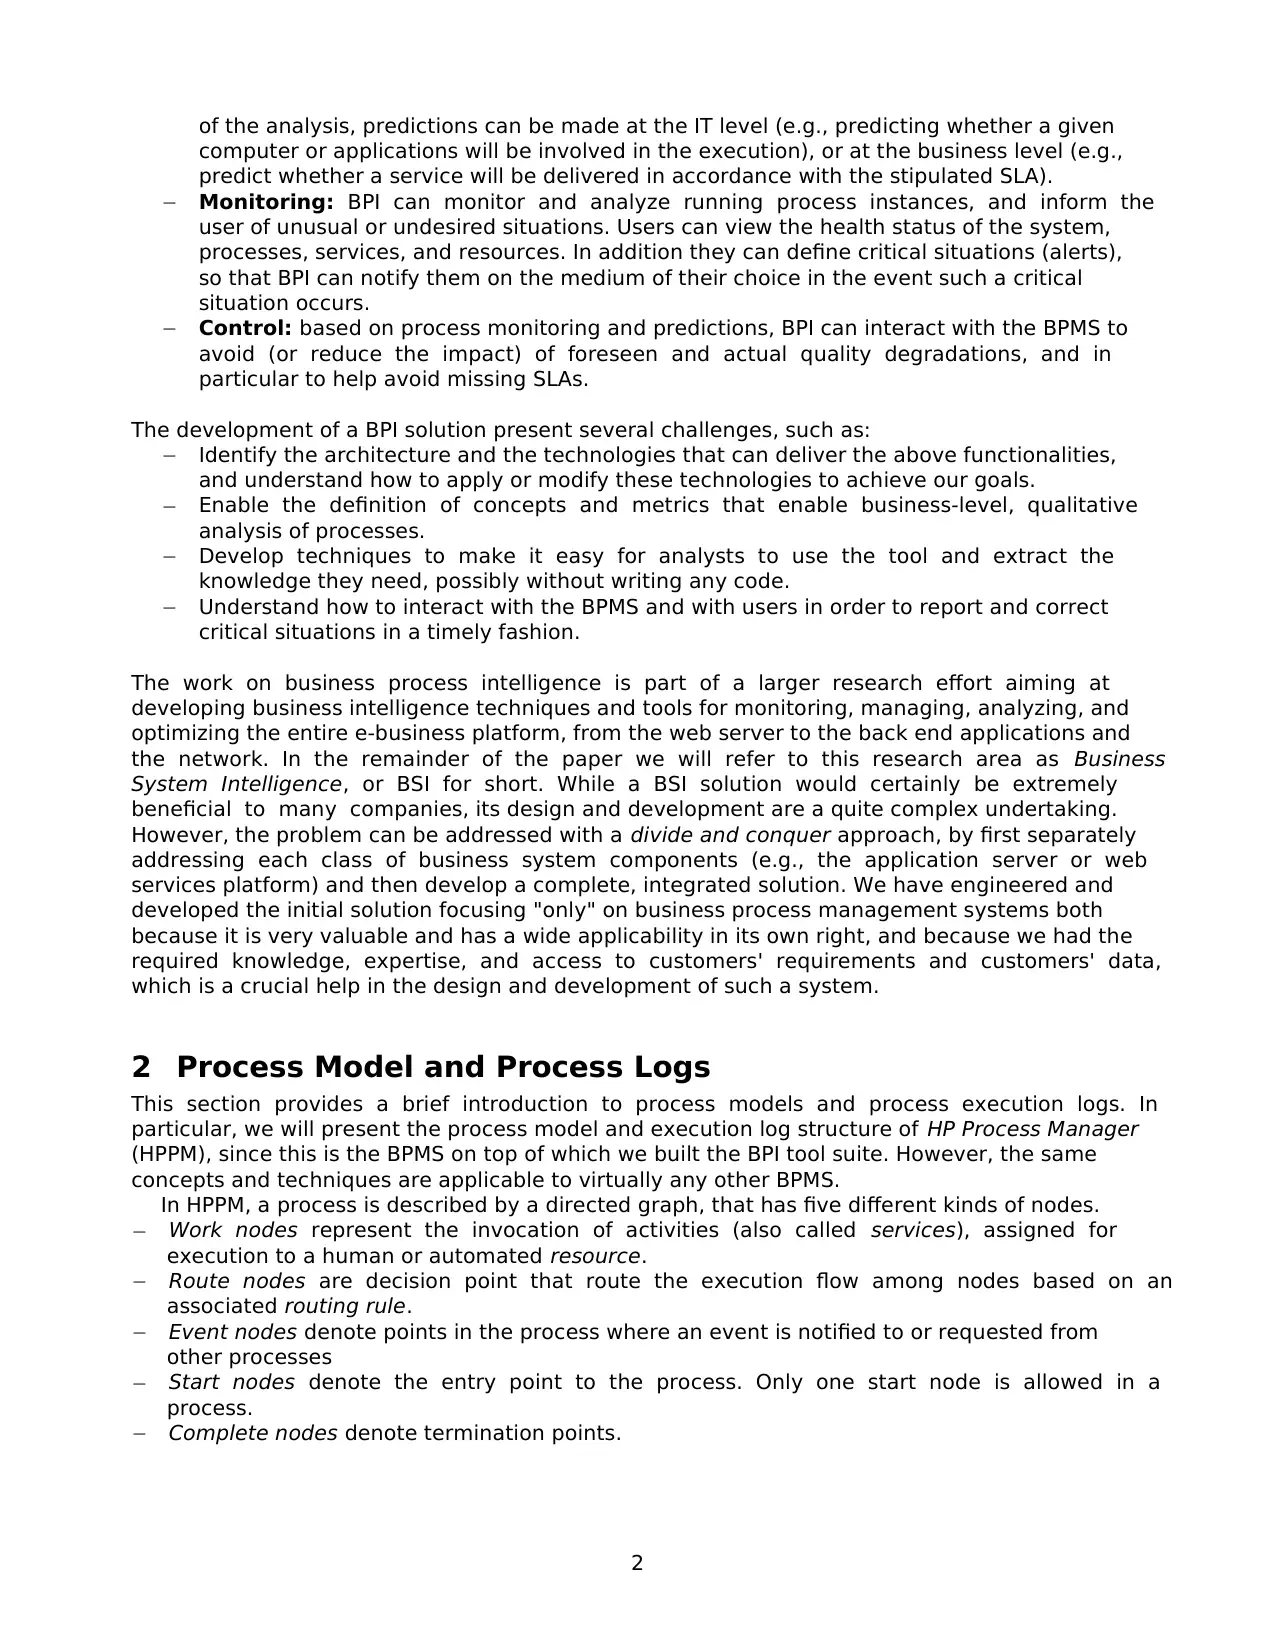
1 Introduction and motivations
Process design and automation technologies are being increasingly used by both traditional and
newly-formed, Interned-based enterprises in order to improve the quality and efficiency of their
administrative and production processes, to manage e-commerce transactions, and to rapidly
and reliably deliver services to businesses and individual customers.
In order to attract and retain customers as well as business partners, organizations need to
provide their services (i.e., execute their processes) with a high, consistent, and predictable
quality. From a process automation perspective, this has several implications: for example, the
business processes should be correctly designed, their execution should be supported by a
system that can meet the workload requirements, and the (human or automated) process
resources should be able to perform their work items in a timely fashion. While research in the
business process area has been mostly focusing on developing new process models and process
automation techniques, little work has been done in the areas of process analysis, prediction,
and optimization.
This paper presents a set of integrated tools that supports business and IT users in
managing process execution quality. We refer to this set of tools as the Business Process
Intelligence (BPI) tool suite, since it is based on the application of business intelligence
techniques to business processes. In fact, Business Process Management Systems (BPMSs)
record many types of events that occur during process executions, including the start and
completion time of each activity, its input and output data, the resource that executed it, and
any failure that occurred during activity or process execution. By cleaning and aggregating
process logs into a warehouse and by analyzing them with business intelligence technologies,
we can extract knowledge about the circumstances in which high- or low-quality executions
occurred in the past, and use this information to explain why they occurred as well as predict
potential problems in running processes. In this paper we use a very high-level and user-
oriented notion of quality: we assume that it is up to the (business or IT) users to define what
quality means to them, and in general which are the characteristics that they want to analyze
and predict.
The BPI suite provides several features to automatically or semi-automatically manage
business process quality:
− Analysis: BPI allows users to analyze completed process executions from both a
business and an IT perspective. IT analysts will be interested in viewing detailed, low-
level information such as average execution time per node or the length of the work
queues of resources. Business users will instead be interested in higher-level information,
such as the number of "successful" process executions, or the characteristics of
processes that did not meet the Service Level Agreement (SLA) stipulated with
customers. Besides providing a wide set of reporting functionalities, BPI also offers
several features to help analysts identify the causes of process execution behaviors of
interest.
− Prediction: BPI can derive prediction models and apply such models to running
processes, to identify the possibility of exceptions or undesired behavior. As in the case
Business Process Intelligence
Fabio Casati, Umesh Dayal, Mehmet Sayal, and Ming-Chien Shan
Hewlett-Packard
1501 Page Mill road, 1-U4
Palo Alto, CA, 94304
Email: {casati,dayal,sayal,shan}@hpl.hp.com
1 Introduction and motivations
Process design and automation technologies are being increasingly used by both traditional and
newly-formed, Interned-based enterprises in order to improve the quality and efficiency of their
administrative and production processes, to manage e-commerce transactions, and to rapidly
and reliably deliver services to businesses and individual customers.
In order to attract and retain customers as well as business partners, organizations need to
provide their services (i.e., execute their processes) with a high, consistent, and predictable
quality. From a process automation perspective, this has several implications: for example, the
business processes should be correctly designed, their execution should be supported by a
system that can meet the workload requirements, and the (human or automated) process
resources should be able to perform their work items in a timely fashion. While research in the
business process area has been mostly focusing on developing new process models and process
automation techniques, little work has been done in the areas of process analysis, prediction,
and optimization.
This paper presents a set of integrated tools that supports business and IT users in
managing process execution quality. We refer to this set of tools as the Business Process
Intelligence (BPI) tool suite, since it is based on the application of business intelligence
techniques to business processes. In fact, Business Process Management Systems (BPMSs)
record many types of events that occur during process executions, including the start and
completion time of each activity, its input and output data, the resource that executed it, and
any failure that occurred during activity or process execution. By cleaning and aggregating
process logs into a warehouse and by analyzing them with business intelligence technologies,
we can extract knowledge about the circumstances in which high- or low-quality executions
occurred in the past, and use this information to explain why they occurred as well as predict
potential problems in running processes. In this paper we use a very high-level and user-
oriented notion of quality: we assume that it is up to the (business or IT) users to define what
quality means to them, and in general which are the characteristics that they want to analyze
and predict.
The BPI suite provides several features to automatically or semi-automatically manage
business process quality:
− Analysis: BPI allows users to analyze completed process executions from both a
business and an IT perspective. IT analysts will be interested in viewing detailed, low-
level information such as average execution time per node or the length of the work
queues of resources. Business users will instead be interested in higher-level information,
such as the number of "successful" process executions, or the characteristics of
processes that did not meet the Service Level Agreement (SLA) stipulated with
customers. Besides providing a wide set of reporting functionalities, BPI also offers
several features to help analysts identify the causes of process execution behaviors of
interest.
− Prediction: BPI can derive prediction models and apply such models to running
processes, to identify the possibility of exceptions or undesired behavior. As in the case
2
of the analysis, predictions can be made at the IT level (e.g., predicting whether a given
computer or applications will be involved in the execution), or at the business level (e.g.,
predict whether a service will be delivered in accordance with the stipulated SLA).
− Monitoring: BPI can monitor and analyze running process instances, and inform the
user of unusual or undesired situations. Users can view the health status of the system,
processes, services, and resources. In addition they can define critical situations (alerts),
so that BPI can notify them on the medium of their choice in the event such a critical
situation occurs.
− Control: based on process monitoring and predictions, BPI can interact with the BPMS to
avoid (or reduce the impact) of foreseen and actual quality degradations, and in
particular to help avoid missing SLAs.
The development of a BPI solution present several challenges, such as:
− Identify the architecture and the technologies that can deliver the above functionalities,
and understand how to apply or modify these technologies to achieve our goals.
− Enable the definition of concepts and metrics that enable business-level, qualitative
analysis of processes.
− Develop techniques to make it easy for analysts to use the tool and extract the
knowledge they need, possibly without writing any code.
− Understand how to interact with the BPMS and with users in order to report and correct
critical situations in a timely fashion.
The work on business process intelligence is part of a larger research effort aiming at
developing business intelligence techniques and tools for monitoring, managing, analyzing, and
optimizing the entire e-business platform, from the web server to the back end applications and
the network. In the remainder of the paper we will refer to this research area as Business
System Intelligence, or BSI for short. While a BSI solution would certainly be extremely
beneficial to many companies, its design and development are a quite complex undertaking.
However, the problem can be addressed with a divide and conquer approach, by first separately
addressing each class of business system components (e.g., the application server or web
services platform) and then develop a complete, integrated solution. We have engineered and
developed the initial solution focusing "only" on business process management systems both
because it is very valuable and has a wide applicability in its own right, and because we had the
required knowledge, expertise, and access to customers' requirements and customers' data,
which is a crucial help in the design and development of such a system.
2 Process Model and Process Logs
This section provides a brief introduction to process models and process execution logs. In
particular, we will present the process model and execution log structure of HP Process Manager
(HPPM), since this is the BPMS on top of which we built the BPI tool suite. However, the same
concepts and techniques are applicable to virtually any other BPMS.
In HPPM, a process is described by a directed graph, that has five different kinds of nodes.
− Work nodes represent the invocation of activities (also called services), assigned for
execution to a human or automated resource.
− Route nodes are decision point that route the execution flow among nodes based on an
associated routing rule.
− Event nodes denote points in the process where an event is notified to or requested from
other processes
− Start nodes denote the entry point to the process. Only one start node is allowed in a
process.
− Complete nodes denote termination points.
Secure Best Marks with AI Grader
Need help grading? Try our AI Grader for instant feedback on your assignments.

3
Start
Change or
Abandon
Authorisation Confirm with
Buyer
Purchase itemsAbandon ? Authorised? End
Abandoned
YES
NO
Monitor
cancellation
Canceled
and-split
Cancel order
Figure 1 – The Expense Approval process
Arcs in the graph denote execution dependencies among nodes: when a work node execution
is completed, the output arc is "fired", and the node connected to this arc is activated. Arcs in
output to route nodes are instead fired based on the evaluation of the routing rules. As an
example, Figure 1 shows the Expense Approval process. In the figure, boxes represent work
nodes, diamonds are route nodes, triangles represent start and completion nodes, while
pentagons represent event nodes.
A process definition can be instantiated several times, and multiple instances may be
concurrently active. Activity executions can access and modify process variables.
Every work node is associated to a service description, that defines the logic for selecting a
resource (or resource group) to be invoked for executing the work. The service also defines the
parameters to be passed to the resource upon invocation and received from the resource upon
completion of the work. Several work nodes can be associated to the same service description.
For example, both nodes confirm with buyer and change or abandon of Figure 1 are associated
to service description send_email, executed by the resource email_server (both of them send
emails to a user).
When a work node is scheduled for execution, the BPMS reads the corresponding service
description, executes the resource selection rule associated to the service description, and puts
the work item to be performed into the resource's worklist. Resources periodically connect to
BPMS, pick a work item assigned to them (or to a group to which they are member of), and
then execute it. Details on the HPPM process model are provided in [HPPM-PD]. An introduction
to BPMS in general is provided in [Leymann00].
BPMSs log information on process, node, and service executions into an audit log database,
typically stored in a relational DBMS. The audit log database include the following information:
− Process instances: activation and completion timestamps, current execution state (e.g.,
started, suspended, completed), and name of the user that started the process instance.
− Service instances: activation and completion timestamps, current execution state, and
name of the resource that executed the service.
− Node instances: activation and completion timestamps and execution state for the most
recent execution of the node within a process instance (multiple executions are possible if
the process contains loops).
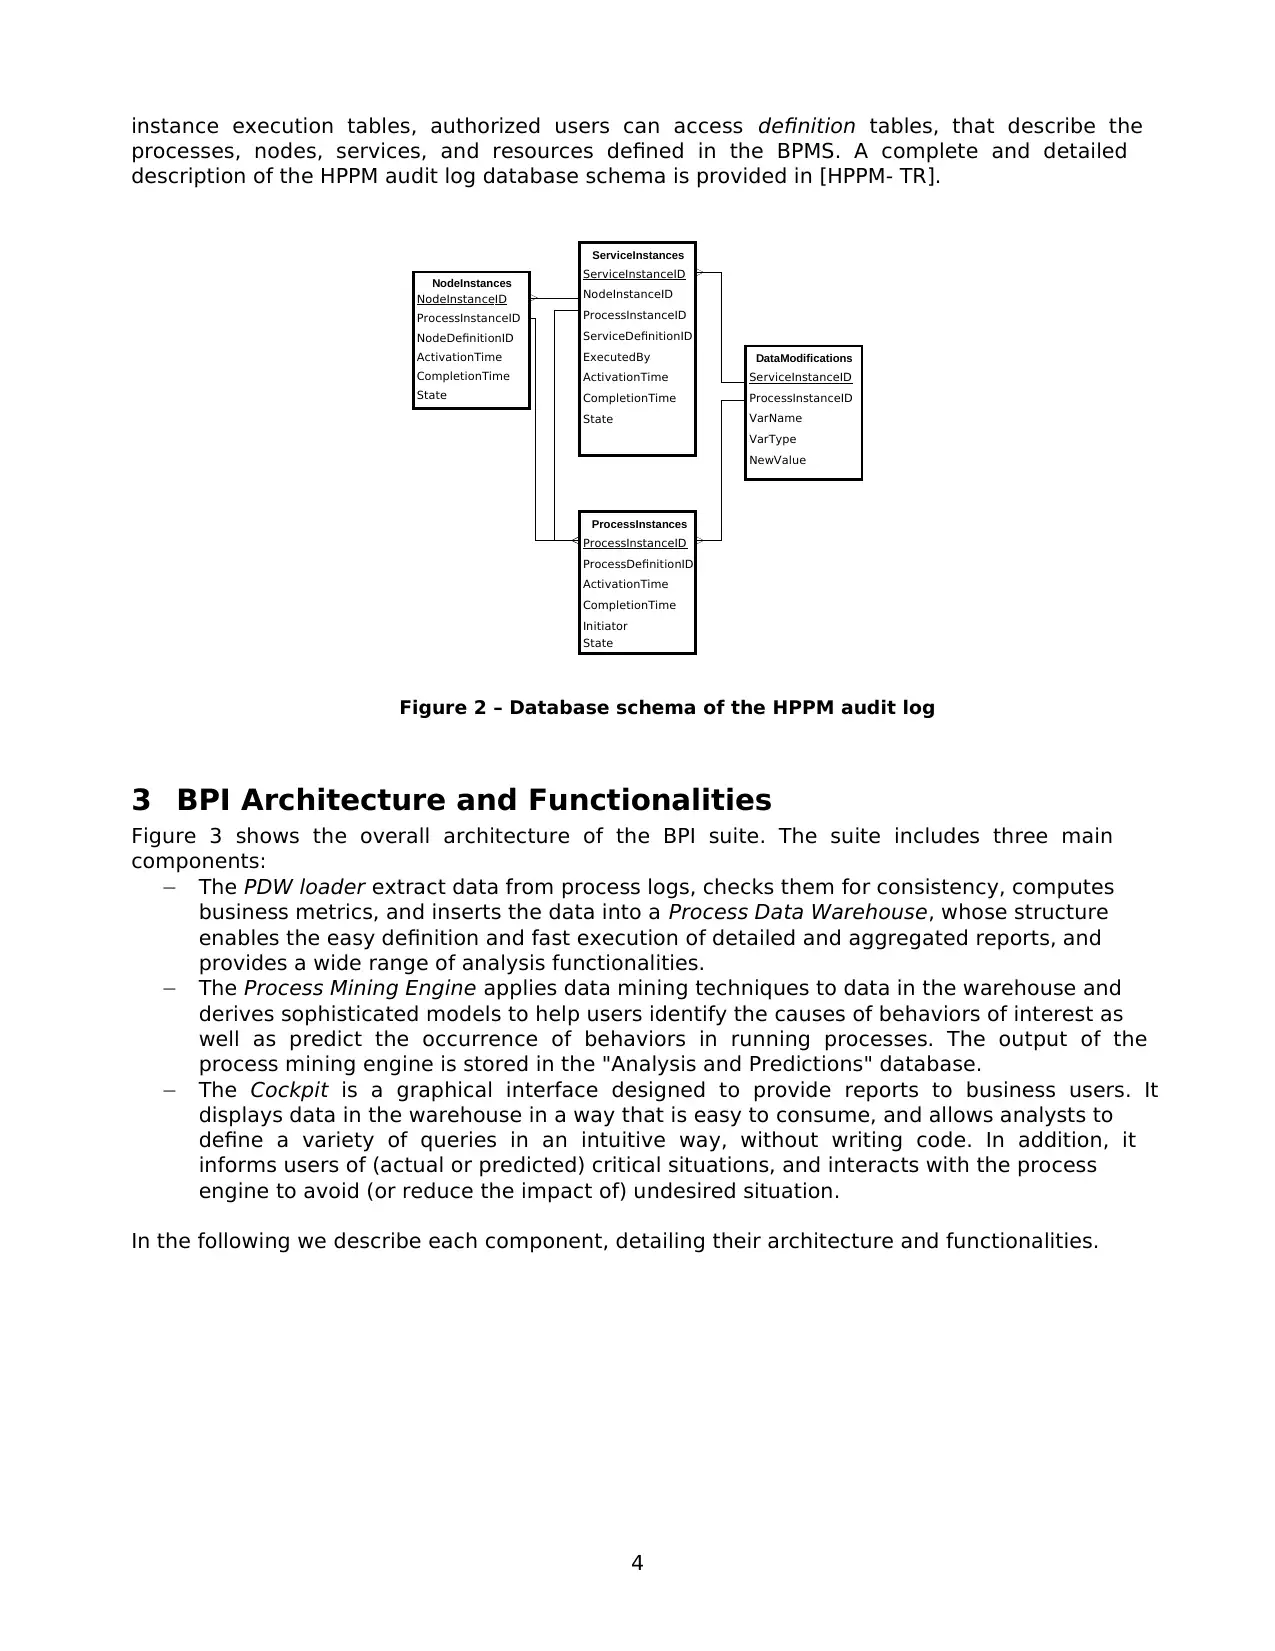
− Data Modifications: new value for each data item every time it is modified.
Figure 2 shows the audit log tables and their relationships. Underlined attributes denote
primary keys, while links among tables denote foreign key constraints. For clarity of
presentation, in the figure we have slightly simplified the structure of the tables. In addition to
Start
Change or
Abandon
Authorisation Confirm with
Buyer
Purchase itemsAbandon ? Authorised? End
Abandoned
YES
NO
Monitor
cancellation
Canceled
and-split
Cancel order
Figure 1 – The Expense Approval process
Arcs in the graph denote execution dependencies among nodes: when a work node execution
is completed, the output arc is "fired", and the node connected to this arc is activated. Arcs in
output to route nodes are instead fired based on the evaluation of the routing rules. As an
example, Figure 1 shows the Expense Approval process. In the figure, boxes represent work
nodes, diamonds are route nodes, triangles represent start and completion nodes, while
pentagons represent event nodes.
A process definition can be instantiated several times, and multiple instances may be
concurrently active. Activity executions can access and modify process variables.
Every work node is associated to a service description, that defines the logic for selecting a
resource (or resource group) to be invoked for executing the work. The service also defines the
parameters to be passed to the resource upon invocation and received from the resource upon
completion of the work. Several work nodes can be associated to the same service description.
For example, both nodes confirm with buyer and change or abandon of Figure 1 are associated
to service description send_email, executed by the resource email_server (both of them send
emails to a user).
When a work node is scheduled for execution, the BPMS reads the corresponding service
description, executes the resource selection rule associated to the service description, and puts
the work item to be performed into the resource's worklist. Resources periodically connect to
BPMS, pick a work item assigned to them (or to a group to which they are member of), and
then execute it. Details on the HPPM process model are provided in [HPPM-PD]. An introduction
to BPMS in general is provided in [Leymann00].
BPMSs log information on process, node, and service executions into an audit log database,
typically stored in a relational DBMS. The audit log database include the following information:
− Process instances: activation and completion timestamps, current execution state (e.g.,
started, suspended, completed), and name of the user that started the process instance.
− Service instances: activation and completion timestamps, current execution state, and
name of the resource that executed the service.
− Node instances: activation and completion timestamps and execution state for the most
recent execution of the node within a process instance (multiple executions are possible if
the process contains loops).
− Data Modifications: new value for each data item every time it is modified.
Figure 2 shows the audit log tables and their relationships. Underlined attributes denote
primary keys, while links among tables denote foreign key constraints. For clarity of
presentation, in the figure we have slightly simplified the structure of the tables. In addition to
4
instance execution tables, authorized users can access definition tables, that describe the
processes, nodes, services, and resources defined in the BPMS. A complete and detailed
description of the HPPM audit log database schema is provided in [HPPM- TR].
NodeInstances
NodeInstanceID
ProcessInstanceID
NodeDefinitionID
ActivationTime
CompletionTime
State
ServiceInstances
ServiceInstanceID
NodeInstanceID
ProcessInstanceID
ServiceDefinitionID
ExecutedBy
ActivationTime
CompletionTime
State
ProcessInstances
ProcessInstanceID
ProcessDefinitionID
ActivationTime
CompletionTime
Initiator
State
DataModifications
ServiceInstanceID
ProcessInstanceID
VarName
VarType
NewValue
Figure 2 – Database schema of the HPPM audit log
3 BPI Architecture and Functionalities
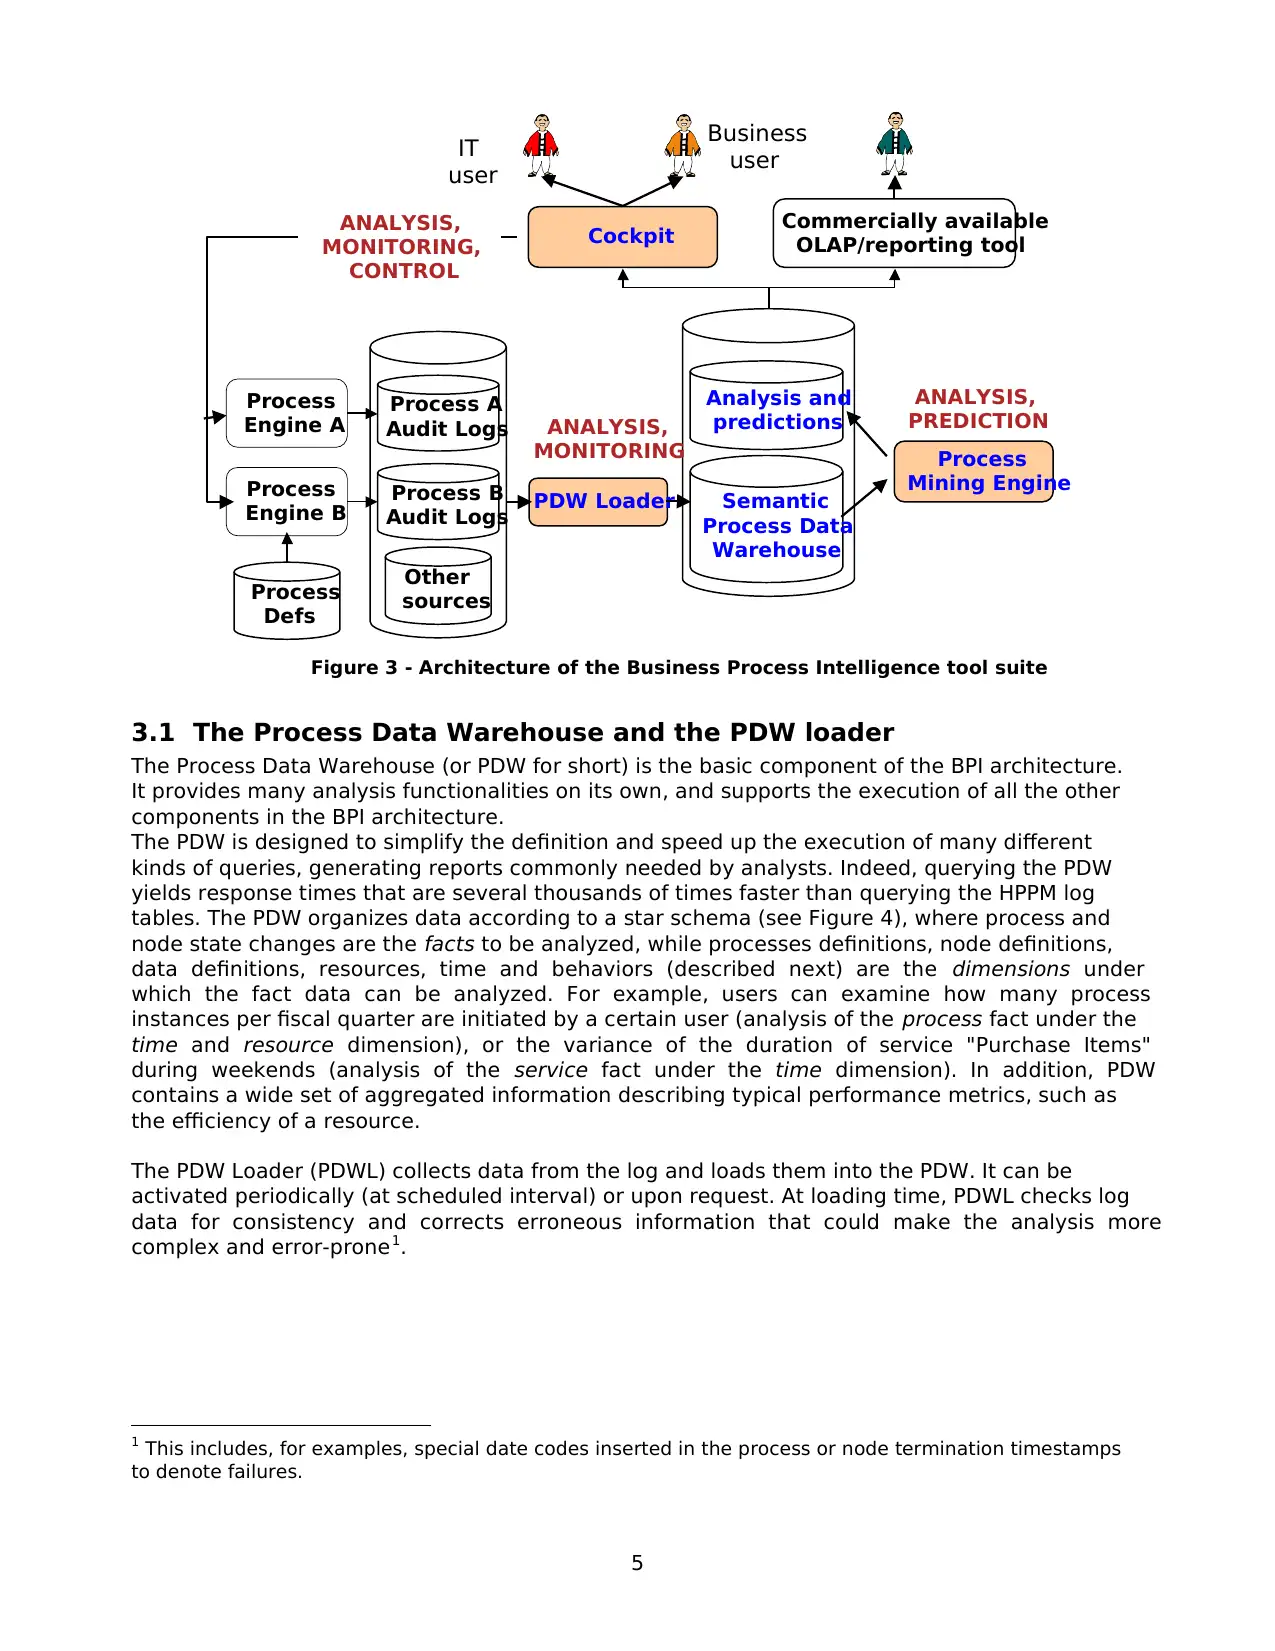
Figure 3 shows the overall architecture of the BPI suite. The suite includes three main
components:
− The PDW loader extract data from process logs, checks them for consistency, computes
business metrics, and inserts the data into a Process Data Warehouse, whose structure
enables the easy definition and fast execution of detailed and aggregated reports, and
provides a wide range of analysis functionalities.
− The Process Mining Engine applies data mining techniques to data in the warehouse and
derives sophisticated models to help users identify the causes of behaviors of interest as
well as predict the occurrence of behaviors in running processes. The output of the
process mining engine is stored in the "Analysis and Predictions" database.
− The Cockpit is a graphical interface designed to provide reports to business users. It
displays data in the warehouse in a way that is easy to consume, and allows analysts to
define a variety of queries in an intuitive way, without writing code. In addition, it
informs users of (actual or predicted) critical situations, and interacts with the process
engine to avoid (or reduce the impact of) undesired situation.
In the following we describe each component, detailing their architecture and functionalities.
instance execution tables, authorized users can access definition tables, that describe the
processes, nodes, services, and resources defined in the BPMS. A complete and detailed
description of the HPPM audit log database schema is provided in [HPPM- TR].
NodeInstances
NodeInstanceID
ProcessInstanceID
NodeDefinitionID
ActivationTime
CompletionTime
State
ServiceInstances
ServiceInstanceID
NodeInstanceID
ProcessInstanceID
ServiceDefinitionID
ExecutedBy
ActivationTime
CompletionTime
State
ProcessInstances
ProcessInstanceID
ProcessDefinitionID
ActivationTime
CompletionTime
Initiator
State
DataModifications
ServiceInstanceID
ProcessInstanceID
VarName
VarType
NewValue
Figure 2 – Database schema of the HPPM audit log
3 BPI Architecture and Functionalities
Figure 3 shows the overall architecture of the BPI suite. The suite includes three main
components:
− The PDW loader extract data from process logs, checks them for consistency, computes
business metrics, and inserts the data into a Process Data Warehouse, whose structure
enables the easy definition and fast execution of detailed and aggregated reports, and
provides a wide range of analysis functionalities.
− The Process Mining Engine applies data mining techniques to data in the warehouse and
derives sophisticated models to help users identify the causes of behaviors of interest as
well as predict the occurrence of behaviors in running processes. The output of the
process mining engine is stored in the "Analysis and Predictions" database.
− The Cockpit is a graphical interface designed to provide reports to business users. It
displays data in the warehouse in a way that is easy to consume, and allows analysts to
define a variety of queries in an intuitive way, without writing code. In addition, it
informs users of (actual or predicted) critical situations, and interacts with the process
engine to avoid (or reduce the impact of) undesired situation.
In the following we describe each component, detailing their architecture and functionalities.
5
Other
sources
Process A
Audit Logs
Process
Engine A
Process B
Audit Logs
Process
Engine B
Analysis and
predictions
Semantic
Process Data
Warehouse
Cockpit Commercially available
OLAP/reporting tool
PDW Loader
Process
Mining Engine
IT
user
Business
user
ANALYSIS,
MONITORING
ANALYSIS,
PREDICTION
ANALYSIS,
MONITORING,
CONTROL
Process
Defs
Figure 3 - Architecture of the Business Process Intelligence tool suite
3.1 The Process Data Warehouse and the PDW loader
The Process Data Warehouse (or PDW for short) is the basic component of the BPI architecture.
It provides many analysis functionalities on its own, and supports the execution of all the other
components in the BPI architecture.
The PDW is designed to simplify the definition and speed up the execution of many different
kinds of queries, generating reports commonly needed by analysts. Indeed, querying the PDW
yields response times that are several thousands of times faster than querying the HPPM log
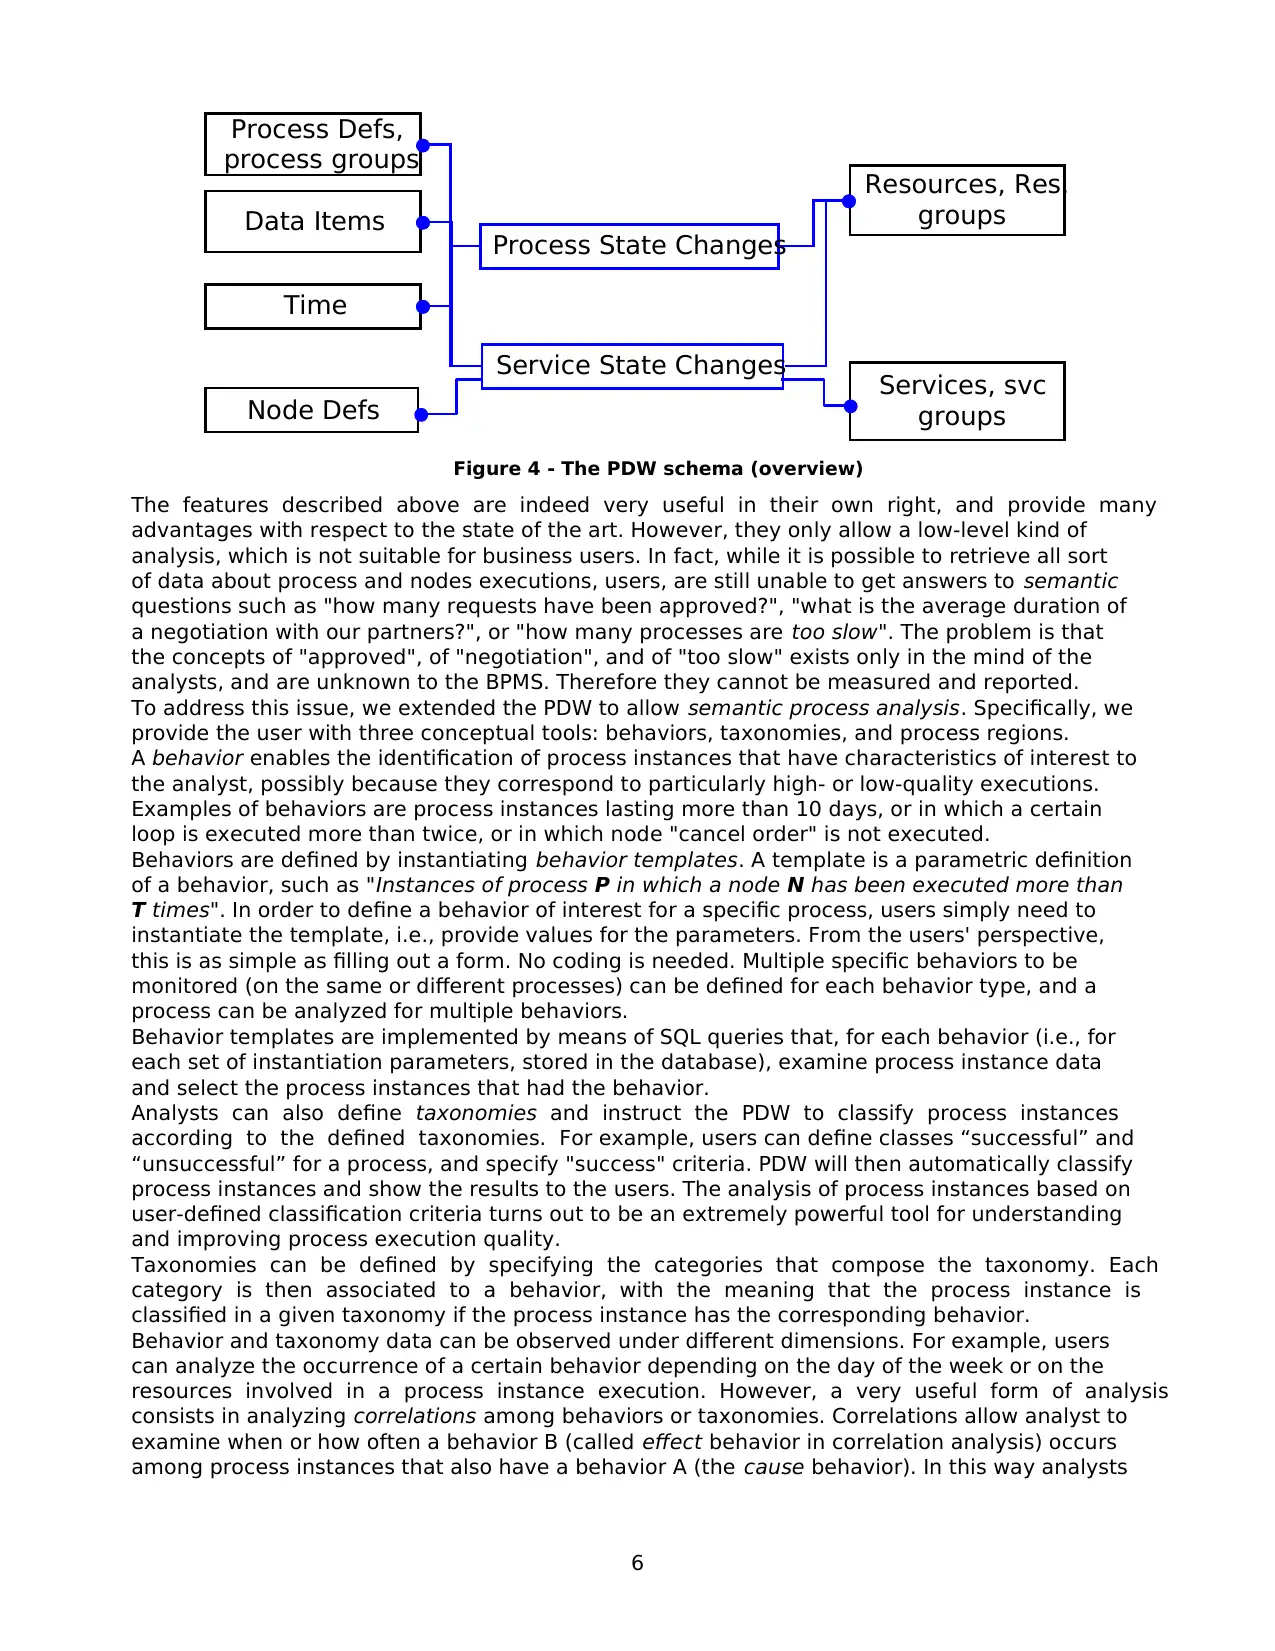
tables. The PDW organizes data according to a star schema (see Figure 4), where process and
node state changes are the facts to be analyzed, while processes definitions, node definitions,
data definitions, resources, time and behaviors (described next) are the dimensions under
which the fact data can be analyzed. For example, users can examine how many process
instances per fiscal quarter are initiated by a certain user (analysis of the process fact under the
time and resource dimension), or the variance of the duration of service "Purchase Items"
during weekends (analysis of the service fact under the time dimension). In addition, PDW
contains a wide set of aggregated information describing typical performance metrics, such as
the efficiency of a resource.
The PDW Loader (PDWL) collects data from the log and loads them into the PDW. It can be
activated periodically (at scheduled interval) or upon request. At loading time, PDWL checks log
data for consistency and corrects erroneous information that could make the analysis more
complex and error-prone1.
1 This includes, for examples, special date codes inserted in the process or node termination timestamps
to denote failures.
Other
sources
Process A
Audit Logs
Process
Engine A
Process B
Audit Logs
Process
Engine B
Analysis and
predictions
Semantic
Process Data
Warehouse
Cockpit Commercially available
OLAP/reporting tool
PDW Loader
Process
Mining Engine
IT
user
Business
user
ANALYSIS,
MONITORING
ANALYSIS,
PREDICTION
ANALYSIS,
MONITORING,
CONTROL
Process
Defs
Figure 3 - Architecture of the Business Process Intelligence tool suite
3.1 The Process Data Warehouse and the PDW loader
The Process Data Warehouse (or PDW for short) is the basic component of the BPI architecture.
It provides many analysis functionalities on its own, and supports the execution of all the other
components in the BPI architecture.
The PDW is designed to simplify the definition and speed up the execution of many different
kinds of queries, generating reports commonly needed by analysts. Indeed, querying the PDW
yields response times that are several thousands of times faster than querying the HPPM log
tables. The PDW organizes data according to a star schema (see Figure 4), where process and
node state changes are the facts to be analyzed, while processes definitions, node definitions,
data definitions, resources, time and behaviors (described next) are the dimensions under
which the fact data can be analyzed. For example, users can examine how many process
instances per fiscal quarter are initiated by a certain user (analysis of the process fact under the
time and resource dimension), or the variance of the duration of service "Purchase Items"
during weekends (analysis of the service fact under the time dimension). In addition, PDW
contains a wide set of aggregated information describing typical performance metrics, such as
the efficiency of a resource.
The PDW Loader (PDWL) collects data from the log and loads them into the PDW. It can be
activated periodically (at scheduled interval) or upon request. At loading time, PDWL checks log
data for consistency and corrects erroneous information that could make the analysis more
complex and error-prone1.
1 This includes, for examples, special date codes inserted in the process or node termination timestamps
to denote failures.
Paraphrase This Document
Need a fresh take? Get an instant paraphrase of this document with our AI Paraphraser
6
Process State Changes
Service State Changes
Process Defs,
process groups Resources, Res.
groups
Services, svc
groupsNode Defs
Time
Data Items
Figure 4 - The PDW schema (overview)
The features described above are indeed very useful in their own right, and provide many
advantages with respect to the state of the art. However, they only allow a low-level kind of
analysis, which is not suitable for business users. In fact, while it is possible to retrieve all sort
of data about process and nodes executions, users, are still unable to get answers to semantic
questions such as "how many requests have been approved?", "what is the average duration of
a negotiation with our partners?", or "how many processes are too slow". The problem is that
the concepts of "approved", of "negotiation", and of "too slow" exists only in the mind of the
analysts, and are unknown to the BPMS. Therefore they cannot be measured and reported.
To address this issue, we extended the PDW to allow semantic process analysis. Specifically, we
provide the user with three conceptual tools: behaviors, taxonomies, and process regions.
A behavior enables the identification of process instances that have characteristics of interest to
the analyst, possibly because they correspond to particularly high- or low-quality executions.
Examples of behaviors are process instances lasting more than 10 days, or in which a certain
loop is executed more than twice, or in which node "cancel order" is not executed.
Behaviors are defined by instantiating behavior templates. A template is a parametric definition
of a behavior, such as "Instances of process P in which a node N has been executed more than
T times". In order to define a behavior of interest for a specific process, users simply need to
instantiate the template, i.e., provide values for the parameters. From the users' perspective,
this is as simple as filling out a form. No coding is needed. Multiple specific behaviors to be
monitored (on the same or different processes) can be defined for each behavior type, and a
process can be analyzed for multiple behaviors.
Behavior templates are implemented by means of SQL queries that, for each behavior (i.e., for
each set of instantiation parameters, stored in the database), examine process instance data
and select the process instances that had the behavior.
Analysts can also define taxonomies and instruct the PDW to classify process instances
according to the defined taxonomies. For example, users can define classes “successful” and
“unsuccessful” for a process, and specify "success" criteria. PDW will then automatically classify
process instances and show the results to the users. The analysis of process instances based on
user-defined classification criteria turns out to be an extremely powerful tool for understanding
and improving process execution quality.
Taxonomies can be defined by specifying the categories that compose the taxonomy. Each
category is then associated to a behavior, with the meaning that the process instance is
classified in a given taxonomy if the process instance has the corresponding behavior.
Behavior and taxonomy data can be observed under different dimensions. For example, users
can analyze the occurrence of a certain behavior depending on the day of the week or on the
resources involved in a process instance execution. However, a very useful form of analysis
consists in analyzing correlations among behaviors or taxonomies. Correlations allow analyst to
examine when or how often a behavior B (called effect behavior in correlation analysis) occurs
among process instances that also have a behavior A (the cause behavior). In this way analysts
7
can examine cause-effect relationships among behaviors, for example to identify sources of
problems and undesired situations.
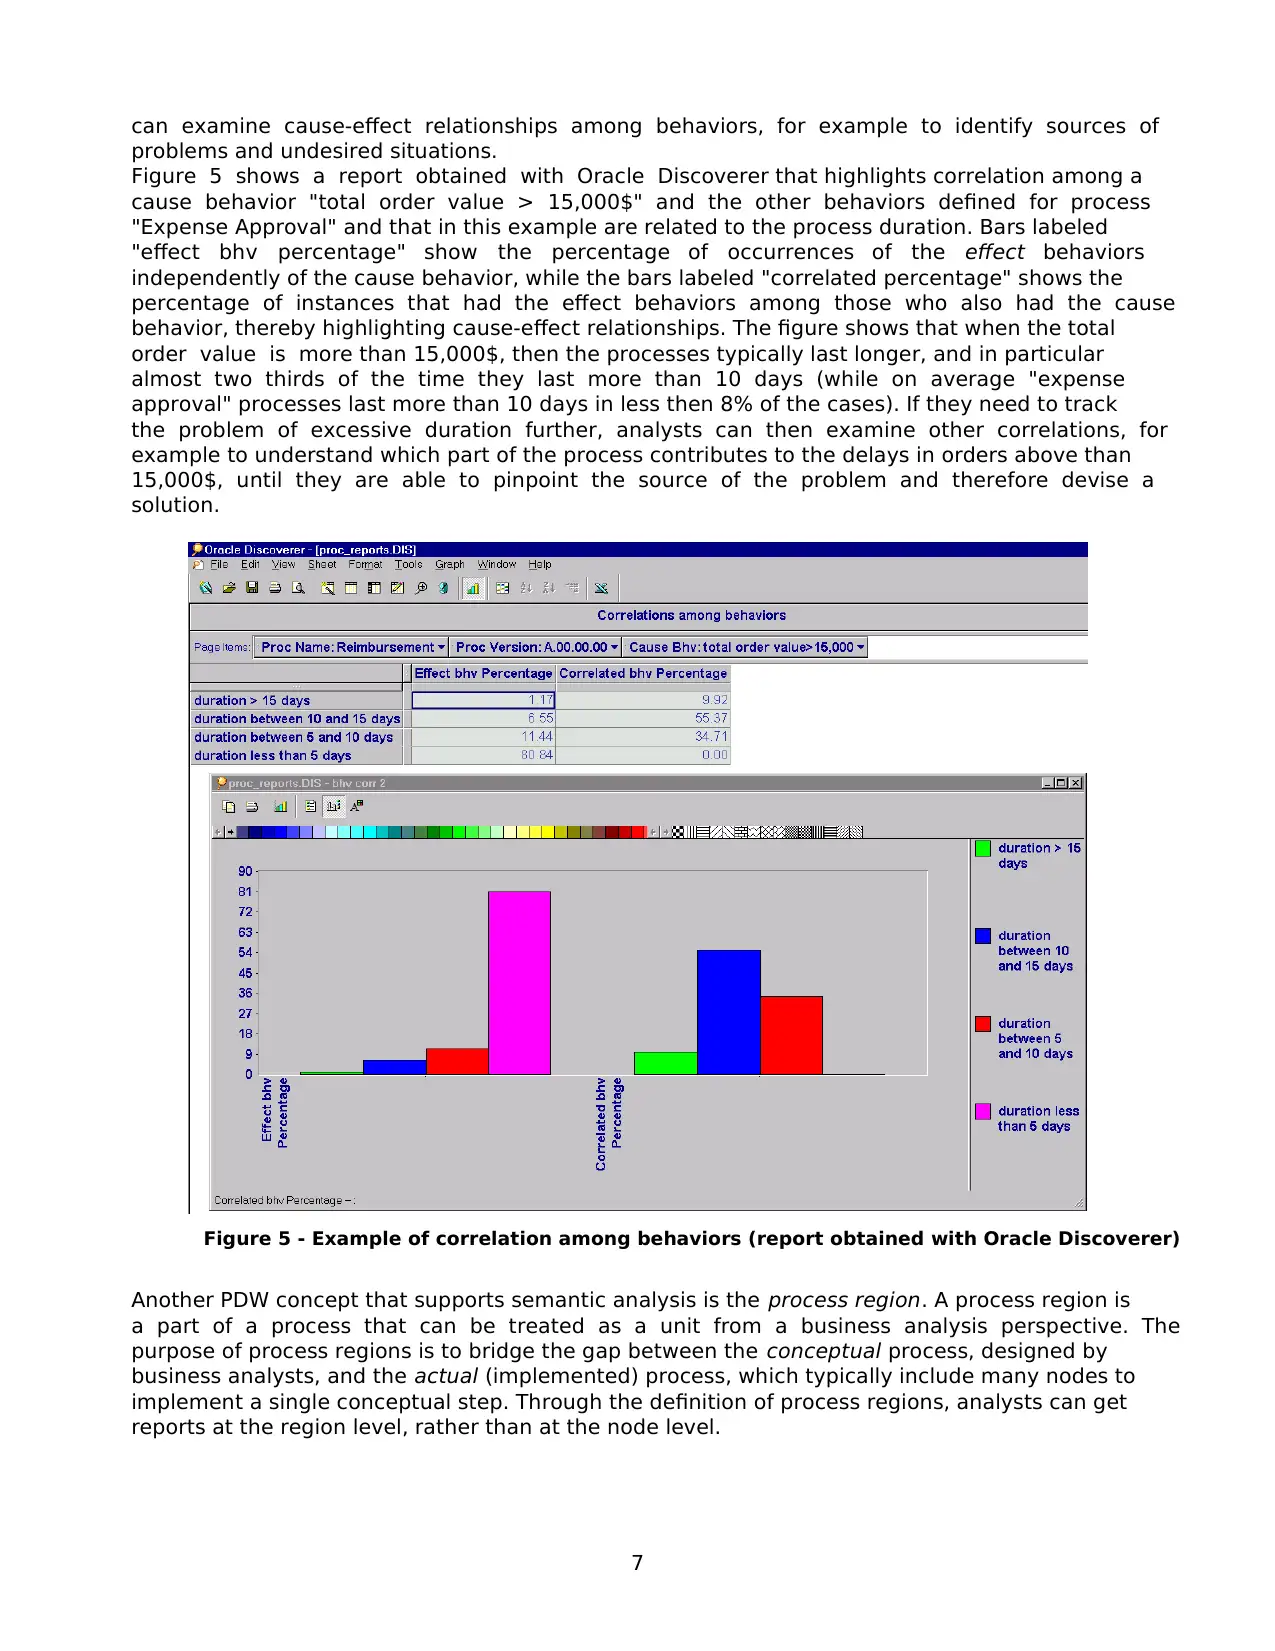
Figure 5 shows a report obtained with Oracle Discoverer that highlights correlation among a
cause behavior "total order value > 15,000$" and the other behaviors defined for process
"Expense Approval" and that in this example are related to the process duration. Bars labeled
"effect bhv percentage" show the percentage of occurrences of the effect behaviors
independently of the cause behavior, while the bars labeled "correlated percentage" shows the
percentage of instances that had the effect behaviors among those who also had the cause
behavior, thereby highlighting cause-effect relationships. The figure shows that when the total
order value is more than 15,000$, then the processes typically last longer, and in particular
almost two thirds of the time they last more than 10 days (while on average "expense
approval" processes last more than 10 days in less then 8% of the cases). If they need to track
the problem of excessive duration further, analysts can then examine other correlations, for
example to understand which part of the process contributes to the delays in orders above than
15,000$, until they are able to pinpoint the source of the problem and therefore devise a
solution.
Figure 5 - Example of correlation among behaviors (report obtained with Oracle Discoverer)
Another PDW concept that supports semantic analysis is the process region. A process region is
a part of a process that can be treated as a unit from a business analysis perspective. The
purpose of process regions is to bridge the gap between the conceptual process, designed by
business analysts, and the actual (implemented) process, which typically include many nodes to
implement a single conceptual step. Through the definition of process regions, analysts can get
reports at the region level, rather than at the node level.
can examine cause-effect relationships among behaviors, for example to identify sources of
problems and undesired situations.
Figure 5 shows a report obtained with Oracle Discoverer that highlights correlation among a
cause behavior "total order value > 15,000$" and the other behaviors defined for process
"Expense Approval" and that in this example are related to the process duration. Bars labeled
"effect bhv percentage" show the percentage of occurrences of the effect behaviors
independently of the cause behavior, while the bars labeled "correlated percentage" shows the
percentage of instances that had the effect behaviors among those who also had the cause
behavior, thereby highlighting cause-effect relationships. The figure shows that when the total
order value is more than 15,000$, then the processes typically last longer, and in particular
almost two thirds of the time they last more than 10 days (while on average "expense
approval" processes last more than 10 days in less then 8% of the cases). If they need to track
the problem of excessive duration further, analysts can then examine other correlations, for
example to understand which part of the process contributes to the delays in orders above than
15,000$, until they are able to pinpoint the source of the problem and therefore devise a
solution.
Figure 5 - Example of correlation among behaviors (report obtained with Oracle Discoverer)
Another PDW concept that supports semantic analysis is the process region. A process region is
a part of a process that can be treated as a unit from a business analysis perspective. The
purpose of process regions is to bridge the gap between the conceptual process, designed by
business analysts, and the actual (implemented) process, which typically include many nodes to
implement a single conceptual step. Through the definition of process regions, analysts can get
reports at the region level, rather than at the node level.
8
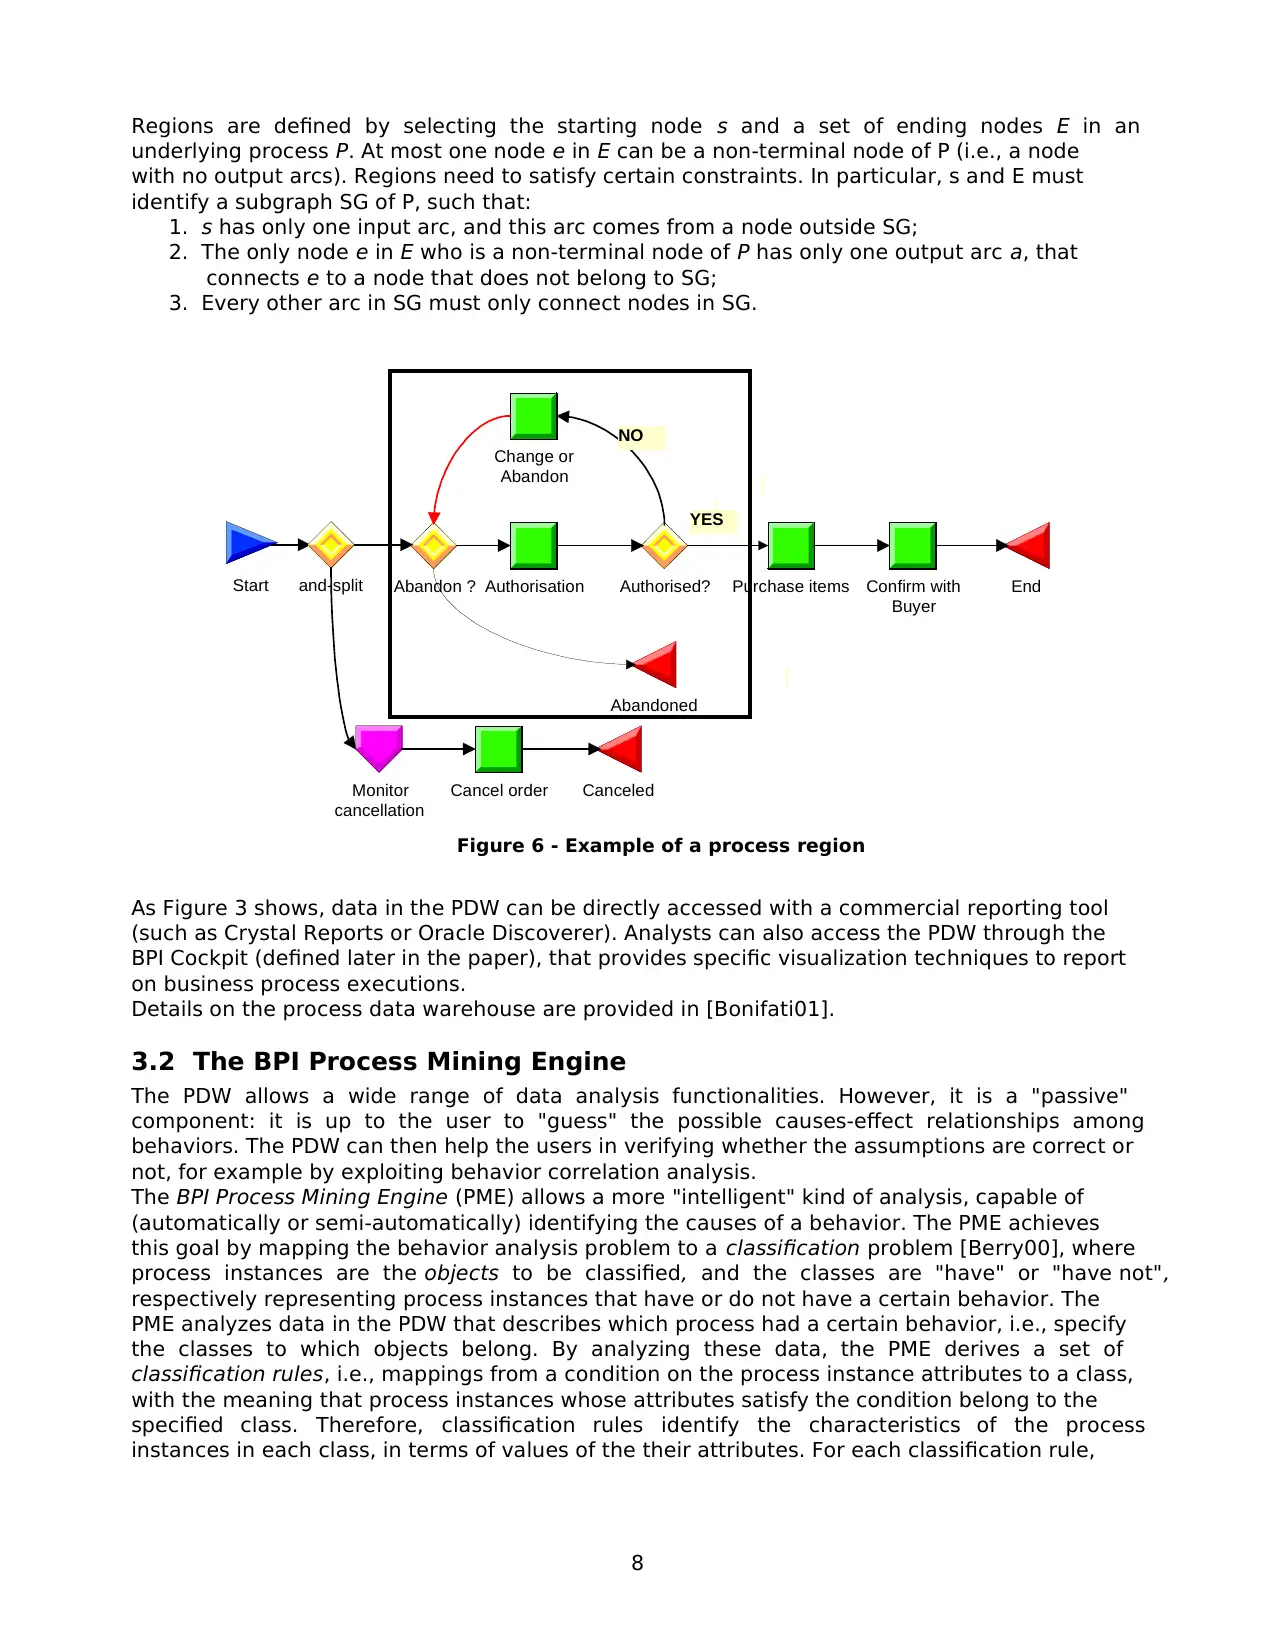
Regions are defined by selecting the starting node s and a set of ending nodes E in an
underlying process P. At most one node e in E can be a non-terminal node of P (i.e., a node
with no output arcs). Regions need to satisfy certain constraints. In particular, s and E must
identify a subgraph SG of P, such that:
1. s has only one input arc, and this arc comes from a node outside SG;
2. The only node e in E who is a non-terminal node of P has only one output arc a, that
connects e to a node that does not belong to SG;
3. Every other arc in SG must only connect nodes in SG.
Start
Change or
Abandon
Authorisation Confirm with
Buyer
Purchase itemsAbandon ? Authorised? End
Abandoned
YES
NO
Monitor
cancellation
Canceled
and-split
Cancel order
Figure 6 - Example of a process region
As Figure 3 shows, data in the PDW can be directly accessed with a commercial reporting tool
(such as Crystal Reports or Oracle Discoverer). Analysts can also access the PDW through the
BPI Cockpit (defined later in the paper), that provides specific visualization techniques to report
on business process executions.
Details on the process data warehouse are provided in [Bonifati01].
3.2 The BPI Process Mining Engine
The PDW allows a wide range of data analysis functionalities. However, it is a "passive"
component: it is up to the user to "guess" the possible causes-effect relationships among
behaviors. The PDW can then help the users in verifying whether the assumptions are correct or
not, for example by exploiting behavior correlation analysis.
The BPI Process Mining Engine (PME) allows a more "intelligent" kind of analysis, capable of
(automatically or semi-automatically) identifying the causes of a behavior. The PME achieves
this goal by mapping the behavior analysis problem to a classification problem [Berry00], where
process instances are the objects to be classified, and the classes are "have" or "have not",
respectively representing process instances that have or do not have a certain behavior. The
PME analyzes data in the PDW that describes which process had a certain behavior, i.e., specify
the classes to which objects belong. By analyzing these data, the PME derives a set of
classification rules, i.e., mappings from a condition on the process instance attributes to a class,
with the meaning that process instances whose attributes satisfy the condition belong to the
specified class. Therefore, classification rules identify the characteristics of the process
instances in each class, in terms of values of the their attributes. For each classification rule,
Secure Best Marks with AI Grader
Need help grading? Try our AI Grader for instant feedback on your assignments.
9
the classifier also provides information about the rule's accuracy, i.e., about the probability that
classifications performed with the rule are correct. Once the characteristics of the process
instances in each class have been identified, the user can have a much better understanding of
why processes have a certain behavior.
For example, analysts may want to identify the characteristics of the "expense approval"
processes that have the behavior "last more than 15 days". The PME can process data in the
warehouse and return the following classification rule: instances that involve orders for more
than 18,000$ and in which node "Authorisation" is executed by John have the behavior, with
80% accuracy. The reader is referred to [Grigori01] for more details about classification-based
behavior analysis and for experimental results.
The PME is built on top of a commercial data mining tool 2 that identifies the classification rules.
Our contribution consisted in designing and developing the components that map the behavior
analysis problem into a classification problem. The main issue to be addressed here lies in the
preparation of the data, so that the classifier can consume it to generate the rules. In
particular, we need to identify which are the process instance characteristics (the features,
using data mining terminology) that should be considered by the classifier in determining the
rules. In fact, the number of such characteristics is theoretically unlimited. For example, a
behavior may be dependent on the ratio between the duration of two nodes, or on the
combination of the resources that execute nodes 1,3, and 5, and so on. Based on many
experiments we have identified the following attributes as being the most frequently correlated
with common behaviors that users typically analyze:
− Process instance activation and completion time (decomposed in year, month, day, etc, and
with indication if it is a working day, holiday, or weekend)
− Process instance data items: Initial and final value of the process data items, plus the length
(in bytes) of each item.
− Resource that started the process instance
− Process instance duration.
In addition, for each node executions, the following attributes are considered:
− Activation and completion timestamps (decomposed as described above)
− Data items: Value of the node output data, plus the length (in bytes) of each item.
− Resource that executed the node
− Final state of the node (e.g., completed or failed)
− Node duration
− Number of activations of the node in the process instance (this attribute is only included
once per node definition).
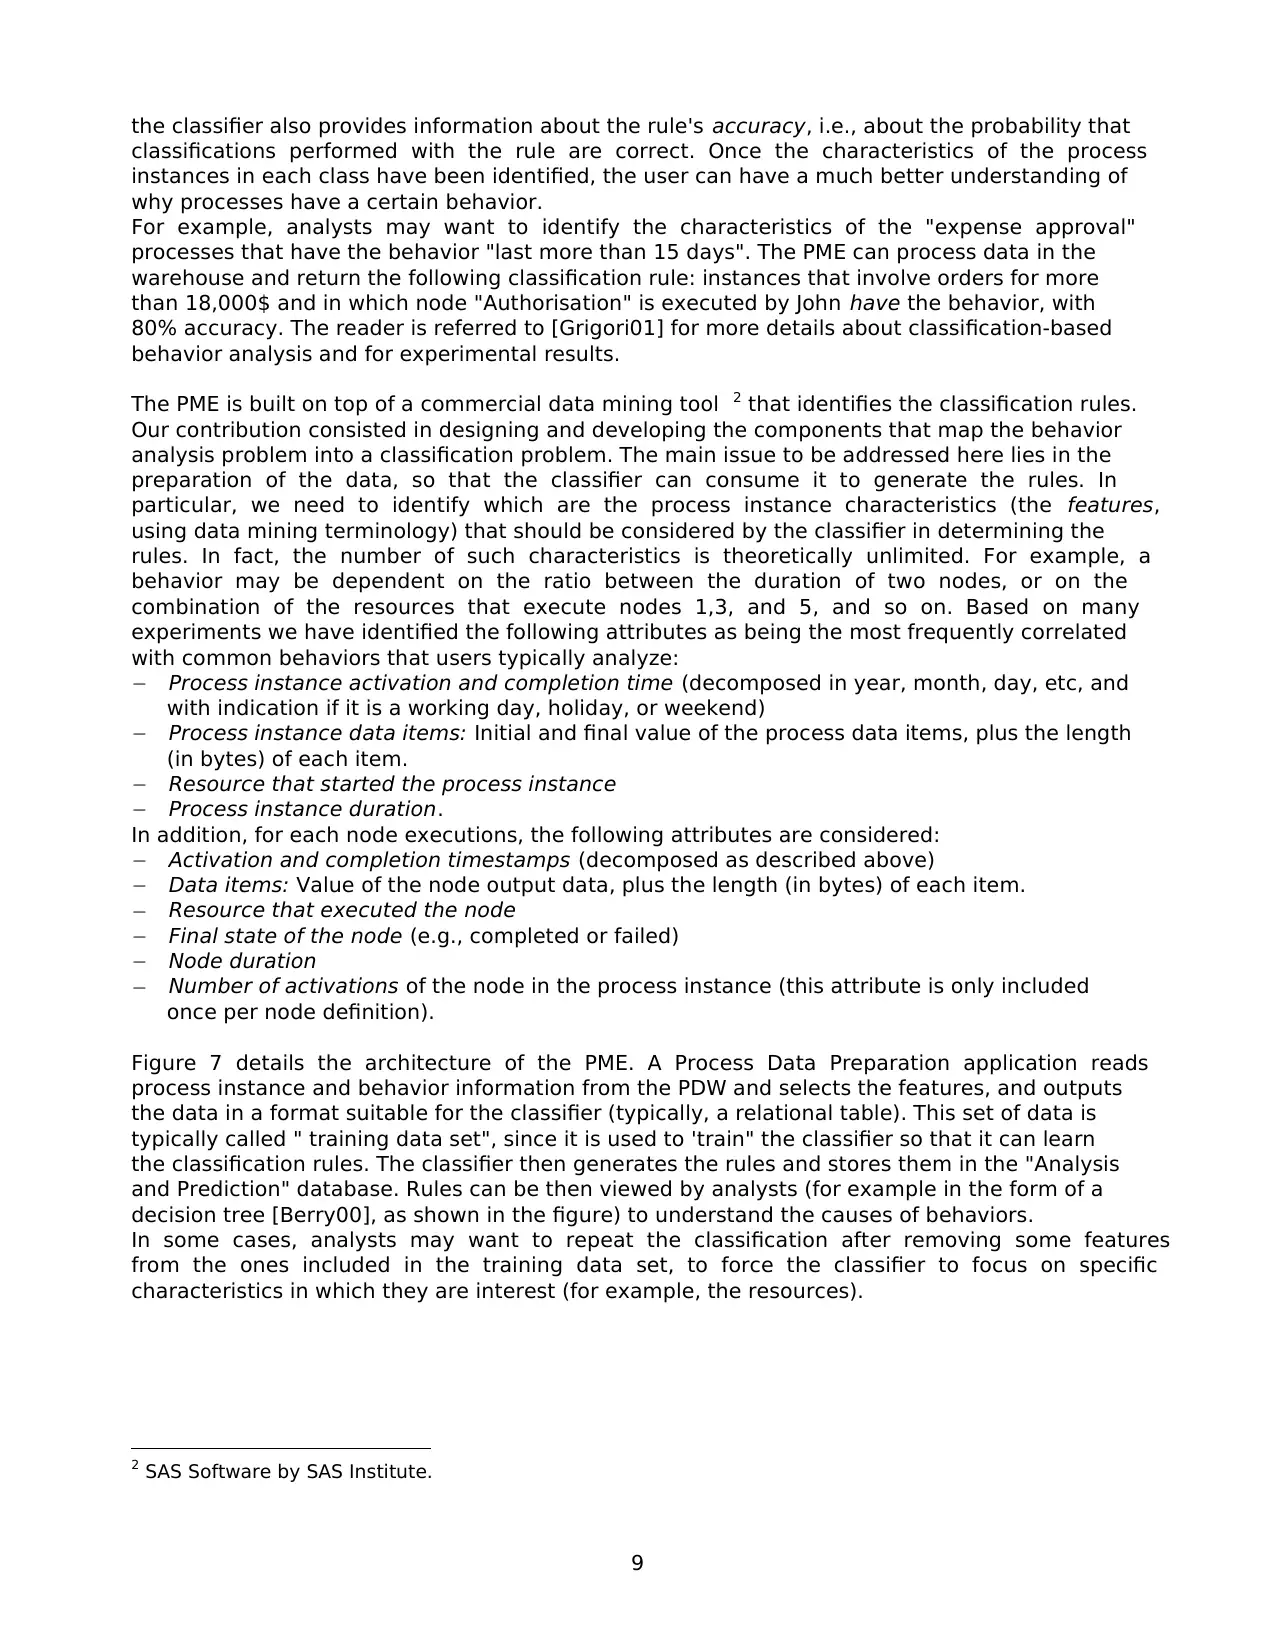
Figure 7 details the architecture of the PME. A Process Data Preparation application reads
process instance and behavior information from the PDW and selects the features, and outputs
the data in a format suitable for the classifier (typically, a relational table). This set of data is
typically called " training data set", since it is used to 'train" the classifier so that it can learn
the classification rules. The classifier then generates the rules and stores them in the "Analysis
and Prediction" database. Rules can be then viewed by analysts (for example in the form of a
decision tree [Berry00], as shown in the figure) to understand the causes of behaviors.
In some cases, analysts may want to repeat the classification after removing some features
from the ones included in the training data set, to force the classifier to focus on specific
characteristics in which they are interest (for example, the resources).
2 SAS Software by SAS Institute.
the classifier also provides information about the rule's accuracy, i.e., about the probability that
classifications performed with the rule are correct. Once the characteristics of the process
instances in each class have been identified, the user can have a much better understanding of
why processes have a certain behavior.
For example, analysts may want to identify the characteristics of the "expense approval"
processes that have the behavior "last more than 15 days". The PME can process data in the
warehouse and return the following classification rule: instances that involve orders for more
than 18,000$ and in which node "Authorisation" is executed by John have the behavior, with
80% accuracy. The reader is referred to [Grigori01] for more details about classification-based
behavior analysis and for experimental results.
The PME is built on top of a commercial data mining tool 2 that identifies the classification rules.
Our contribution consisted in designing and developing the components that map the behavior
analysis problem into a classification problem. The main issue to be addressed here lies in the
preparation of the data, so that the classifier can consume it to generate the rules. In
particular, we need to identify which are the process instance characteristics (the features,
using data mining terminology) that should be considered by the classifier in determining the
rules. In fact, the number of such characteristics is theoretically unlimited. For example, a
behavior may be dependent on the ratio between the duration of two nodes, or on the
combination of the resources that execute nodes 1,3, and 5, and so on. Based on many
experiments we have identified the following attributes as being the most frequently correlated
with common behaviors that users typically analyze:
− Process instance activation and completion time (decomposed in year, month, day, etc, and
with indication if it is a working day, holiday, or weekend)
− Process instance data items: Initial and final value of the process data items, plus the length
(in bytes) of each item.
− Resource that started the process instance
− Process instance duration.
In addition, for each node executions, the following attributes are considered:
− Activation and completion timestamps (decomposed as described above)
− Data items: Value of the node output data, plus the length (in bytes) of each item.
− Resource that executed the node
− Final state of the node (e.g., completed or failed)
− Node duration
− Number of activations of the node in the process instance (this attribute is only included
once per node definition).
Figure 7 details the architecture of the PME. A Process Data Preparation application reads
process instance and behavior information from the PDW and selects the features, and outputs
the data in a format suitable for the classifier (typically, a relational table). This set of data is
typically called " training data set", since it is used to 'train" the classifier so that it can learn
the classification rules. The classifier then generates the rules and stores them in the "Analysis
and Prediction" database. Rules can be then viewed by analysts (for example in the form of a
decision tree [Berry00], as shown in the figure) to understand the causes of behaviors.
In some cases, analysts may want to repeat the classification after removing some features
from the ones included in the training data set, to force the classifier to focus on specific
characteristics in which they are interest (for example, the resources).
2 SAS Software by SAS Institute.
10
Nu m Ex ec_ Get Ap p ro v e rDe c i s i o n
<=2 >2 An d <=6
T V
1 1 1 .9% 1 1 .4%
0 8 8 .1% 8 8 .6%
1 2 85 0 2 03 0
{Re s 1 , .. } { Re sn , .. . }
>6
Re s o u rc e _ In i t _ Get Ap p ro v e rDe c i s i o n
T V
1 0% 1 . 8 7 %
0 1 0 0 % 9 8 . 1 3%
1 0 1 5 0
0 9 1 1 5 6 0 7 6
T V
1 1 0 .1 % 8 .9%
0 8 9 .9% 9 1 .1%
1 1 21 7 8 0 2
0 1 0 94 5 72 3 3
T V
1 6 0 . 6% 60%
0 3 9 . 4 % 40%
1 1 63 3 1 07 8
0 1 0 89 7 1 8
T V
1 4 . 1 1 % 7 .6%
0 95 .8 9 % 9 2. 4 %
1 1 7 1 8
0 39 6 22 0
T V
1 7 0 % 68 .0 %
0 3 0 % 32 .0 %
1 1 6 1 6 1 0 6 0
0 6 9 3 4 9 8
0 2 1 15 0 1 5 7 90
{Sa t ,. . Th u } {Fri d a y}
T V
1 5% 8%
0 95% 92%
1 55 3 6 1 8
0 10 5 2 2 71 11
T V
1 6 1 .1 % 6 0 .0%
0 3 3 .9 % 4 0 .0%
1 6 5 2 1 8 4
0 4 3 5 1 2 2
St a rtDa y
Nu m Ex ec_ Get Ap p ro v e rDe c i s i o n
<=2 >2 An d <=6
T V
1 1 1 .9% 1 1 .4%
0 8 8 .1% 8 8 .6%
1 2 85 0 2 03 0
{Re s 1 , .. } { Re sn , .. . }
>6
Re s o u rc e _ In i t _ Get Ap p ro v e rDe c i s i o n
T V
1 0% 1 . 8 7 %
0 1 0 0 % 9 8 . 1 3%
1 0 1 5 0
0 9 1 1 5 6 0 7 6
T V
1 1 0 .1 % 8 .9%
0 8 9 .9% 9 1 .1%
1 1 21 7 8 0 2
0 1 0 94 5 72 3 3
T V
1 6 0 . 6% 60%
0 3 9 . 4 % 40%
1 1 63 3 1 07 8
0 1 0 89 7 1 8
T V
1 4 . 1 1 % 7 .6%
0 95 .8 9 % 9 2. 4 %
1 1 7 1 8
0 39 6 22 0
T V
1 7 0 % 68 .0 %
0 3 0 % 32 .0 %
1 1 6 1 6 1 0 6 0
0
Re s o u rc e _ In i t _ Get Ap p ro v e rDe c i s i o n
T V
1 0% 1 . 8 7 %
0 1 0 0 % 9 8 . 1 3%
1 0 1 5 0
0 9 1 1 5 6 0 7 6
T V
1 1 0 .1 % 8 .9%
0 8 9 .9% 9 1 .1%
1 1 21 7 8 0 2
0 1 0 94 5 72 3 3
T V
1 6 0 . 6% 60%
0 3 9 . 4 % 40%
1 1 63 3 1 07 8
0 1 0 89 7 1 8
T V
1 4 . 1 1 % 7 .6%
0 95 .8 9 % 9 2. 4 %
1 1 7 1 8
0 39 6 22 0
T V
1 7 0 % 68 .0 %
0 3 0 % 32 .0 %
1 1 6 1 6 1 0 6 0
0 6 9 3 4 9 8
0 2 1 15 0 1 5 7 90
{Sa t ,. . Th u } {Fri d a y}
T V
1 5% 8%
0 95% 92%
1 55 3 6 1 8
0 10 5 2 2 71 11
T V
1 6 1 .1 % 6 0 .0%
0 3 3 .9 % 4 0 .0%
1 6 5 2 1 8 4
0 4 3 5 1 2 2
St a rtDa y
Nu m Ex ec_ Get Ap p ro v e rDe c i s i o n
<=2 >2 An d <=6
T V
1 1 1 .9% 1 1 .4%
0 8 8 .1% 8 8 .6%
1 2 85 0 2 03 0
{Re s 1 , .. } { Re sn , .. . }
>6
Re s o u rc e _ In i t _ Get Ap p ro v e rDe c i s i o n
T V
1 0% 1 . 8 7 %
0 1 0 0 % 9 8 . 1 3%
1 0 1 5 0
0 9 1 1 5 6 0 7 6
T V
1 1 0 .1 % 8 .9%
0 8 9 .9% 9 1 .1%
1 1 21 7 8 0 2
0 1 0 94 5 72 3 3
T V
1 6 0 . 6% 60%
0 3 9 . 4 % 40%
1 1 63 3 1 07 8
0 1 0 89 7 1 8
T V
1 4 . 1 1 % 7 .6%
0 95 .8 9 % 9 2. 4 %
1 1 7 1 8
0 39 6 22 0
T V
1 7 0 % 68 .0 %
0 3 0 % 32 .0 %
1 1 6 1 6 1 0 6 0
0 6 9 3 4 9 8
0 2 1 15 0 1 5 7 90
{Sa t ,. . Th u } {Fri d a y}
T V
1 5% 8%
0 95% 92%
1 55 3 6 1 8
0 10 5 2 2 71 11
T V
1 6 1 .1 % 6 0 .0%
0 3 3 .9 % 4 0 .0%
1 6 5 2 1 8 4
0 4 3 5 1 2 2
St a rtDa y
T V
1 5% 8%
0 95% 92%
1 55 3 6 1 8
0 10 5 2 2 71 11
T V
1 6 1 .1 % 6 0 .0%
0 3 3 .9 % 4 0 .0%
1 6 5 2 1 8 4
0 4 3 5 1 2 2
St a rtDa y
Nu m Ex ec_ Get Ap p ro v e rDe c i s i o n
<=2 >2 An d <=6
T V
1 1 1 .9% 1 1 .4%
0 8 8 .1% 8 8 .6%
1 2 85 0 2 03 0
{Re s 1 , .. } { Re sn , .. . }
>6
Re s o u rc e _ In i t _ Get Ap p ro v e rDe c i s i o n
T V
1 0% 1 . 8 7 %
0 1 0 0 % 9 8 . 1 3%
1 0 1 5 0
0 9 1 1 5 6 0 7 6
T V
1 1 0 .1 % 8 .9%
0 8 9 .9% 9 1 .1%
1 1 21 7 8 0 2
0 1 0 94 5 72 3 3
T V
1 6 0 . 6% 60%
0 3 9 . 4 % 40%
1 1 63 3 1 07 8
0 1 0 89 7 1 8
T V
1 4 . 1 1 % 7 .6%
0 95 .8 9 % 9 2. 4 %
1 1 7 1 8
0 39 6 22 0
T V
1 7 0 % 68 .0 %
0 3 0 % 32 .0 %
1 1 6 1 6 1 0 6 0
0 6 9 3 4 9 8
0 2 1 15 0 1 5 7 90
{Sa t ,. . Th u } {Fri d a y}
T V
1 5% 8%
0 95% 92%
1 55 3 6 1 8
0 10 5 2 2 71 11
T V
1 6 1 .1 % 6 0 .0%
0 3 3 .9 % 4 0 .0%
1 6 5 2 1 8 4
0 4 3 5 1 2 2
St a rtDa y
T V
1 6 1 .1 % 6 0 .0%
0 3 3 .9 % 4 0 .0%
1 6 5 2 1 8 4
0 4 3 5 1 2 2
St a rtDa y
Nu m Ex ec_ Get Ap p ro v e rDe c i s i o n
<=2 >2 An d <=6
T V
1 1 1 .9% 1 1 .4%
0 8 8 .1% 8 8 .6%
1 2 85 0 2 03 0
{Re s 1 , .. } { Re sn , .. . }
>6
Re s o u rc e _ In i t _ Get Ap p ro v e rDe c i s i o n
T V
1 0% 1 . 8 7 %
0 1 0 0 % 9 8 . 1 3%
1 0 1 5 0
0 9 1 1 5 6 0 7 6
T V
1 1 0 .1 % 8 .9%
0 8 9 .9% 9 1 .1%
1 1 21 7 8 0 2
0 1 0 94 5 72 3 3
T V
1 6 0 . 6% 60%
0 3 9 . 4 % 40%
1 1 63 3 1 07 8
0 1 0 89 7 1 8
T V
1 4 . 1 1 % 7 .6%
0 95 .8 9 % 9 2. 4 %
1 1 7 1 8
0 39 6 22 0
T V
1 7 0 % 68 .0 %
0 3 0 % 32 .0 %
1 1 6 1 6 1 0 6 0
0
Re s o u rc e _ In i t _ Get Ap p ro v e rDe c i s i o n
T V
1 0% 1 . 8 7 %
0 1 0 0 % 9 8 . 1 3%
1 0 1 5 0
0 9 1 1 5 6 0 7 6
T V
1 1 0 .1 % 8 .9%
0 8 9 .9% 9 1 .1%
1 1 21 7 8 0 2
0 1 0 94 5 72 3 3
T V
1 6 0 . 6% 60%
0 3 9 . 4 % 40%
1 1 63 3 1 07 8
0 1 0 89 7 1 8
T V
1 4 . 1 1 % 7 .6%
0 95 .8 9 % 9 2. 4 %
1 1 7 1 8
0 39 6 22 0
T V
1 7 0 % 68 .0 %
0 3 0 % 32 .0 %
1 1 6 1 6 1 0 6 0
0 6 9 3 4 9 8
0 2 1 15 0 1 5 7 90
{Sa t ,. . Th u } {Fri d a y}
T V
1 5% 8%
0 95% 92%
1 55 3 6 1 8
0 10 5 2 2 71 11
T V
1 6 1 .1 % 6 0 .0%
0 3 3 .9 % 4 0 .0%
1 6 5 2 1 8 4
0 4 3 5 1 2 2
St a rtDa y
InterpretationClassification rules
Causes of exception
NodeFacts
ID
ProcessDe finitionID
ProcessInstanceID
ServiceDef initionID
NodeDefinitionID
TimeID
ResourceID
WorklistID
ActivationNumber
NewState
Resources
Time
Service Definitions
ProcessDefinitions NodeDefinitions
ProcessInstance
ProcessFacts
ID
ProcessDefinitionID
ProcessInstanceID
TimeID
ResourceID
NewState
Re sources
Time
ProcessDefinitions
ProcessInstance
Worklists
Analysis and
Predictions
Classifier
Training
data set
PDW
Process Data
Preparation
Figure 7 - Architecture of the Process Mining Engine
Besides allowing behavior analysis, the PME can also derive prediction rules, used by other BPI
components (and specifically by the cockpit) to speculate about the possible occurrence of a
behavior in a running process instance, and possibly to take corrective actions. The procedure
for obtaining prediction rules is similar to the one for deriving classification rules, and is not
described here. We refer again the interested reader to [Grigori01].
3.3 The BPI Cockpit
The main goal of the Business Process Cockpit is to enable business users to perform business-
level quality analysis, monitoring, and management of business processes. Targeting business
users implies keeping the user interface as simple and immediate as possible, without limiting
the flexibility and the functionalities provided by the tool. Providing business-level analysis and
monitoring involves instead the development of techniques to enable users to define, monitor,
and measure business quality metrics. The Business Process Cockpit (BPC) provides three main
functionalities:
− It displays a variety of reports to business and IT users. Unlike general-purpose reporting
tools, the BPC is aware of the semantics of the data in the PDW, and includes visualization
concepts and techniques specifically designed to display business process execution data.
In addition, the BPC can be used to configure the PDW, for example to define behaviors or
taxonomies. Both reporting and PDW configuration can be performed in an intuitive
manner, without requiring any code.
− It monitors processes, services, resources, and other process-related entities, and inform
users of actual or foreseen quality degradation. BPC can also send notifications to users on
the medium of their choice.
− It manages running processes by tuning process and system configuration parameters
(such as the process priority) and by notifying events to processes.
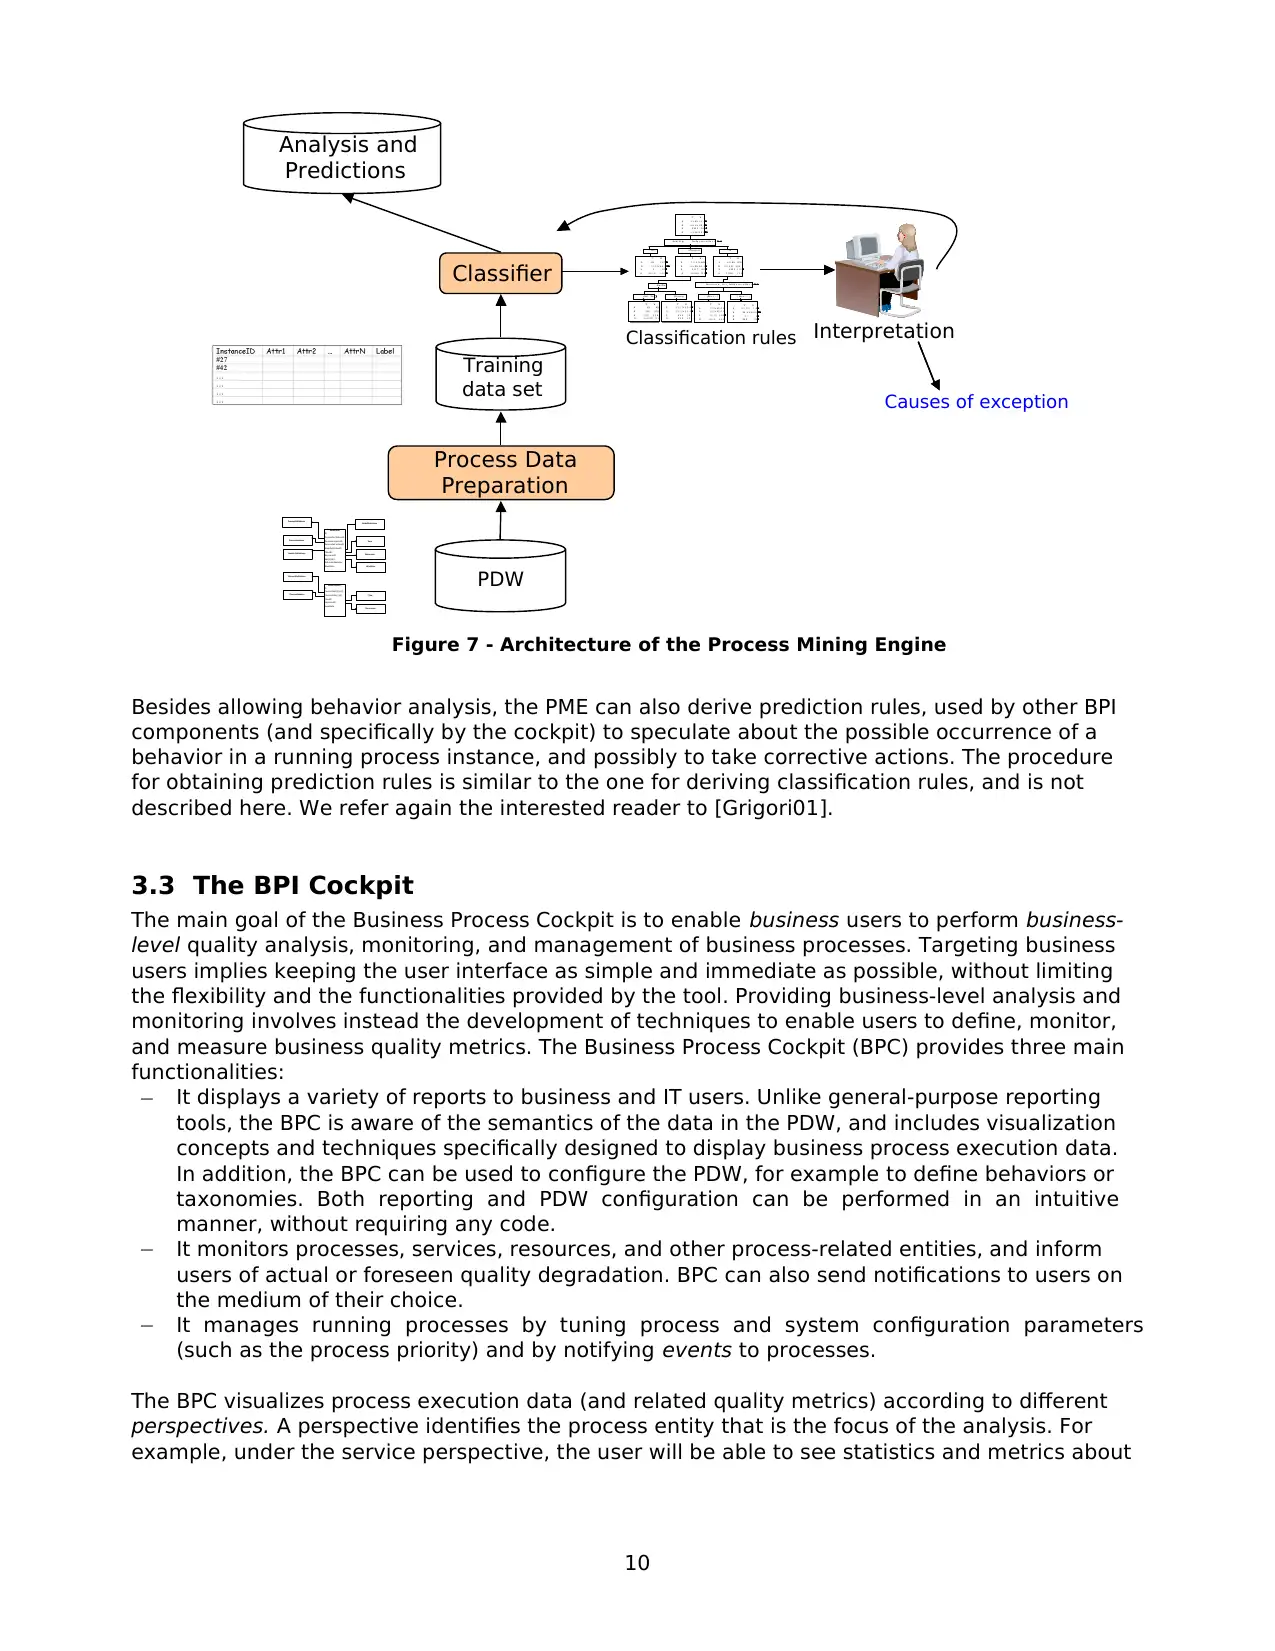
The BPC visualizes process execution data (and related quality metrics) according to different
perspectives. A perspective identifies the process entity that is the focus of the analysis. For
example, under the service perspective, the user will be able to see statistics and metrics about
Nu m Ex ec_ Get Ap p ro v e rDe c i s i o n
<=2 >2 An d <=6
T V
1 1 1 .9% 1 1 .4%
0 8 8 .1% 8 8 .6%
1 2 85 0 2 03 0
{Re s 1 , .. } { Re sn , .. . }
>6
Re s o u rc e _ In i t _ Get Ap p ro v e rDe c i s i o n
T V
1 0% 1 . 8 7 %
0 1 0 0 % 9 8 . 1 3%
1 0 1 5 0
0 9 1 1 5 6 0 7 6
T V
1 1 0 .1 % 8 .9%
0 8 9 .9% 9 1 .1%
1 1 21 7 8 0 2
0 1 0 94 5 72 3 3
T V
1 6 0 . 6% 60%
0 3 9 . 4 % 40%
1 1 63 3 1 07 8
0 1 0 89 7 1 8
T V
1 4 . 1 1 % 7 .6%
0 95 .8 9 % 9 2. 4 %
1 1 7 1 8
0 39 6 22 0
T V
1 7 0 % 68 .0 %
0 3 0 % 32 .0 %
1 1 6 1 6 1 0 6 0
0 6 9 3 4 9 8
0 2 1 15 0 1 5 7 90
{Sa t ,. . Th u } {Fri d a y}
T V
1 5% 8%
0 95% 92%
1 55 3 6 1 8
0 10 5 2 2 71 11
T V
1 6 1 .1 % 6 0 .0%
0 3 3 .9 % 4 0 .0%
1 6 5 2 1 8 4
0 4 3 5 1 2 2
St a rtDa y
Nu m Ex ec_ Get Ap p ro v e rDe c i s i o n
<=2 >2 An d <=6
T V
1 1 1 .9% 1 1 .4%
0 8 8 .1% 8 8 .6%
1 2 85 0 2 03 0
{Re s 1 , .. } { Re sn , .. . }
>6
Re s o u rc e _ In i t _ Get Ap p ro v e rDe c i s i o n
T V
1 0% 1 . 8 7 %
0 1 0 0 % 9 8 . 1 3%
1 0 1 5 0
0 9 1 1 5 6 0 7 6
T V
1 1 0 .1 % 8 .9%
0 8 9 .9% 9 1 .1%
1 1 21 7 8 0 2
0 1 0 94 5 72 3 3
T V
1 6 0 . 6% 60%
0 3 9 . 4 % 40%
1 1 63 3 1 07 8
0 1 0 89 7 1 8
T V
1 4 . 1 1 % 7 .6%
0 95 .8 9 % 9 2. 4 %
1 1 7 1 8
0 39 6 22 0
T V
1 7 0 % 68 .0 %
0 3 0 % 32 .0 %
1 1 6 1 6 1 0 6 0
0
Re s o u rc e _ In i t _ Get Ap p ro v e rDe c i s i o n
T V
1 0% 1 . 8 7 %
0 1 0 0 % 9 8 . 1 3%
1 0 1 5 0
0 9 1 1 5 6 0 7 6
T V
1 1 0 .1 % 8 .9%
0 8 9 .9% 9 1 .1%
1 1 21 7 8 0 2
0 1 0 94 5 72 3 3
T V
1 6 0 . 6% 60%
0 3 9 . 4 % 40%
1 1 63 3 1 07 8
0 1 0 89 7 1 8
T V
1 4 . 1 1 % 7 .6%
0 95 .8 9 % 9 2. 4 %
1 1 7 1 8
0 39 6 22 0
T V
1 7 0 % 68 .0 %
0 3 0 % 32 .0 %
1 1 6 1 6 1 0 6 0
0 6 9 3 4 9 8
0 2 1 15 0 1 5 7 90
{Sa t ,. . Th u } {Fri d a y}
T V
1 5% 8%
0 95% 92%
1 55 3 6 1 8
0 10 5 2 2 71 11
T V
1 6 1 .1 % 6 0 .0%
0 3 3 .9 % 4 0 .0%
1 6 5 2 1 8 4
0 4 3 5 1 2 2
St a rtDa y
Nu m Ex ec_ Get Ap p ro v e rDe c i s i o n
<=2 >2 An d <=6
T V
1 1 1 .9% 1 1 .4%
0 8 8 .1% 8 8 .6%
1 2 85 0 2 03 0
{Re s 1 , .. } { Re sn , .. . }
>6
Re s o u rc e _ In i t _ Get Ap p ro v e rDe c i s i o n
T V
1 0% 1 . 8 7 %
0 1 0 0 % 9 8 . 1 3%
1 0 1 5 0
0 9 1 1 5 6 0 7 6
T V
1 1 0 .1 % 8 .9%
0 8 9 .9% 9 1 .1%
1 1 21 7 8 0 2
0 1 0 94 5 72 3 3
T V
1 6 0 . 6% 60%
0 3 9 . 4 % 40%
1 1 63 3 1 07 8
0 1 0 89 7 1 8
T V
1 4 . 1 1 % 7 .6%
0 95 .8 9 % 9 2. 4 %
1 1 7 1 8
0 39 6 22 0
T V
1 7 0 % 68 .0 %
0 3 0 % 32 .0 %
1 1 6 1 6 1 0 6 0
0 6 9 3 4 9 8
0 2 1 15 0 1 5 7 90
{Sa t ,. . Th u } {Fri d a y}
T V
1 5% 8%
0 95% 92%
1 55 3 6 1 8
0 10 5 2 2 71 11
T V
1 6 1 .1 % 6 0 .0%
0 3 3 .9 % 4 0 .0%
1 6 5 2 1 8 4
0 4 3 5 1 2 2
St a rtDa y
T V
1 5% 8%
0 95% 92%
1 55 3 6 1 8
0 10 5 2 2 71 11
T V
1 6 1 .1 % 6 0 .0%
0 3 3 .9 % 4 0 .0%
1 6 5 2 1 8 4
0 4 3 5 1 2 2
St a rtDa y
Nu m Ex ec_ Get Ap p ro v e rDe c i s i o n
<=2 >2 An d <=6
T V
1 1 1 .9% 1 1 .4%
0 8 8 .1% 8 8 .6%
1 2 85 0 2 03 0
{Re s 1 , .. } { Re sn , .. . }
>6
Re s o u rc e _ In i t _ Get Ap p ro v e rDe c i s i o n
T V
1 0% 1 . 8 7 %
0 1 0 0 % 9 8 . 1 3%
1 0 1 5 0
0 9 1 1 5 6 0 7 6
T V
1 1 0 .1 % 8 .9%
0 8 9 .9% 9 1 .1%
1 1 21 7 8 0 2
0 1 0 94 5 72 3 3
T V
1 6 0 . 6% 60%
0 3 9 . 4 % 40%
1 1 63 3 1 07 8
0 1 0 89 7 1 8
T V
1 4 . 1 1 % 7 .6%
0 95 .8 9 % 9 2. 4 %
1 1 7 1 8
0 39 6 22 0
T V
1 7 0 % 68 .0 %
0 3 0 % 32 .0 %
1 1 6 1 6 1 0 6 0
0 6 9 3 4 9 8
0 2 1 15 0 1 5 7 90
{Sa t ,. . Th u } {Fri d a y}
T V
1 5% 8%
0 95% 92%
1 55 3 6 1 8
0 10 5 2 2 71 11
T V
1 6 1 .1 % 6 0 .0%
0 3 3 .9 % 4 0 .0%
1 6 5 2 1 8 4
0 4 3 5 1 2 2
St a rtDa y
T V
1 6 1 .1 % 6 0 .0%
0 3 3 .9 % 4 0 .0%
1 6 5 2 1 8 4
0 4 3 5 1 2 2
St a rtDa y
Nu m Ex ec_ Get Ap p ro v e rDe c i s i o n
<=2 >2 An d <=6
T V
1 1 1 .9% 1 1 .4%
0 8 8 .1% 8 8 .6%
1 2 85 0 2 03 0
{Re s 1 , .. } { Re sn , .. . }
>6
Re s o u rc e _ In i t _ Get Ap p ro v e rDe c i s i o n
T V
1 0% 1 . 8 7 %
0 1 0 0 % 9 8 . 1 3%
1 0 1 5 0
0 9 1 1 5 6 0 7 6
T V
1 1 0 .1 % 8 .9%
0 8 9 .9% 9 1 .1%
1 1 21 7 8 0 2
0 1 0 94 5 72 3 3
T V
1 6 0 . 6% 60%
0 3 9 . 4 % 40%
1 1 63 3 1 07 8
0 1 0 89 7 1 8
T V
1 4 . 1 1 % 7 .6%
0 95 .8 9 % 9 2. 4 %
1 1 7 1 8
0 39 6 22 0
T V
1 7 0 % 68 .0 %
0 3 0 % 32 .0 %
1 1 6 1 6 1 0 6 0
0
Re s o u rc e _ In i t _ Get Ap p ro v e rDe c i s i o n
T V
1 0% 1 . 8 7 %
0 1 0 0 % 9 8 . 1 3%
1 0 1 5 0
0 9 1 1 5 6 0 7 6
T V
1 1 0 .1 % 8 .9%
0 8 9 .9% 9 1 .1%
1 1 21 7 8 0 2
0 1 0 94 5 72 3 3
T V
1 6 0 . 6% 60%
0 3 9 . 4 % 40%
1 1 63 3 1 07 8
0 1 0 89 7 1 8
T V
1 4 . 1 1 % 7 .6%
0 95 .8 9 % 9 2. 4 %
1 1 7 1 8
0 39 6 22 0
T V
1 7 0 % 68 .0 %
0 3 0 % 32 .0 %
1 1 6 1 6 1 0 6 0
0 6 9 3 4 9 8
0 2 1 15 0 1 5 7 90
{Sa t ,. . Th u } {Fri d a y}
T V
1 5% 8%
0 95% 92%
1 55 3 6 1 8
0 10 5 2 2 71 11
T V
1 6 1 .1 % 6 0 .0%
0 3 3 .9 % 4 0 .0%
1 6 5 2 1 8 4
0 4 3 5 1 2 2
St a rtDa y
InterpretationClassification rules
Causes of exception
NodeFacts
ID
ProcessDe finitionID
ProcessInstanceID
ServiceDef initionID
NodeDefinitionID
TimeID
ResourceID
WorklistID
ActivationNumber
NewState
Resources
Time
Service Definitions
ProcessDefinitions NodeDefinitions
ProcessInstance
ProcessFacts
ID
ProcessDefinitionID
ProcessInstanceID
TimeID
ResourceID
NewState
Re sources
Time
ProcessDefinitions
ProcessInstance
Worklists
Analysis and
Predictions
Classifier
Training
data set
PDW
Process Data
Preparation
Figure 7 - Architecture of the Process Mining Engine
Besides allowing behavior analysis, the PME can also derive prediction rules, used by other BPI
components (and specifically by the cockpit) to speculate about the possible occurrence of a
behavior in a running process instance, and possibly to take corrective actions. The procedure
for obtaining prediction rules is similar to the one for deriving classification rules, and is not
described here. We refer again the interested reader to [Grigori01].
3.3 The BPI Cockpit
The main goal of the Business Process Cockpit is to enable business users to perform business-
level quality analysis, monitoring, and management of business processes. Targeting business
users implies keeping the user interface as simple and immediate as possible, without limiting
the flexibility and the functionalities provided by the tool. Providing business-level analysis and
monitoring involves instead the development of techniques to enable users to define, monitor,
and measure business quality metrics. The Business Process Cockpit (BPC) provides three main
functionalities:
− It displays a variety of reports to business and IT users. Unlike general-purpose reporting
tools, the BPC is aware of the semantics of the data in the PDW, and includes visualization
concepts and techniques specifically designed to display business process execution data.
In addition, the BPC can be used to configure the PDW, for example to define behaviors or
taxonomies. Both reporting and PDW configuration can be performed in an intuitive
manner, without requiring any code.
− It monitors processes, services, resources, and other process-related entities, and inform
users of actual or foreseen quality degradation. BPC can also send notifications to users on
the medium of their choice.
− It manages running processes by tuning process and system configuration parameters
(such as the process priority) and by notifying events to processes.
The BPC visualizes process execution data (and related quality metrics) according to different
perspectives. A perspective identifies the process entity that is the focus of the analysis. For
example, under the service perspective, the user will be able to see statistics and metrics about
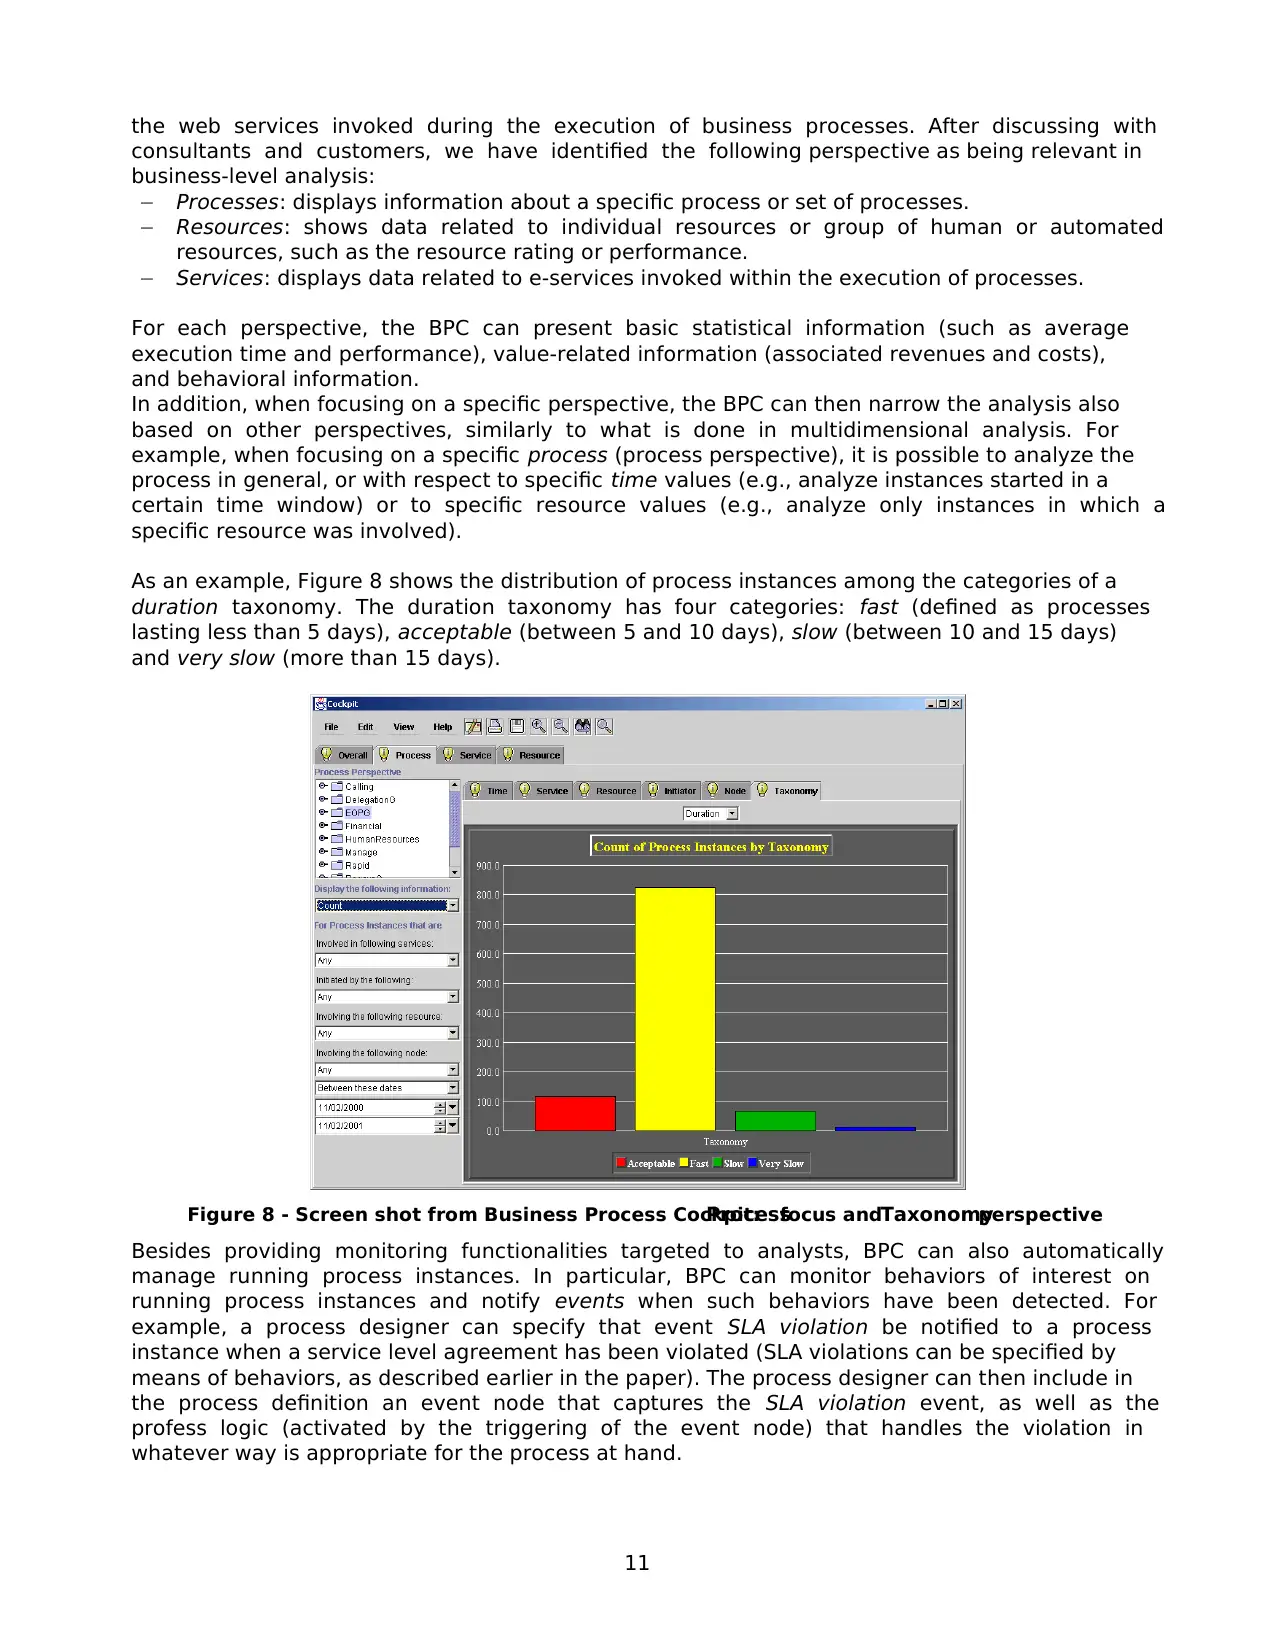
11
the web services invoked during the execution of business processes. After discussing with
consultants and customers, we have identified the following perspective as being relevant in
business-level analysis:
− Processes: displays information about a specific process or set of processes.
− Resources: shows data related to individual resources or group of human or automated
resources, such as the resource rating or performance.
− Services: displays data related to e-services invoked within the execution of processes.
For each perspective, the BPC can present basic statistical information (such as average
execution time and performance), value-related information (associated revenues and costs),
and behavioral information.
In addition, when focusing on a specific perspective, the BPC can then narrow the analysis also
based on other perspectives, similarly to what is done in multidimensional analysis. For
example, when focusing on a specific process (process perspective), it is possible to analyze the
process in general, or with respect to specific time values (e.g., analyze instances started in a
certain time window) or to specific resource values (e.g., analyze only instances in which a
specific resource was involved).
As an example, Figure 8 shows the distribution of process instances among the categories of a
duration taxonomy. The duration taxonomy has four categories: fast (defined as processes
lasting less than 5 days), acceptable (between 5 and 10 days), slow (between 10 and 15 days)
and very slow (more than 15 days).
Figure 8 - Screen shot from Business Process Cockpit:Processfocus andTaxonomyperspective
Besides providing monitoring functionalities targeted to analysts, BPC can also automatically
manage running process instances. In particular, BPC can monitor behaviors of interest on
running process instances and notify events when such behaviors have been detected. For
example, a process designer can specify that event SLA violation be notified to a process
instance when a service level agreement has been violated (SLA violations can be specified by
means of behaviors, as described earlier in the paper). The process designer can then include in
the process definition an event node that captures the SLA violation event, as well as the
profess logic (activated by the triggering of the event node) that handles the violation in
whatever way is appropriate for the process at hand.
Paraphrase This Document
Need a fresh take? Get an instant paraphrase of this document with our AI Paraphraser
12
Note therefore hat the role of the BPC is limited to allowing users to define conditions of
interest, and to detecting and notifying the occurrence of such conditions to the appropriate
process instance. The BPC does not provide features to specify how the process instance should
react to handle the detected condition, as this task is assumed to be part of the business
process logic, and is therefore specified as part of the business process definition.
4 References
[Berry00] M. Berry and G. Linoff. Mastering Data Mining. Wiley. 2000.
[Bonifati01] A. Bonifati, F. Casati, U. Dayal, M.C. Shan. Warehousing Workflow Data: Challenges and
Opportunities. Procs. of VLDB'01. Rome, Italy. Sept. 2001
[Grigori01] D. Grigori, F. Casati, U. Dayal, M.C. Shan. Improving Business Process Quality through
Exception Understanding, Prediction, and Prevention. Procs. of VLDB'01. Rome, Italy. Sept. 2001
[HPPM-PD] Hewlett-Packard. HP Changengine Process Design Guide. Edition 4.4. 2000
[HPPM-TR] Hewlett-Packard. HP Changengine Technical Reference Guide. Edition 4.4. 2000
[Leymann00] F. Leymann, D. Roller: Production Workflow. Prentice-Hall, 2000.
[Sayal01] M. Sayal, F. Casati, U.Dayal, M. Shan. Business Process Cockpit. HPL technical report,
2001.
View publication statsView publication stats
1 out of 14
Your All-in-One AI-Powered Toolkit for Academic Success.
+13062052269
info@desklib.com
Available 24*7 on WhatsApp / Email
![[object Object]](/_next/static/media/star-bottom.7253800d.svg)
Unlock your academic potential
© 2024 | Zucol Services PVT LTD | All rights reserved.