Image Processing Project: Automated Jelly Bean Quality Control System
VerifiedAdded on 2022/09/12
|10
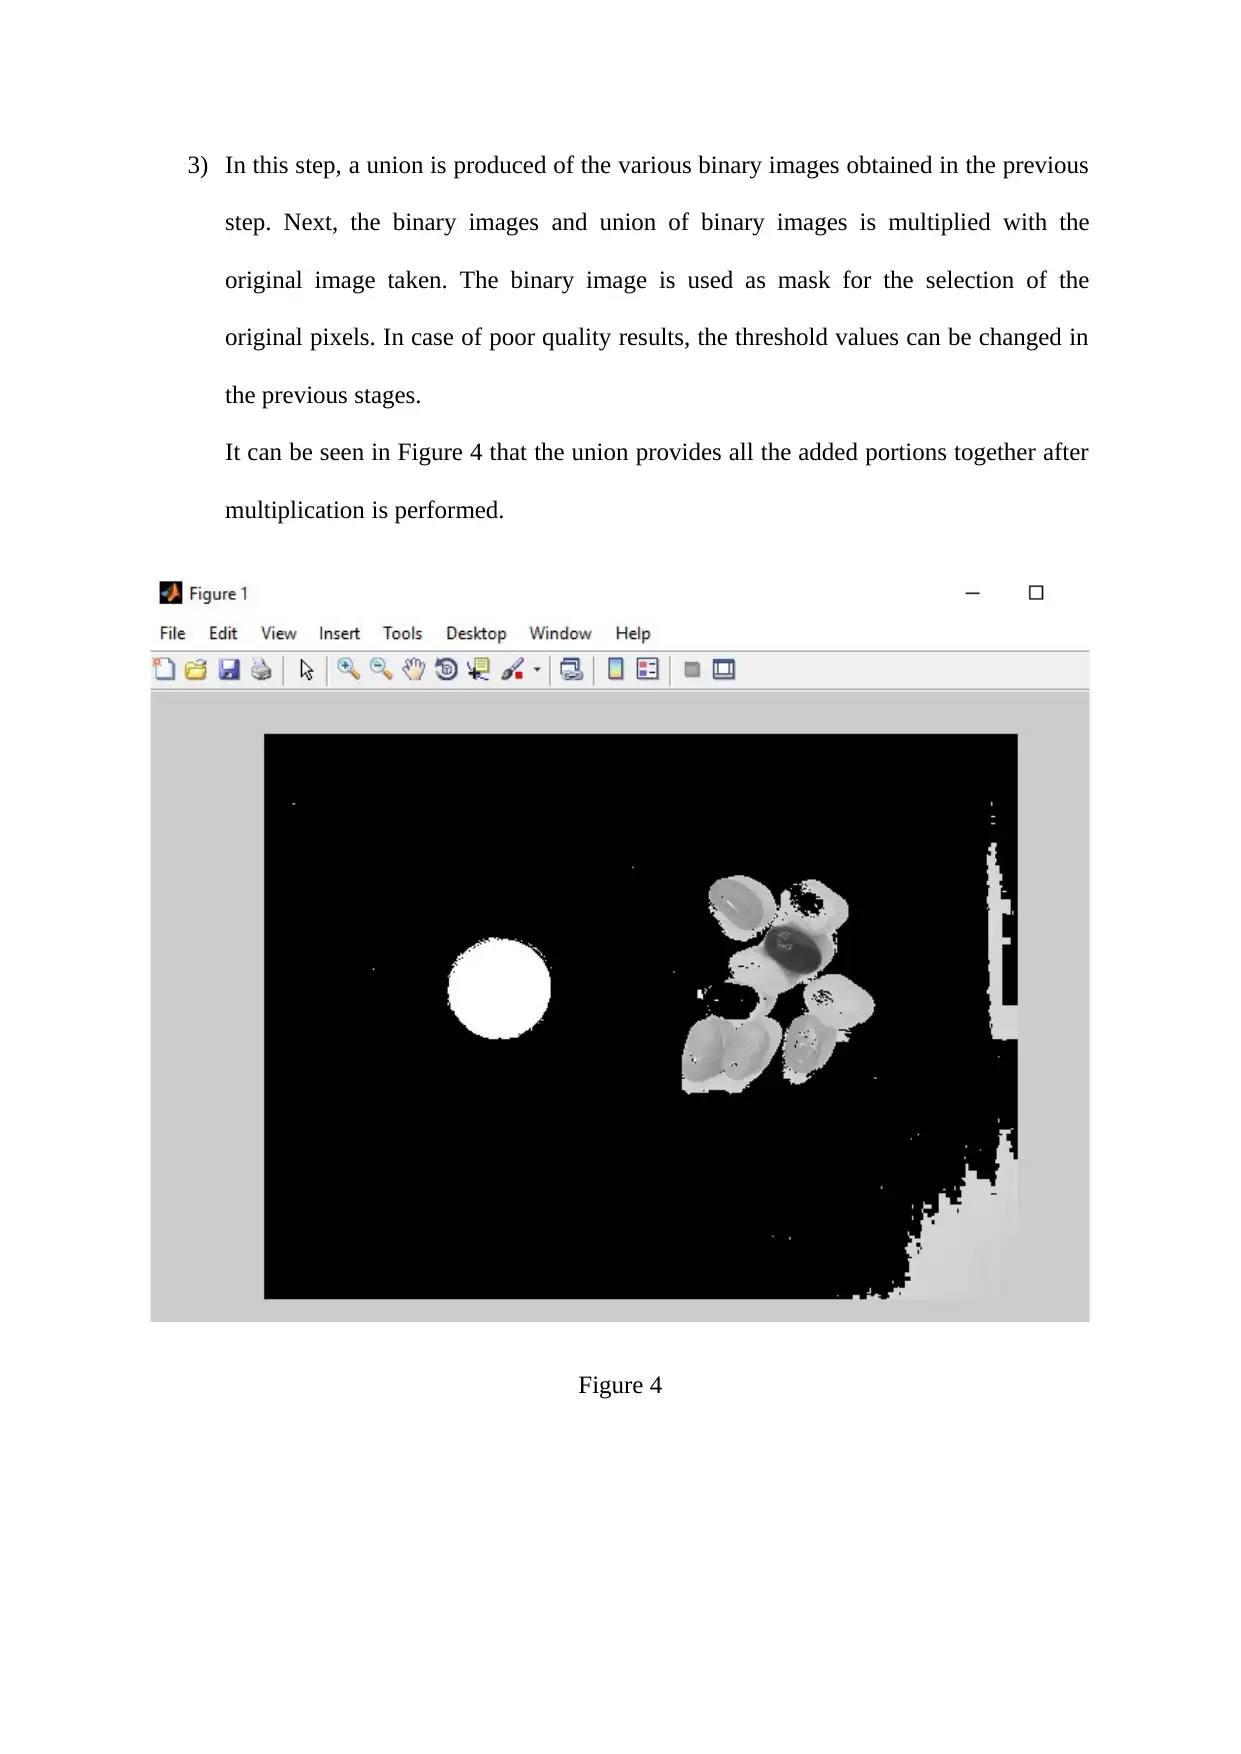
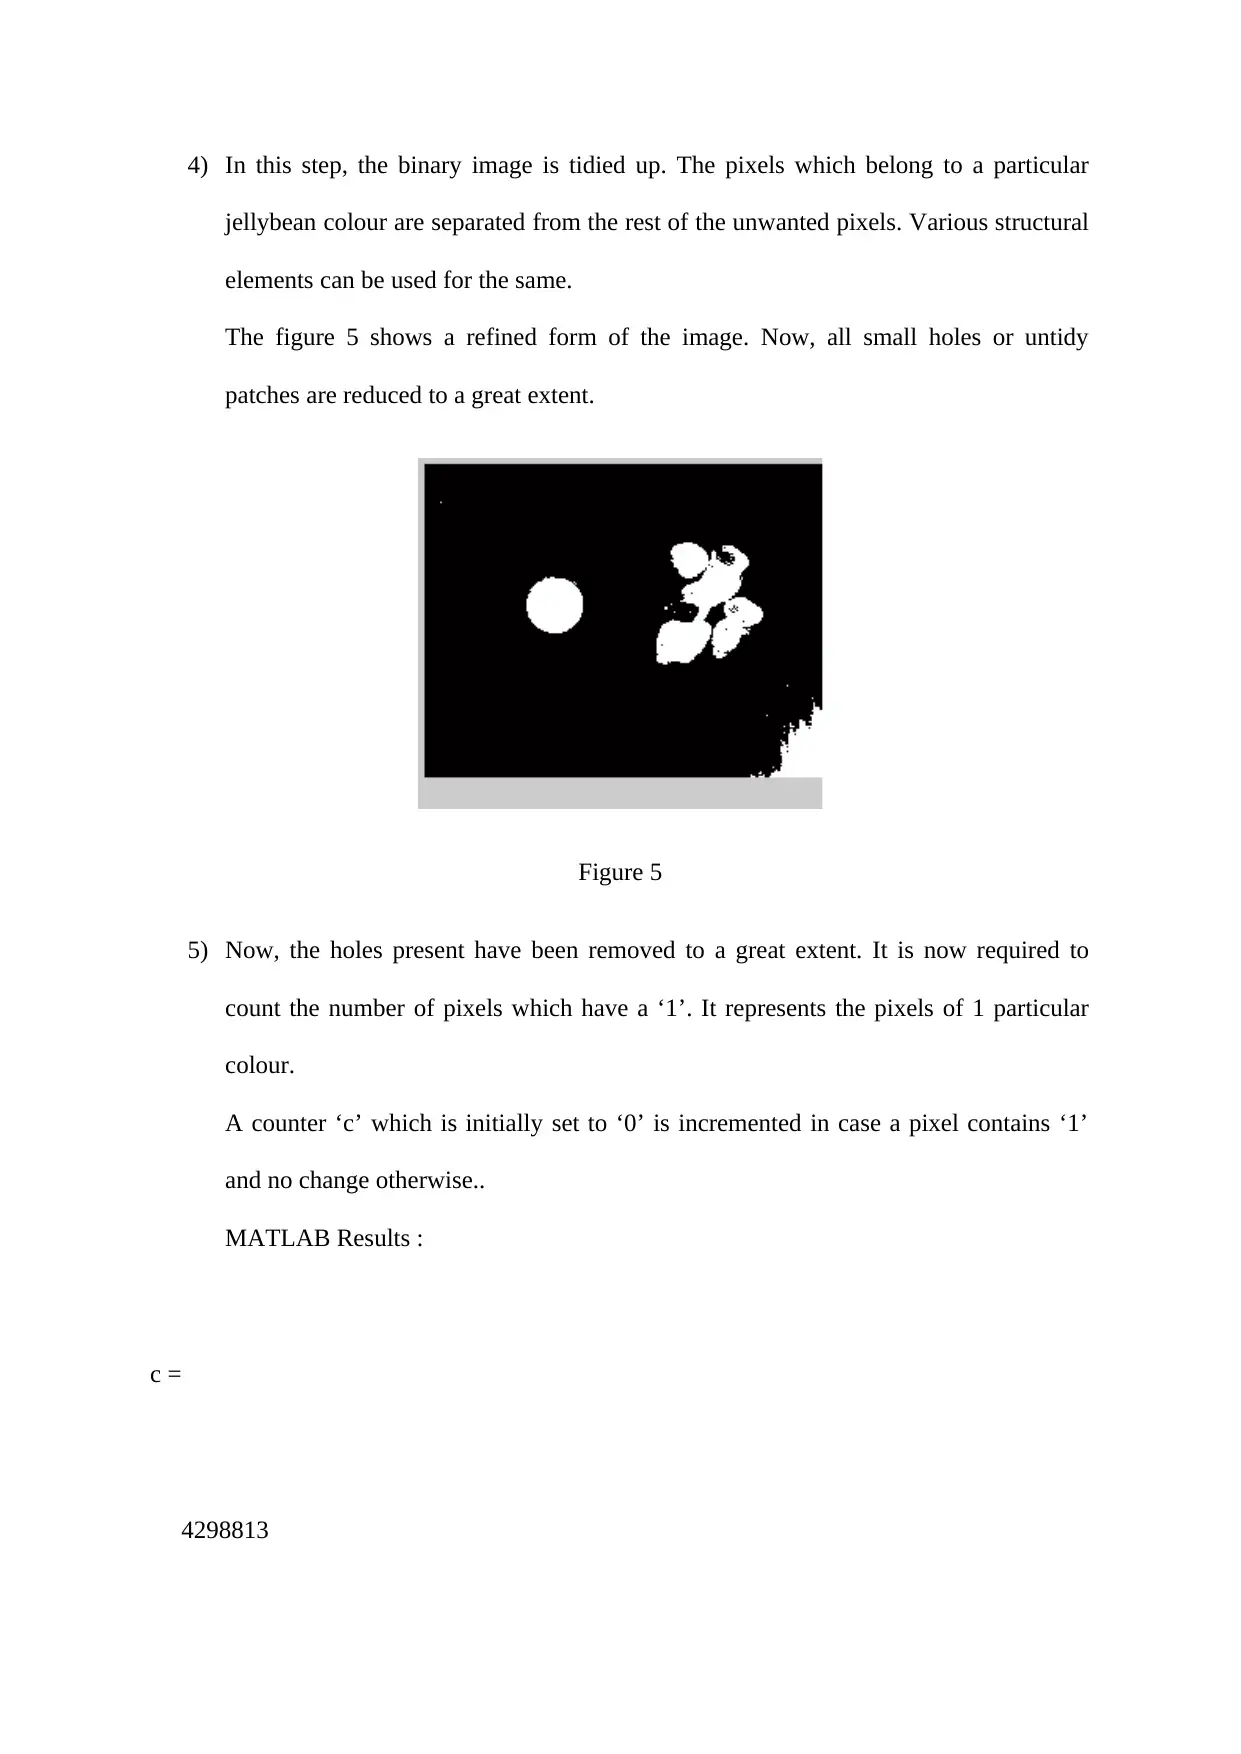
|1041
|17
Project
AI Summary
This project details the development of image processing software designed for automated quality control within a confectionary manufacturing setting. The software, built using Matlab, processes images of jelly beans to assess their quality prior to packaging or rejection. The process begins with importing an image and displaying normalized RGB histograms. Histogram stretching is then performed, and the RMS contrast is calculated before and after the operation to assess image enhancement. The software then employs image thresholding to generate binary images for each jelly bean color, followed by combining these images and applying them as masks to the original image. Further steps involve cleaning up the binary images to remove noise, counting pixels of specific colors, determining the area of each bean, and calculating the Euclidean distance from the image center. Finally, the software counts beans of each color and extracts individual jelly beans, rotating them for length measurement. The goal is to provide a comprehensive system that aids in various aspects of the manufacturing process, from initial image analysis to the final assessment of bean characteristics, ensuring adherence to quality standards.


1 out of 10
Your All-in-One AI-Powered Toolkit for Academic Success.
+13062052269
info@desklib.com
Available 24*7 on WhatsApp / Email
![[object Object]](/_next/static/media/star-bottom.7253800d.svg)
Copyright © 2020–2026 A2Z Services. All Rights Reserved. Developed and managed by ZUCOL.