Econometrics 11: Regression Analysis of Tech Stocks and Market Data
VerifiedAdded on 2021/05/27
|11
|705
|213
Report
AI Summary
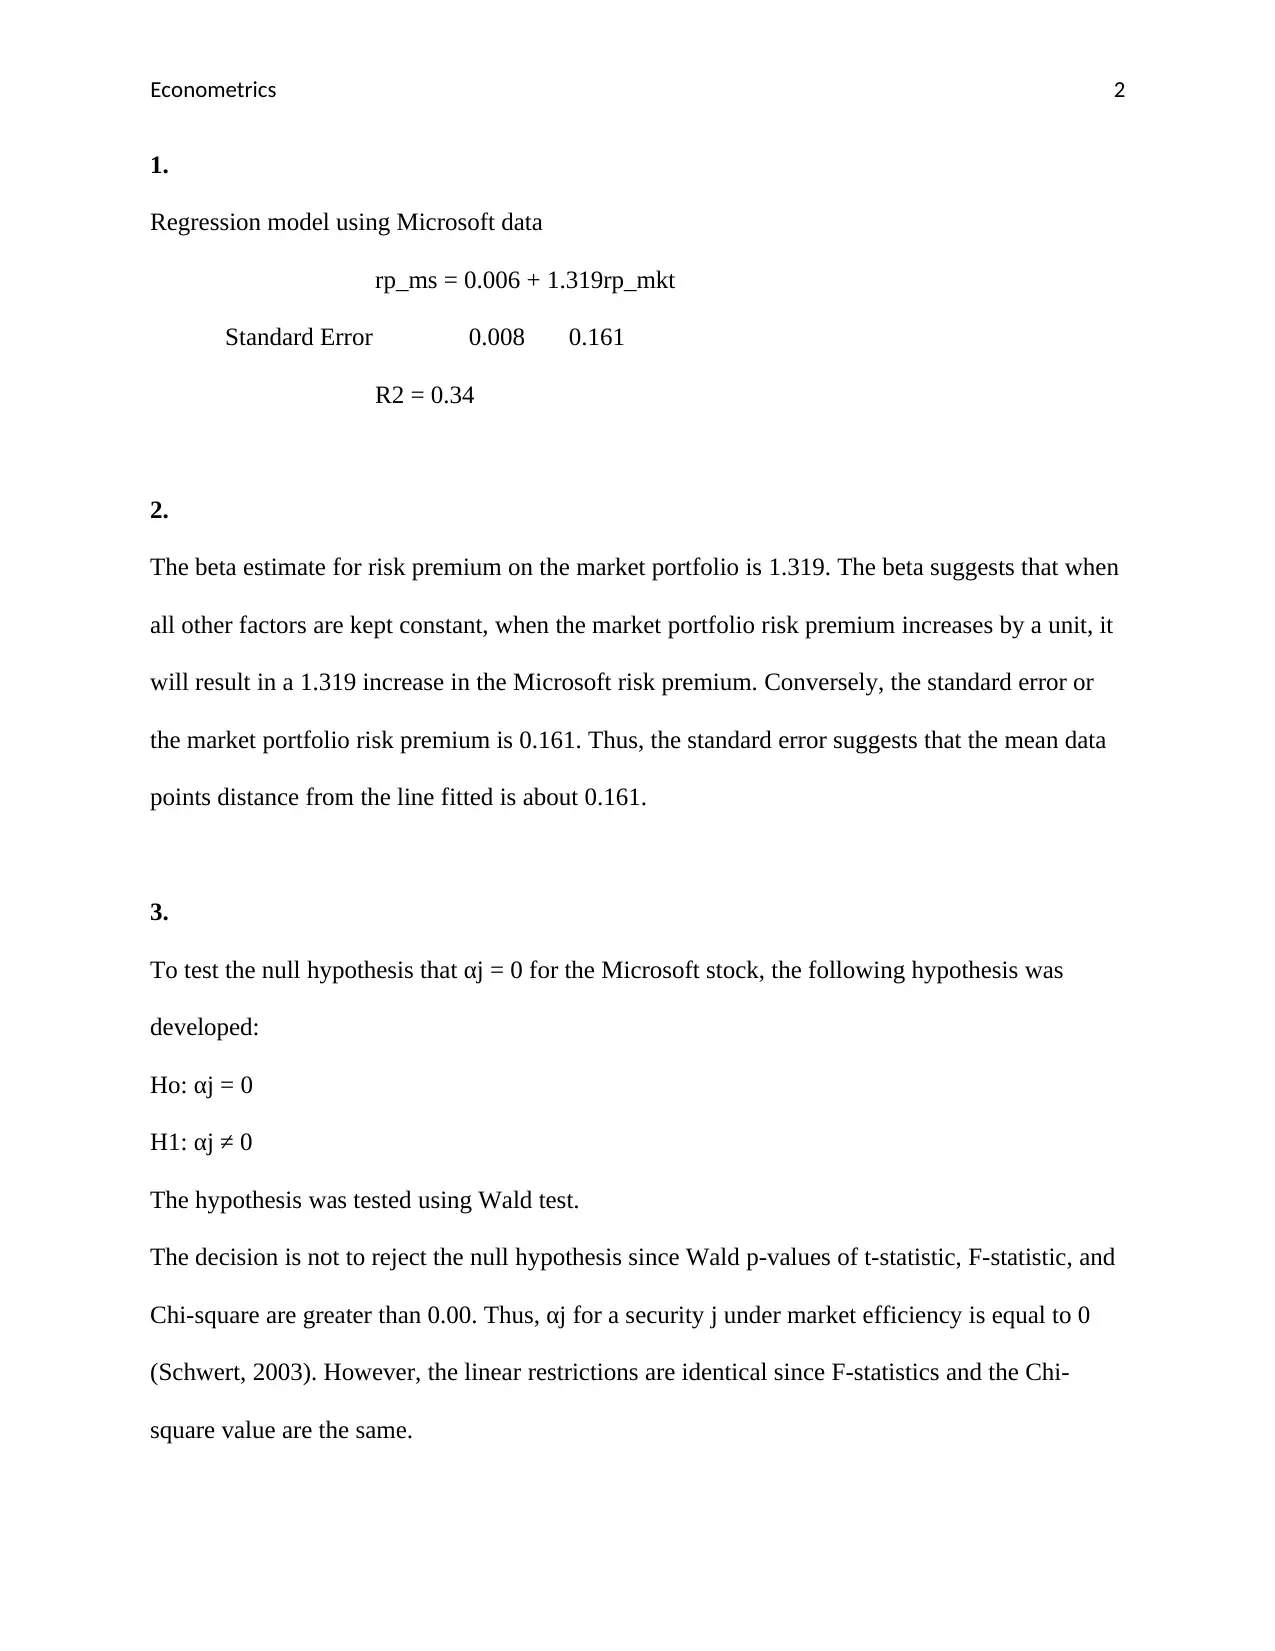
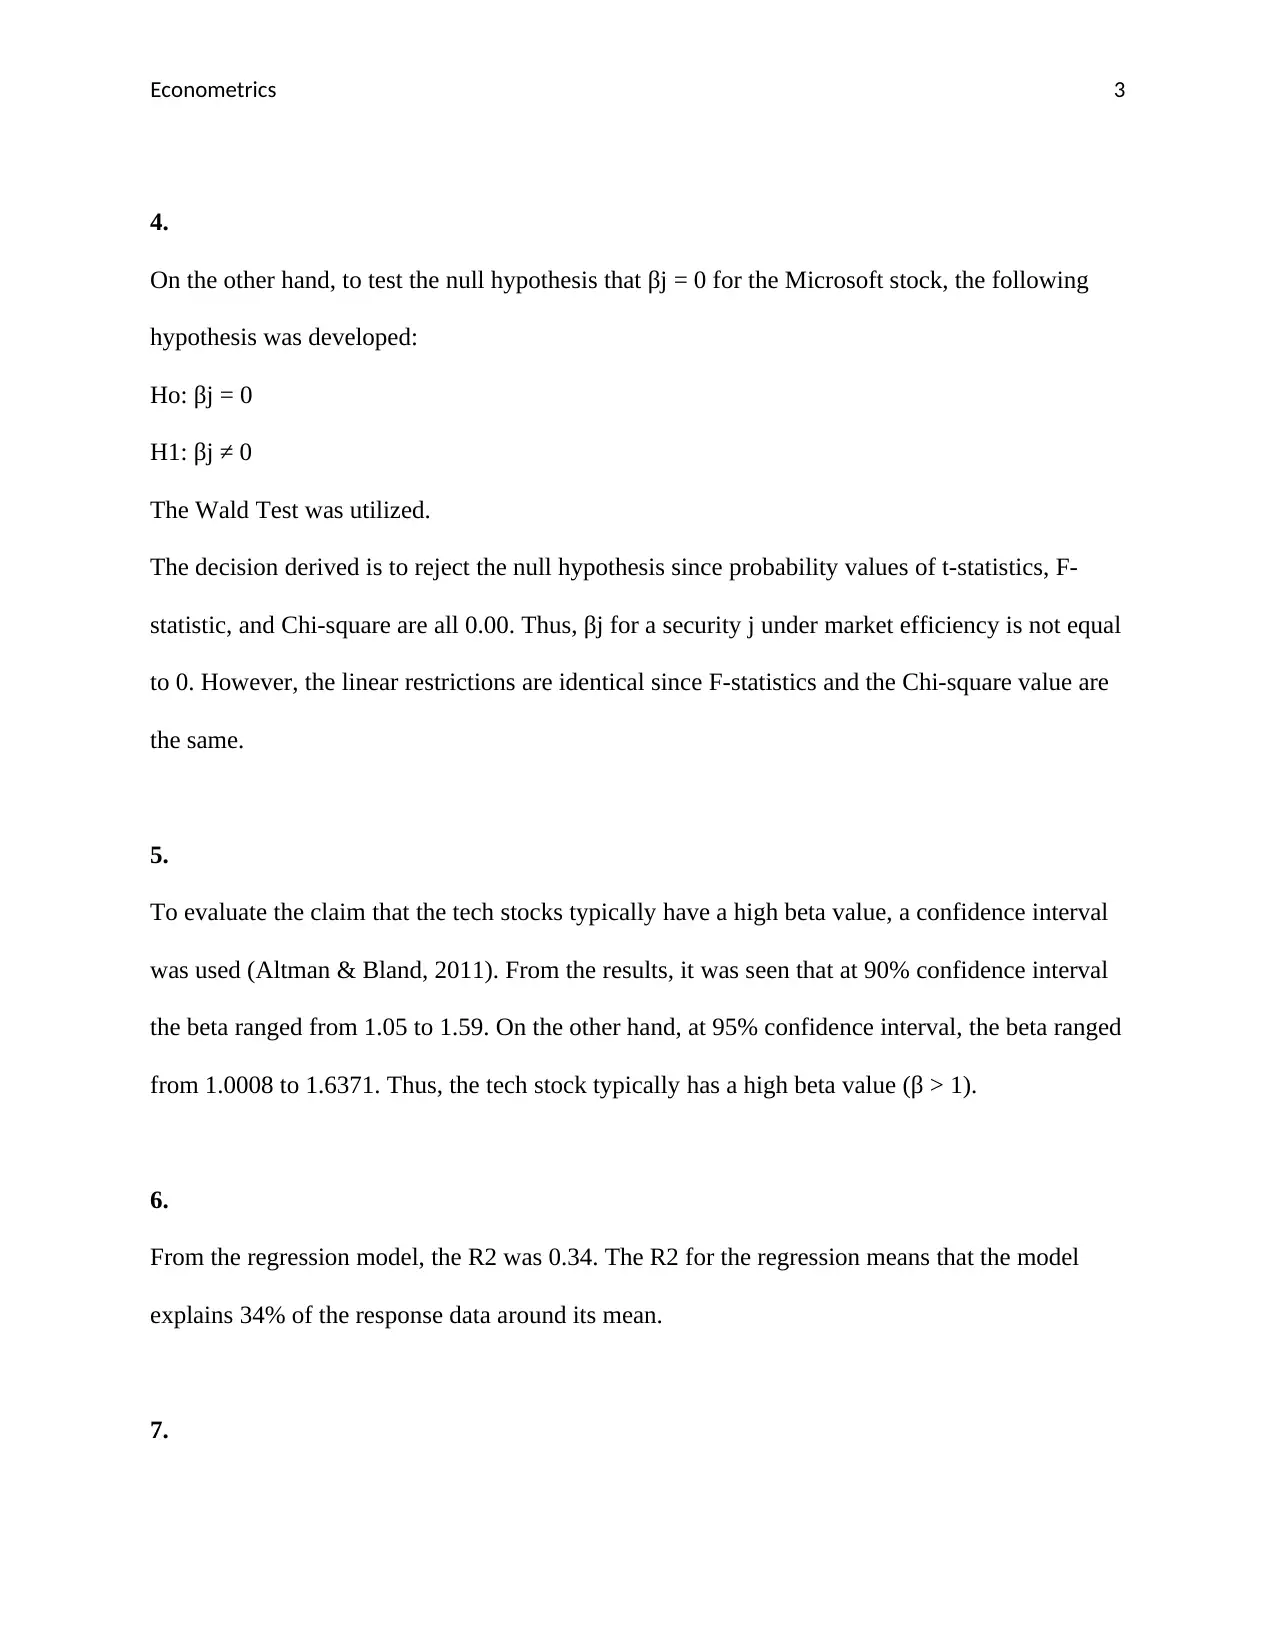
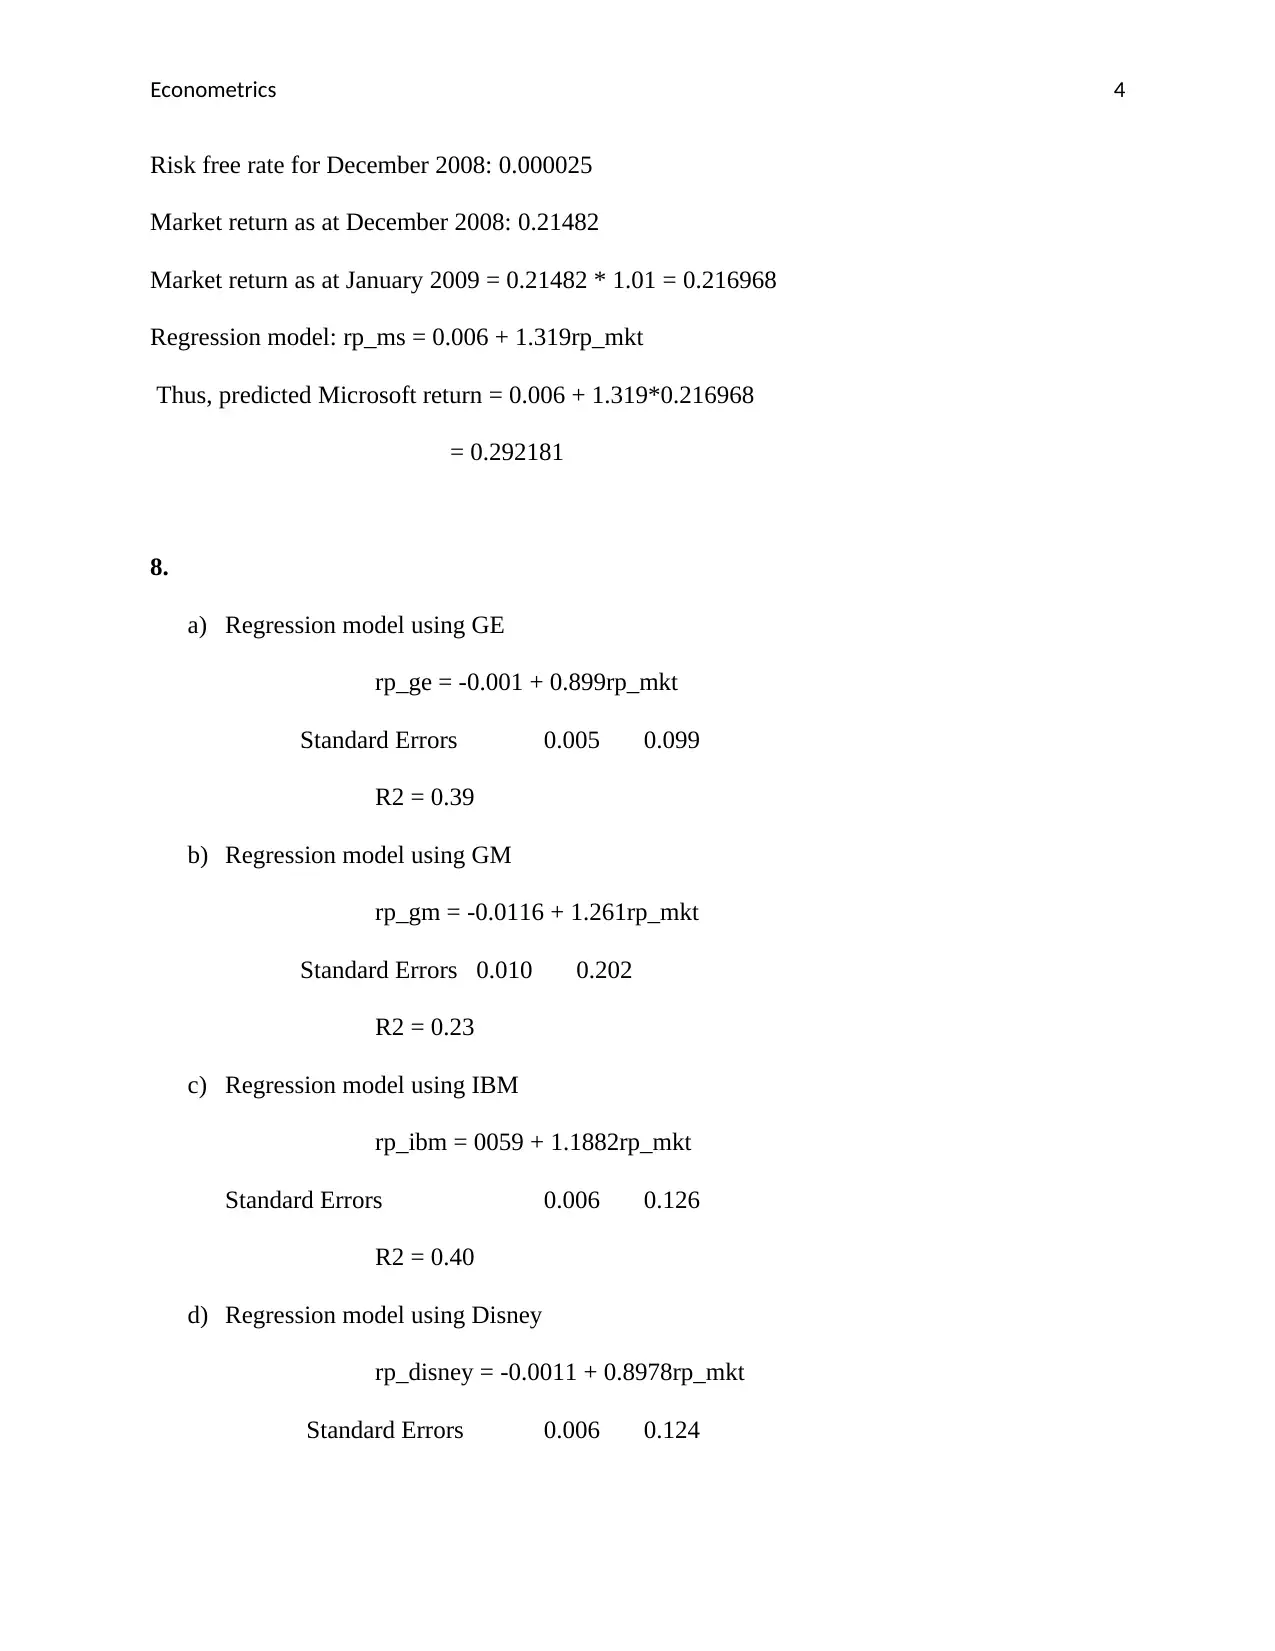
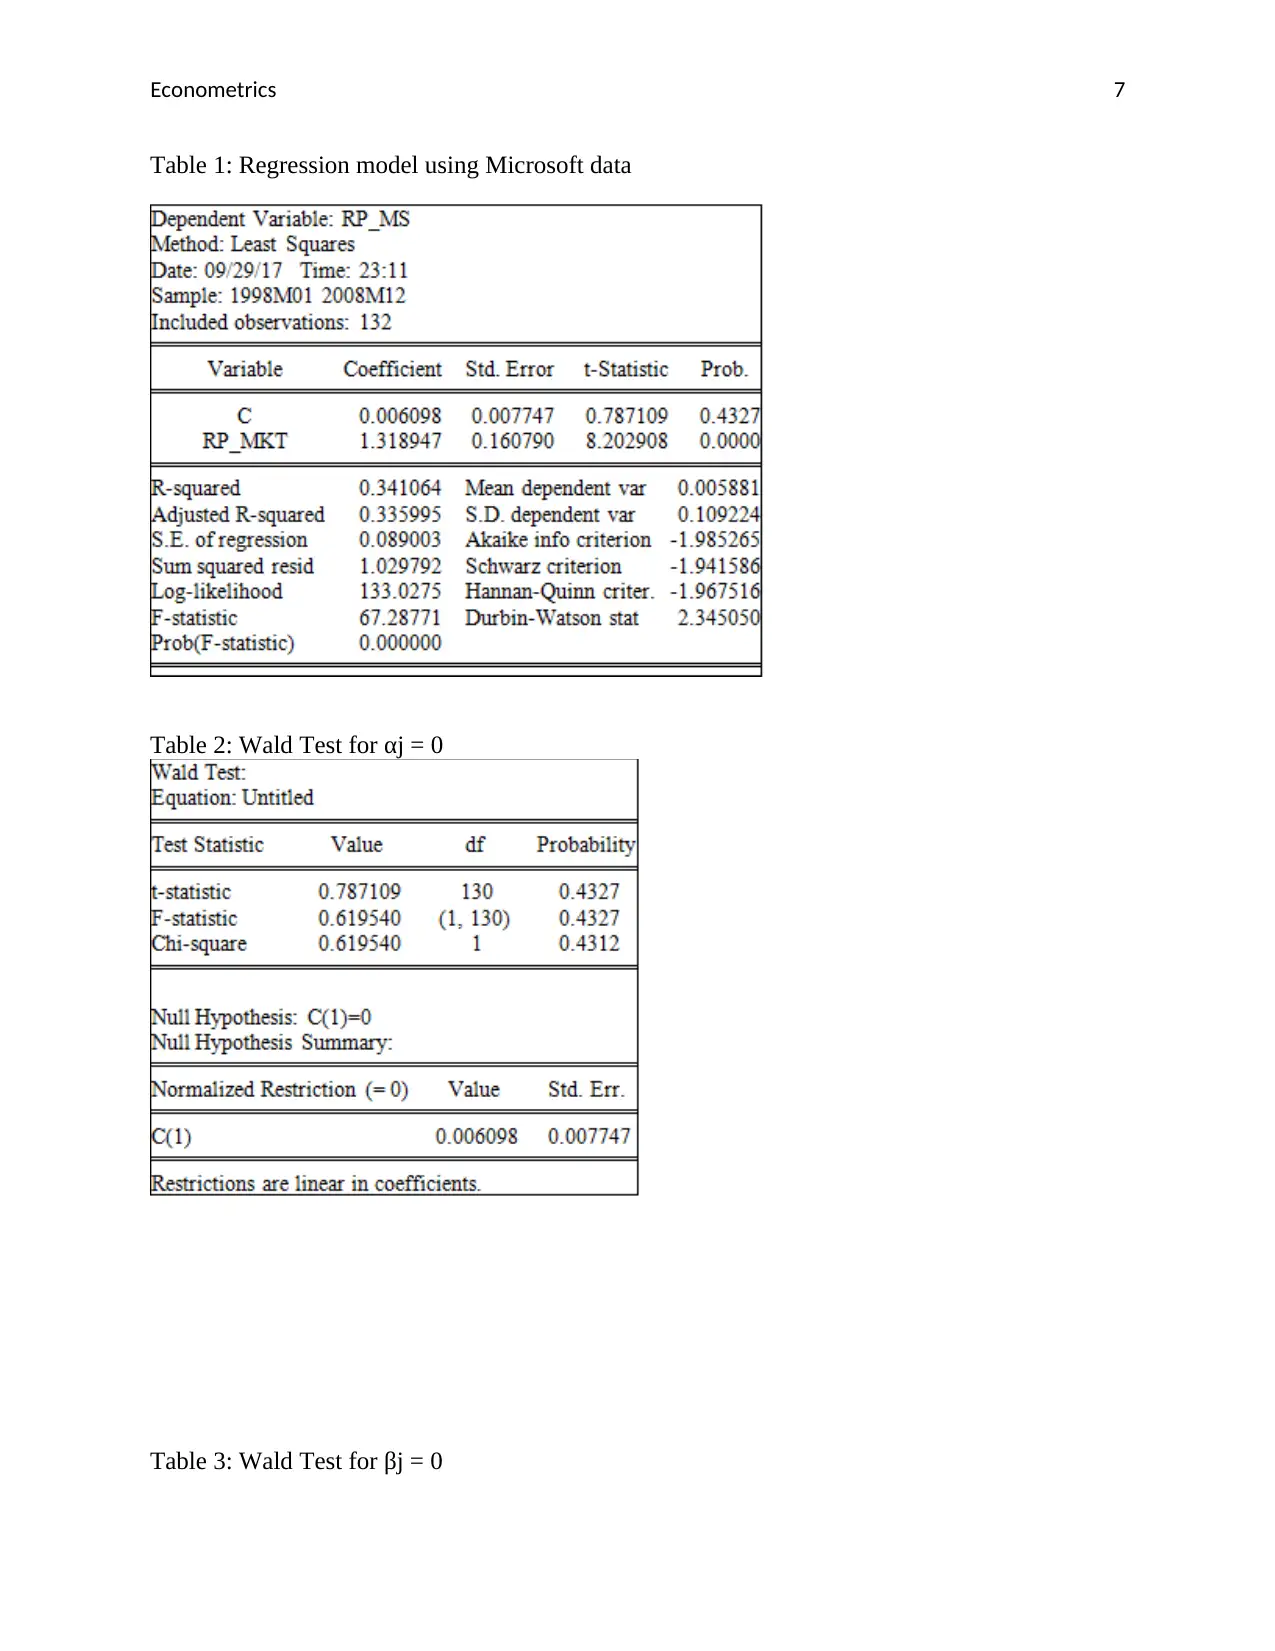
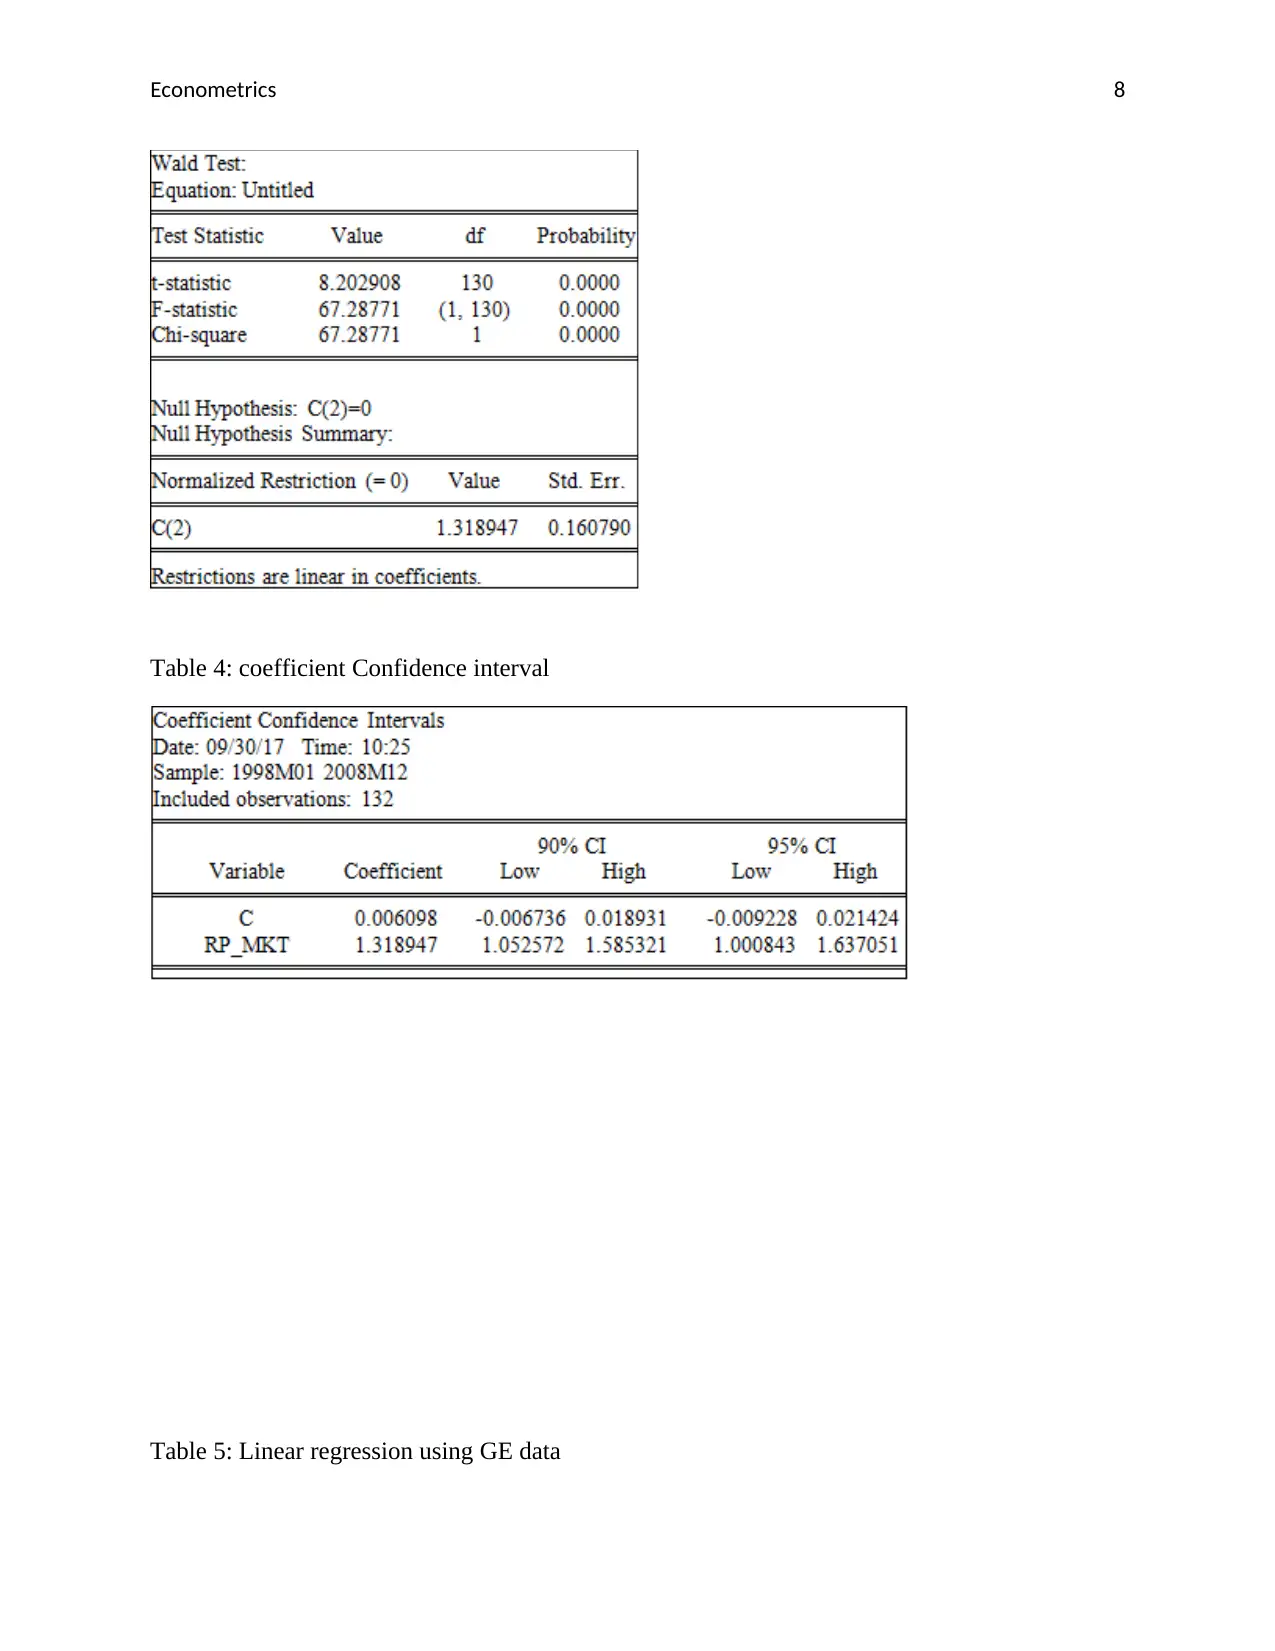
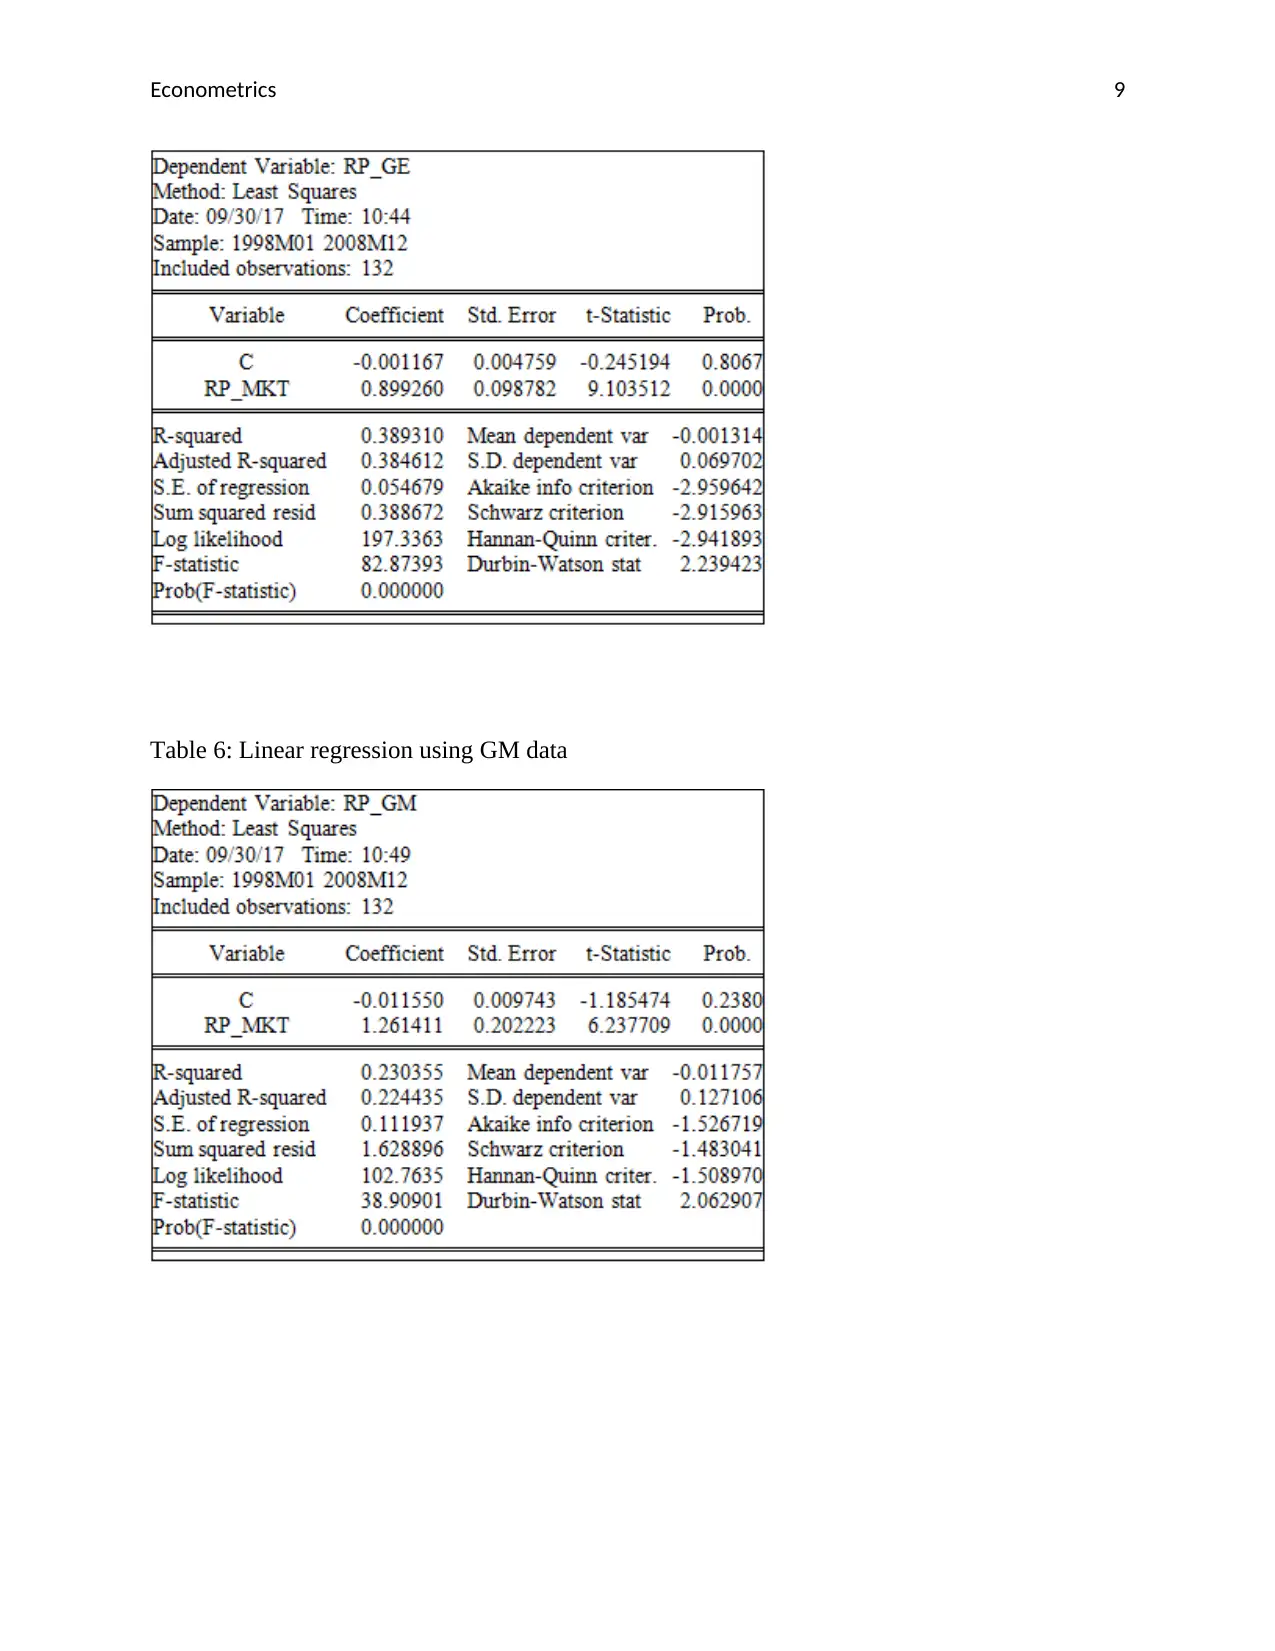
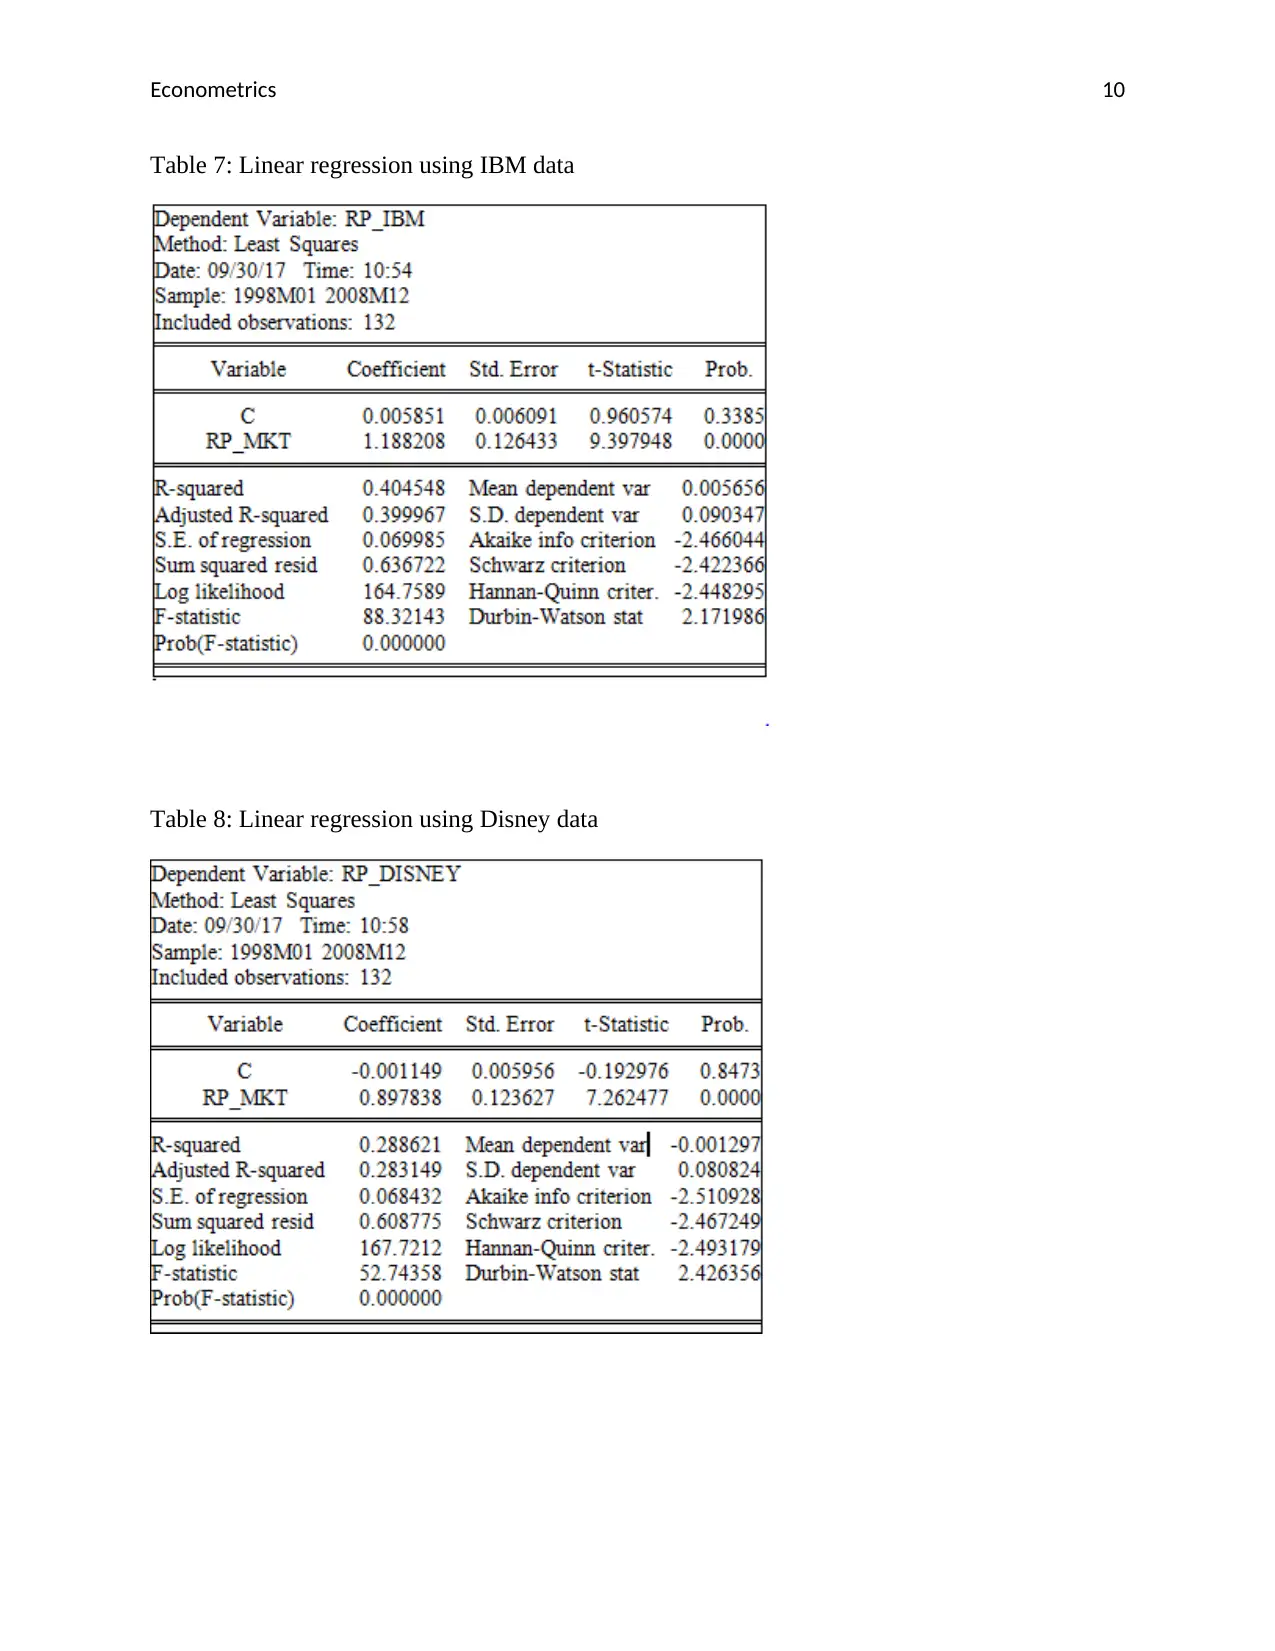
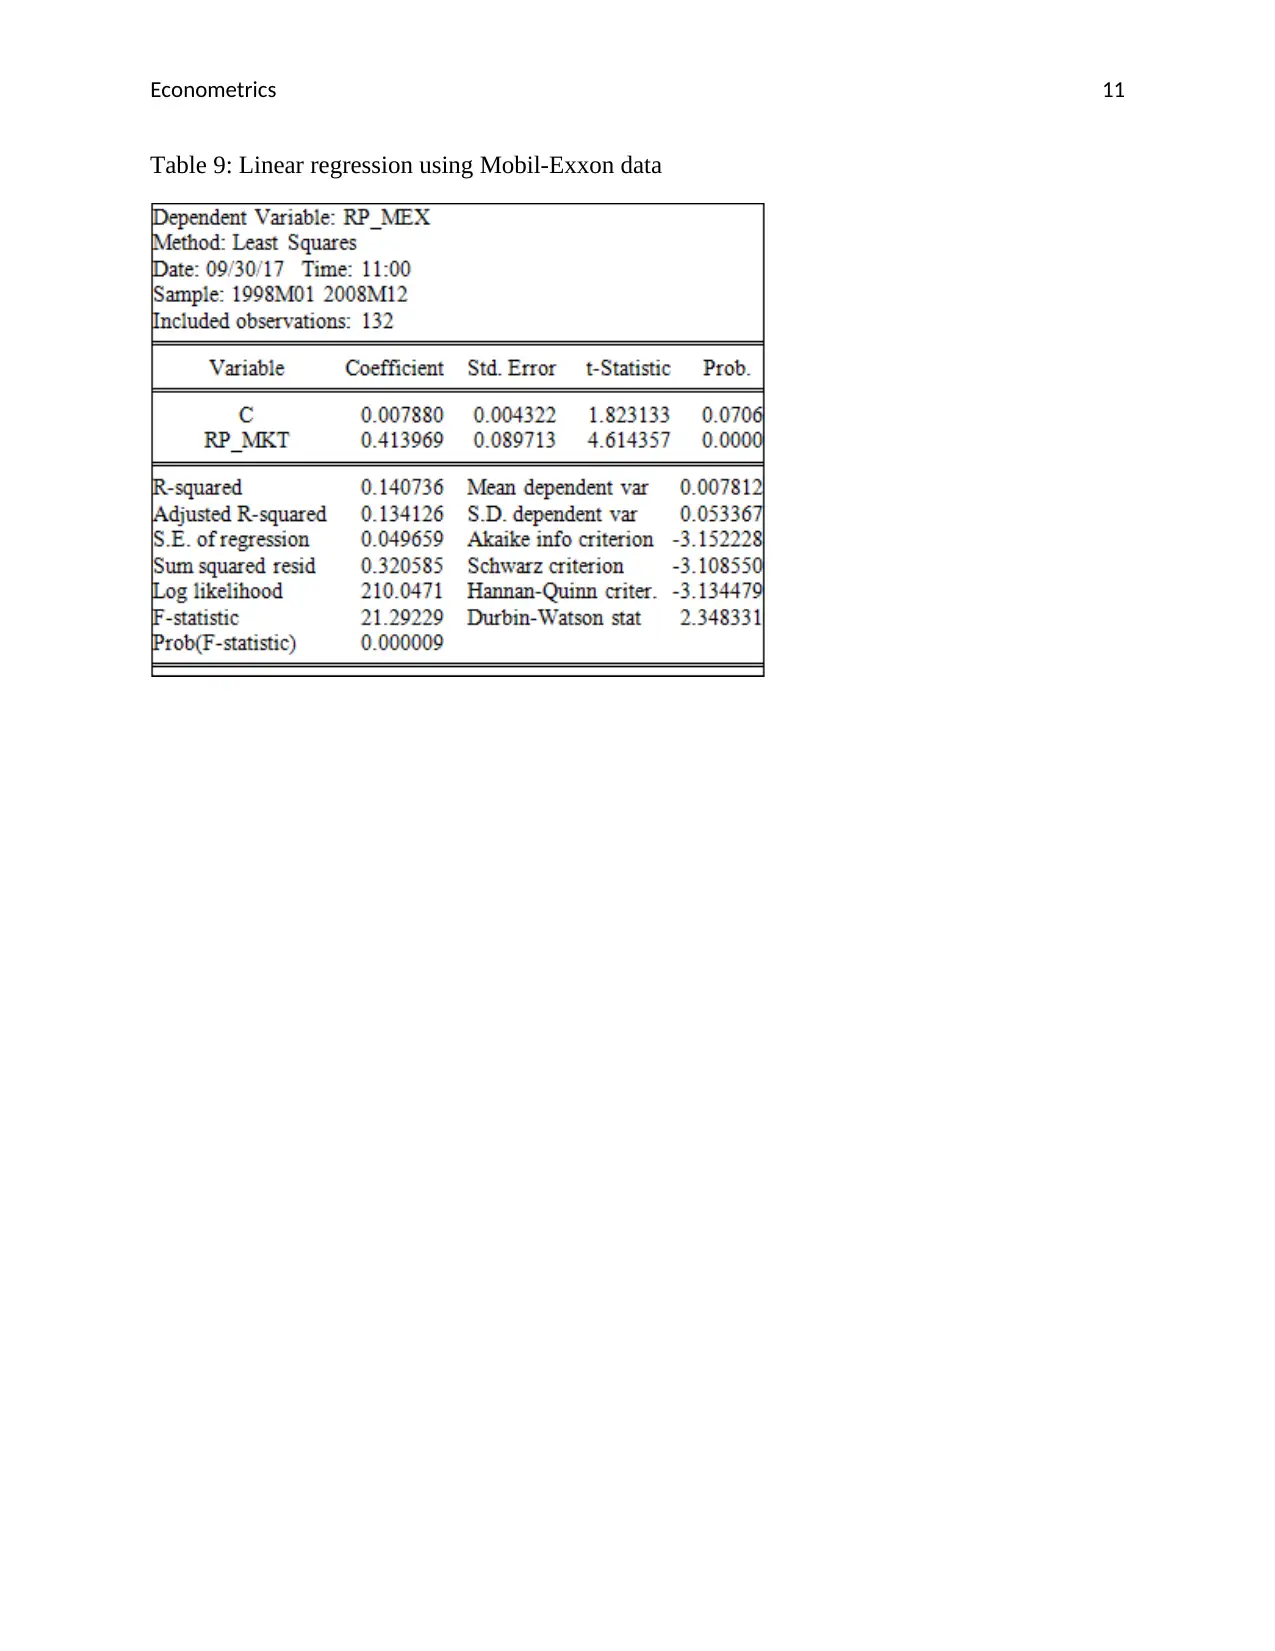
This report presents an econometrics assignment analyzing regression models for various tech stocks, including Microsoft, GE, GM, IBM, Disney, and Exxon. The analysis focuses on key financial metrics such as beta values, standard errors, and R-squared values, providing insights into the relationship between individual stock risk premiums and the market portfolio risk premium. The report includes hypothesis testing using Wald tests to assess the significance of alpha and beta coefficients. Confidence intervals are calculated to evaluate the beta values of tech stocks. The report also includes calculations for predicted returns and evaluates the model's explanatory power (R2). The assignment uses data from December 2008 and January 2009. The document also includes multiple regression models and their respective results, along with references to relevant academic literature.
1 out of 11
Related Documents


Your All-in-One AI-Powered Toolkit for Academic Success.
+13062052269
info@desklib.com
Available 24*7 on WhatsApp / Email
![[object Object]](/_next/static/media/star-bottom.7253800d.svg)
Copyright © 2020–2026 A2Z Services. All Rights Reserved. Developed and managed by ZUCOL.