Assignment on Financial Management1
VerifiedAdded on 2022/04/04
|11
|1661
|14
Assignment
AI Summary
Contribute Materials
Your contribution can guide someone’s learning journey. Share your
documents today.
Running head: FINANCIAL MANAGEMENT
Financial Management
Name of the Student:
Name of the University:
Authors Note:
Financial Management
Name of the Student:
Name of the University:
Authors Note:
Secure Best Marks with AI Grader
Need help grading? Try our AI Grader for instant feedback on your assignments.
FINANCIAL MANAGEMENT
1
Table of Contents
Question 1:.................................................................................................................................2
a) Long-term debt, first $550 000:.............................................................................................2
b) Long-term debt, greater than $550 000:................................................................................2
c) Preference shares, all amounts:..............................................................................................2
d) Ordinary share capital, first $1.75 million:............................................................................2
e) Ordinary share capital, greater than $1.75 million:...............................................................2
f) Breaking point:.......................................................................................................................3
g) WACC calculation:................................................................................................................3
h) Providing Graph.....................................................................................................................4
Question 2:.................................................................................................................................4
a) Calculating times interest earned ratio and providing explanations:....................................4
b) Market value of Tampa’s Equity under zero growth model:.................................................5
c) Recommending the best possible capital structure:...............................................................5
Question 3:.................................................................................................................................6
Bibliography:..............................................................................................................................9
FINANCIAL MANAGEMENT
2
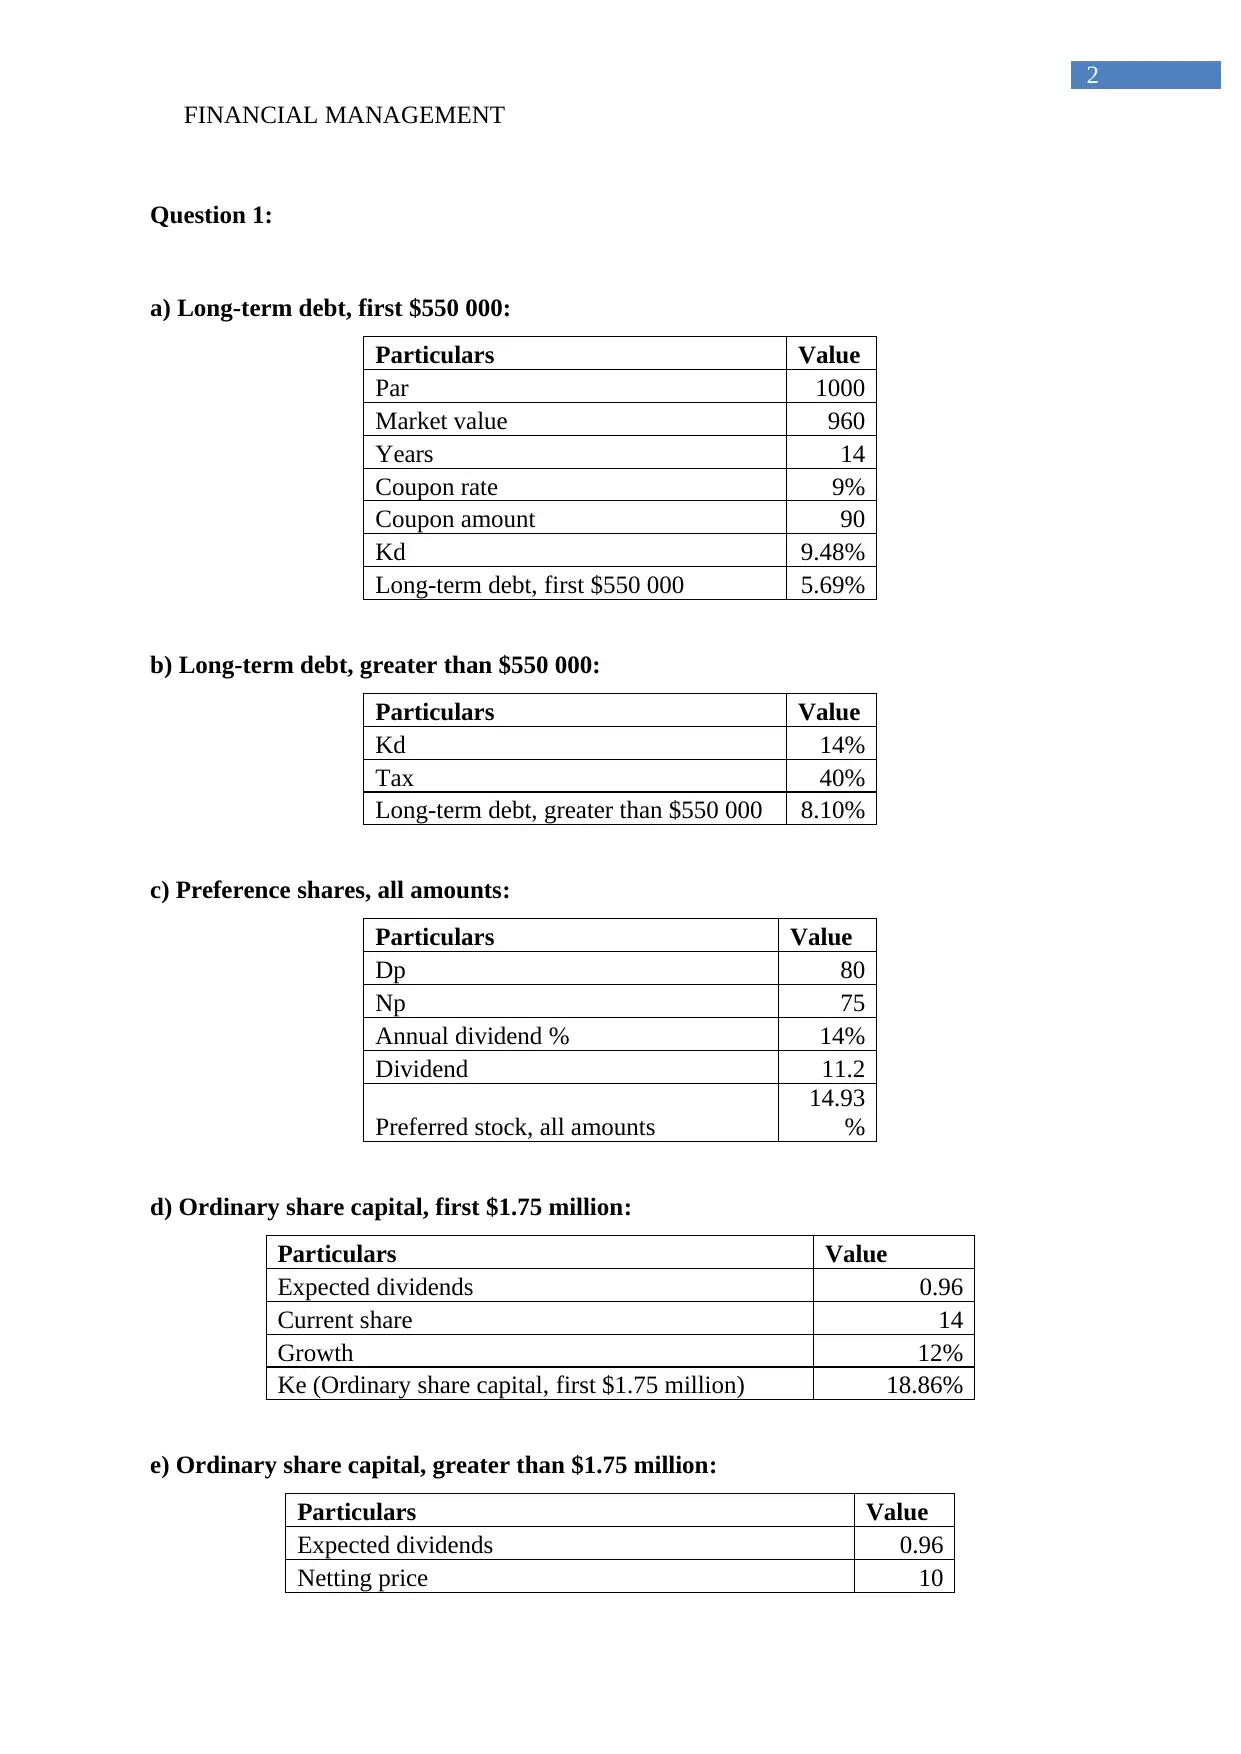
Question 1:
a) Long-term debt, first $550 000:
Particulars Value
Par 1000
Market value 960
Years 14
Coupon rate 9%
Coupon amount 90
Kd 9.48%
Long-term debt, first $550 000 5.69%
b) Long-term debt, greater than $550 000:
Particulars Value
Kd 14%
Tax 40%
Long-term debt, greater than $550 000 8.10%
c) Preference shares, all amounts:
Particulars Value
Dp 80
Np 75
Annual dividend % 14%
Dividend 11.2
Preferred stock, all amounts
14.93
%
d) Ordinary share capital, first $1.75 million:
Particulars Value
Expected dividends 0.96
Current share 14
Growth 12%
Ke (Ordinary share capital, first $1.75 million) 18.86%
e) Ordinary share capital, greater than $1.75 million:
Particulars Value
Expected dividends 0.96
Netting price 10
2
Question 1:
a) Long-term debt, first $550 000:
Particulars Value
Par 1000
Market value 960
Years 14
Coupon rate 9%
Coupon amount 90
Kd 9.48%
Long-term debt, first $550 000 5.69%
b) Long-term debt, greater than $550 000:
Particulars Value
Kd 14%
Tax 40%
Long-term debt, greater than $550 000 8.10%
c) Preference shares, all amounts:
Particulars Value
Dp 80
Np 75
Annual dividend % 14%
Dividend 11.2
Preferred stock, all amounts
14.93
%
d) Ordinary share capital, first $1.75 million:
Particulars Value
Expected dividends 0.96
Current share 14
Growth 12%
Ke (Ordinary share capital, first $1.75 million) 18.86%
e) Ordinary share capital, greater than $1.75 million:
Particulars Value
Expected dividends 0.96
Netting price 10
FINANCIAL MANAGEMENT
3
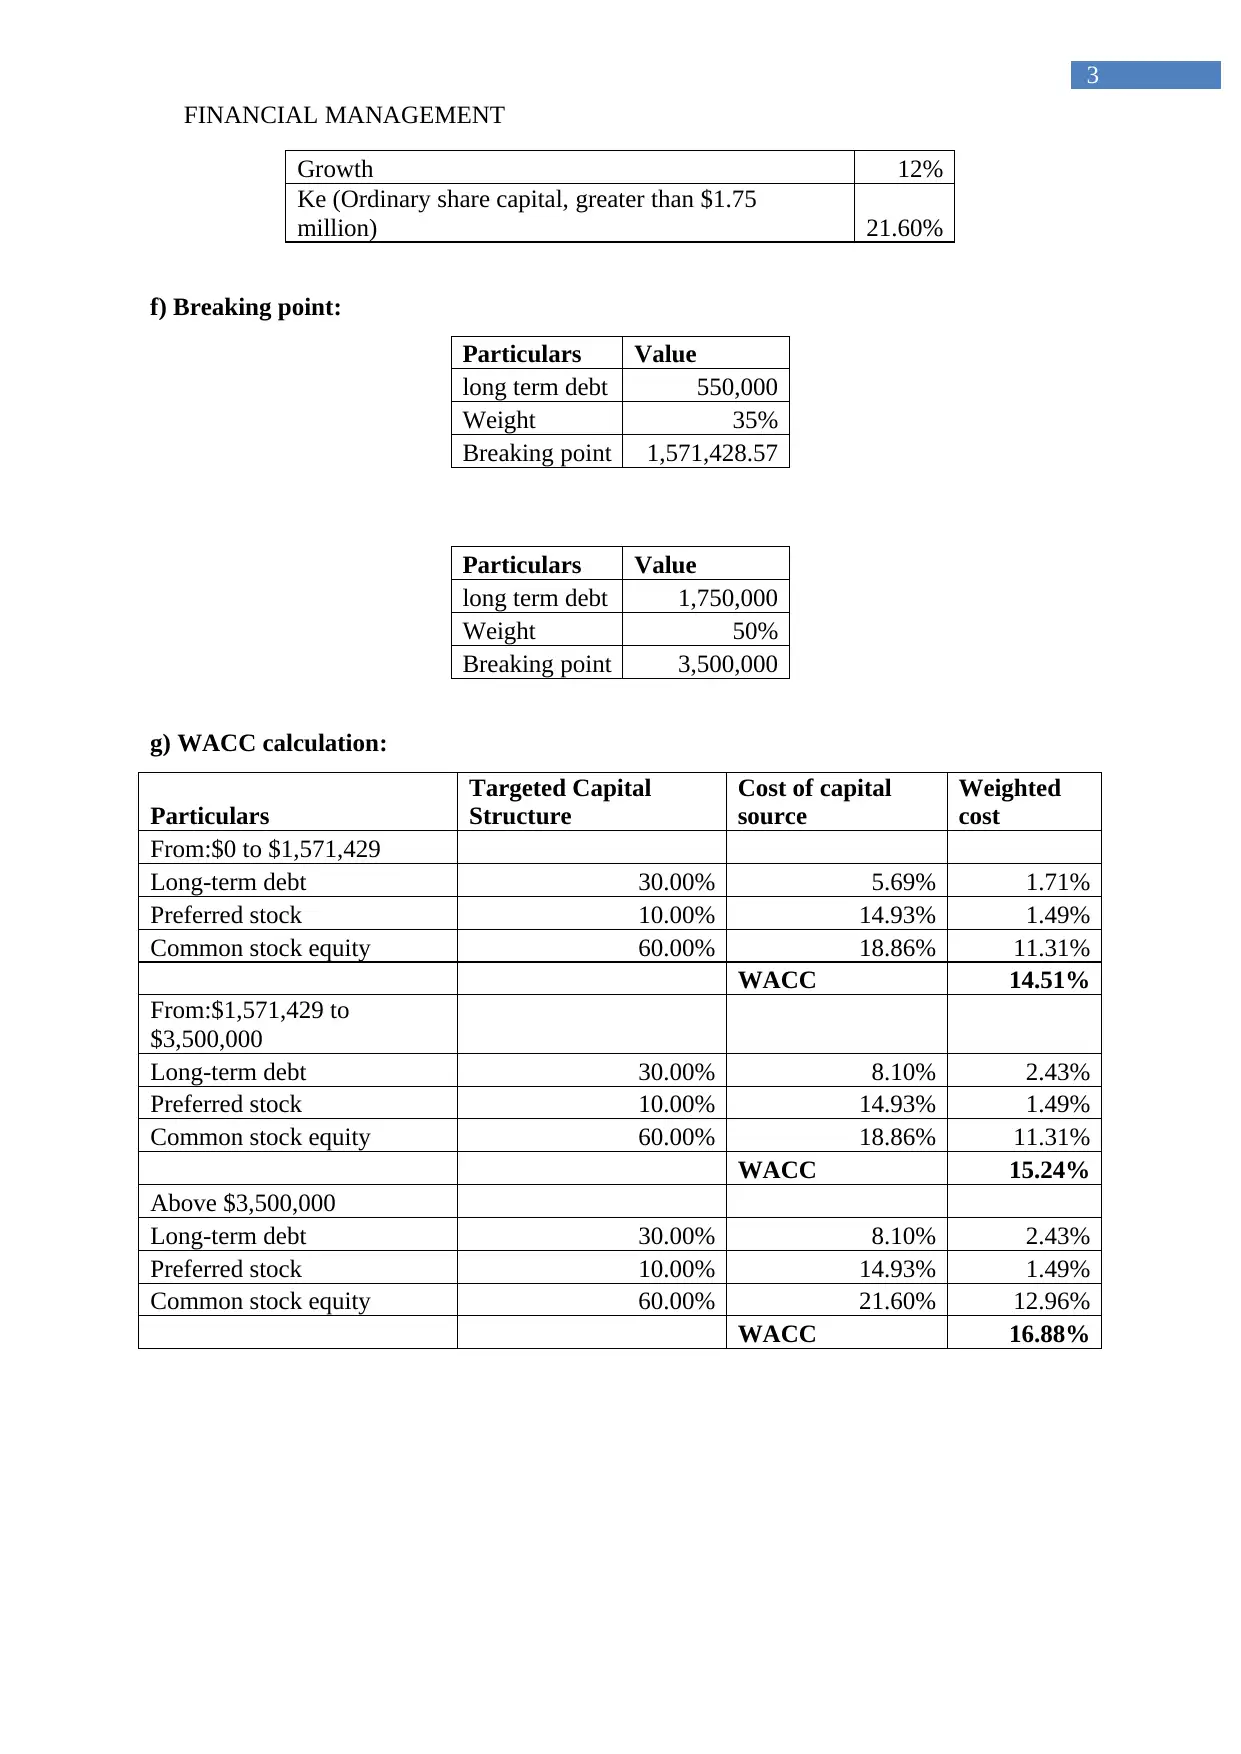
Growth 12%
Ke (Ordinary share capital, greater than $1.75
million) 21.60%
f) Breaking point:
Particulars Value
long term debt 550,000
Weight 35%
Breaking point 1,571,428.57
Particulars Value
long term debt 1,750,000
Weight 50%
Breaking point 3,500,000
g) WACC calculation:
Particulars
Targeted Capital
Structure
Cost of capital
source
Weighted
cost
From:$0 to $1,571,429
Long-term debt 30.00% 5.69% 1.71%
Preferred stock 10.00% 14.93% 1.49%
Common stock equity 60.00% 18.86% 11.31%
WACC 14.51%
From:$1,571,429 to
$3,500,000
Long-term debt 30.00% 8.10% 2.43%
Preferred stock 10.00% 14.93% 1.49%
Common stock equity 60.00% 18.86% 11.31%
WACC 15.24%
Above $3,500,000
Long-term debt 30.00% 8.10% 2.43%
Preferred stock 10.00% 14.93% 1.49%
Common stock equity 60.00% 21.60% 12.96%
WACC 16.88%
3
Growth 12%
Ke (Ordinary share capital, greater than $1.75
million) 21.60%
f) Breaking point:
Particulars Value
long term debt 550,000
Weight 35%
Breaking point 1,571,428.57
Particulars Value
long term debt 1,750,000
Weight 50%
Breaking point 3,500,000
g) WACC calculation:
Particulars
Targeted Capital
Structure
Cost of capital
source
Weighted
cost
From:$0 to $1,571,429
Long-term debt 30.00% 5.69% 1.71%
Preferred stock 10.00% 14.93% 1.49%
Common stock equity 60.00% 18.86% 11.31%
WACC 14.51%
From:$1,571,429 to
$3,500,000
Long-term debt 30.00% 8.10% 2.43%
Preferred stock 10.00% 14.93% 1.49%
Common stock equity 60.00% 18.86% 11.31%
WACC 15.24%
Above $3,500,000
Long-term debt 30.00% 8.10% 2.43%
Preferred stock 10.00% 14.93% 1.49%
Common stock equity 60.00% 21.60% 12.96%
WACC 16.88%
Secure Best Marks with AI Grader
Need help grading? Try our AI Grader for instant feedback on your assignments.
FINANCIAL MANAGEMENT
4
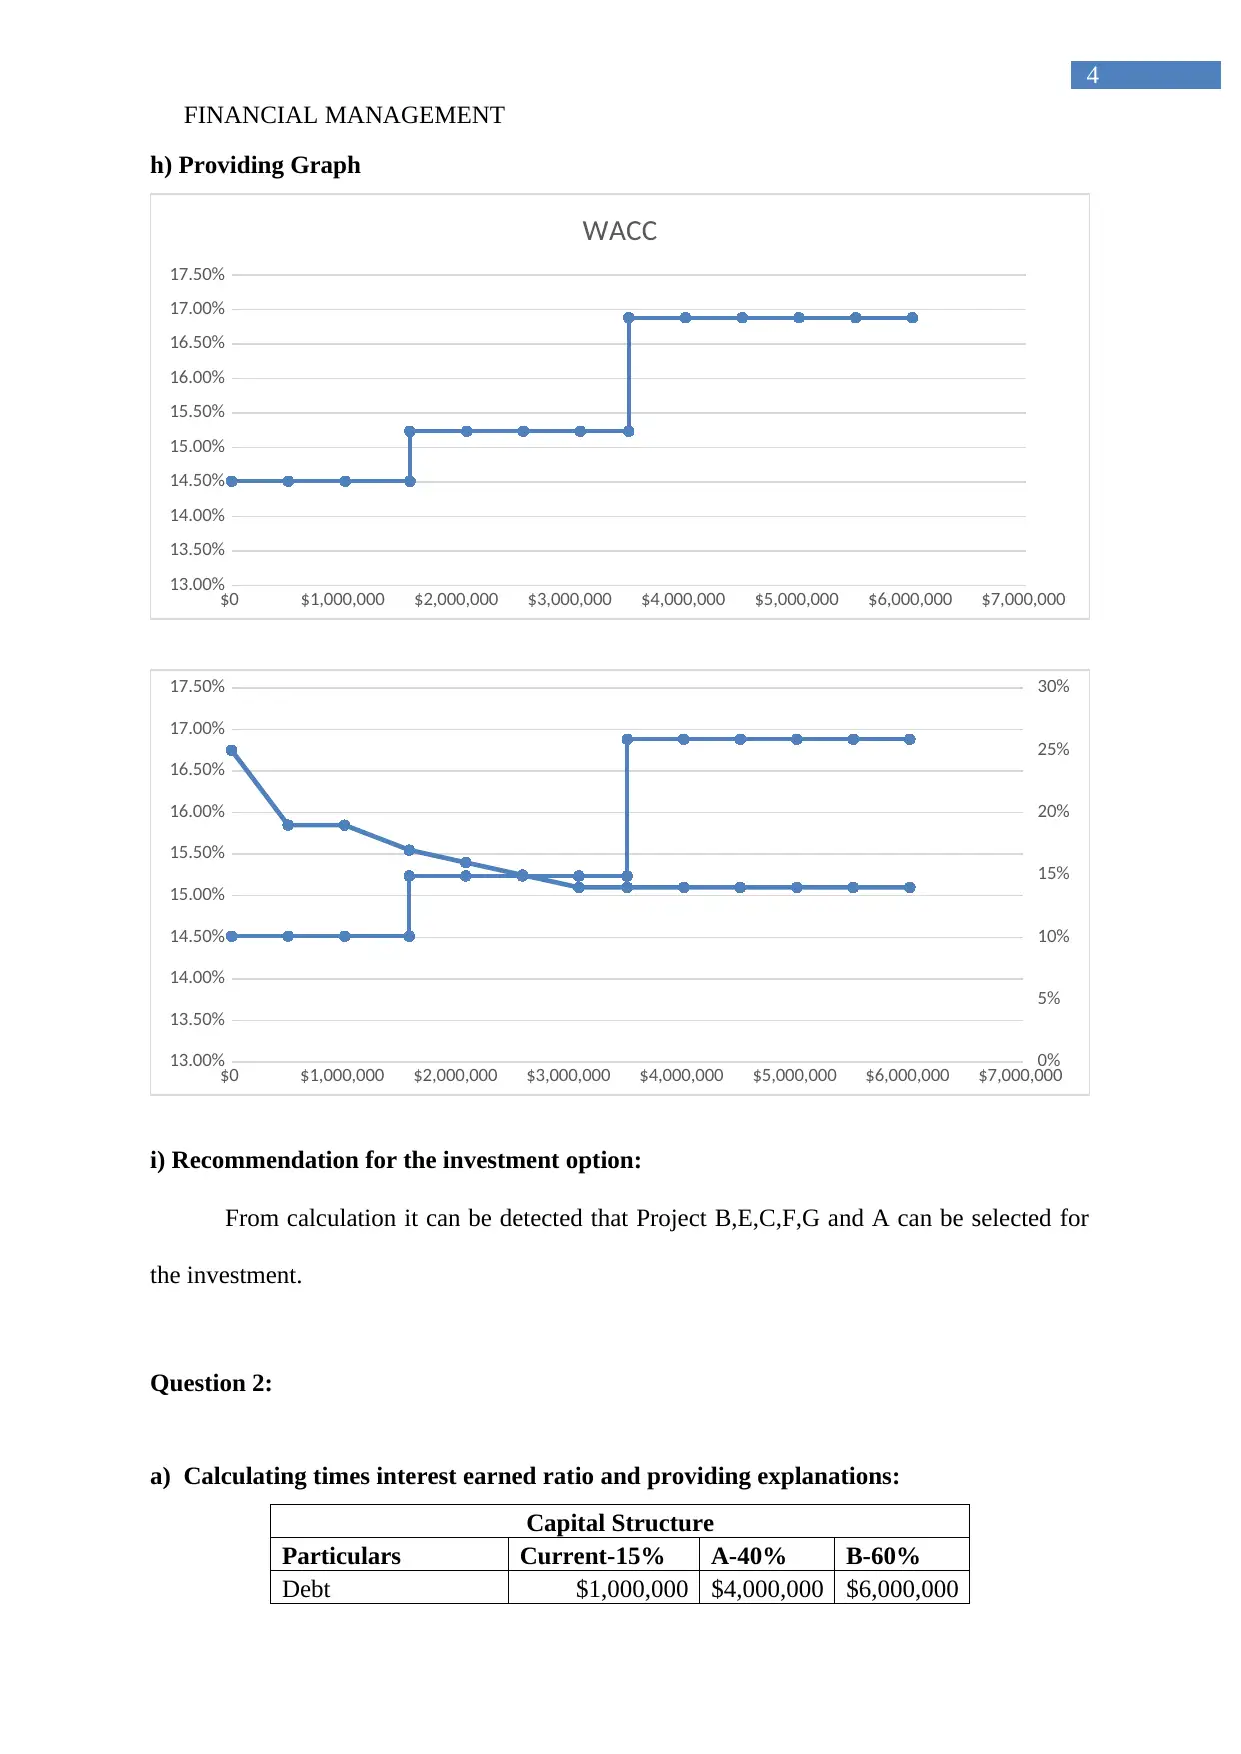
h) Providing Graph
$0 $1,000,000 $2,000,000 $3,000,000 $4,000,000 $5,000,000 $6,000,000 $7,000,000
13.00%
13.50%
14.00%
14.50%
15.00%
15.50%
16.00%
16.50%
17.00%
17.50%
WACC
$0 $1,000,000 $2,000,000 $3,000,000 $4,000,000 $5,000,000 $6,000,000 $7,000,000
13.00%
13.50%
14.00%
14.50%
15.00%
15.50%
16.00%
16.50%
17.00%
17.50%
0%
5%
10%
15%
20%
25%
30%
i) Recommendation for the investment option:
From calculation it can be detected that Project B,E,C,F,G and A can be selected for
the investment.
Question 2:
a) Calculating times interest earned ratio and providing explanations:
Capital Structure
Particulars Current-15% A-40% B-60%
Debt $1,000,000 $4,000,000 $6,000,000
4
h) Providing Graph
$0 $1,000,000 $2,000,000 $3,000,000 $4,000,000 $5,000,000 $6,000,000 $7,000,000
13.00%
13.50%
14.00%
14.50%
15.00%
15.50%
16.00%
16.50%
17.00%
17.50%
WACC
$0 $1,000,000 $2,000,000 $3,000,000 $4,000,000 $5,000,000 $6,000,000 $7,000,000
13.00%
13.50%
14.00%
14.50%
15.00%
15.50%
16.00%
16.50%
17.00%
17.50%
0%
5%
10%
15%
20%
25%
30%
i) Recommendation for the investment option:
From calculation it can be detected that Project B,E,C,F,G and A can be selected for
the investment.
Question 2:
a) Calculating times interest earned ratio and providing explanations:
Capital Structure
Particulars Current-15% A-40% B-60%
Debt $1,000,000 $4,000,000 $6,000,000
FINANCIAL MANAGEMENT
5
Coupon Interest rate 8% 10% 12%
EBIT $1,400,000 $1,400,000 $1,400,000
Interest $80,000 $400,000 $720,000
Times interest earned 17.50 3.50 1.94
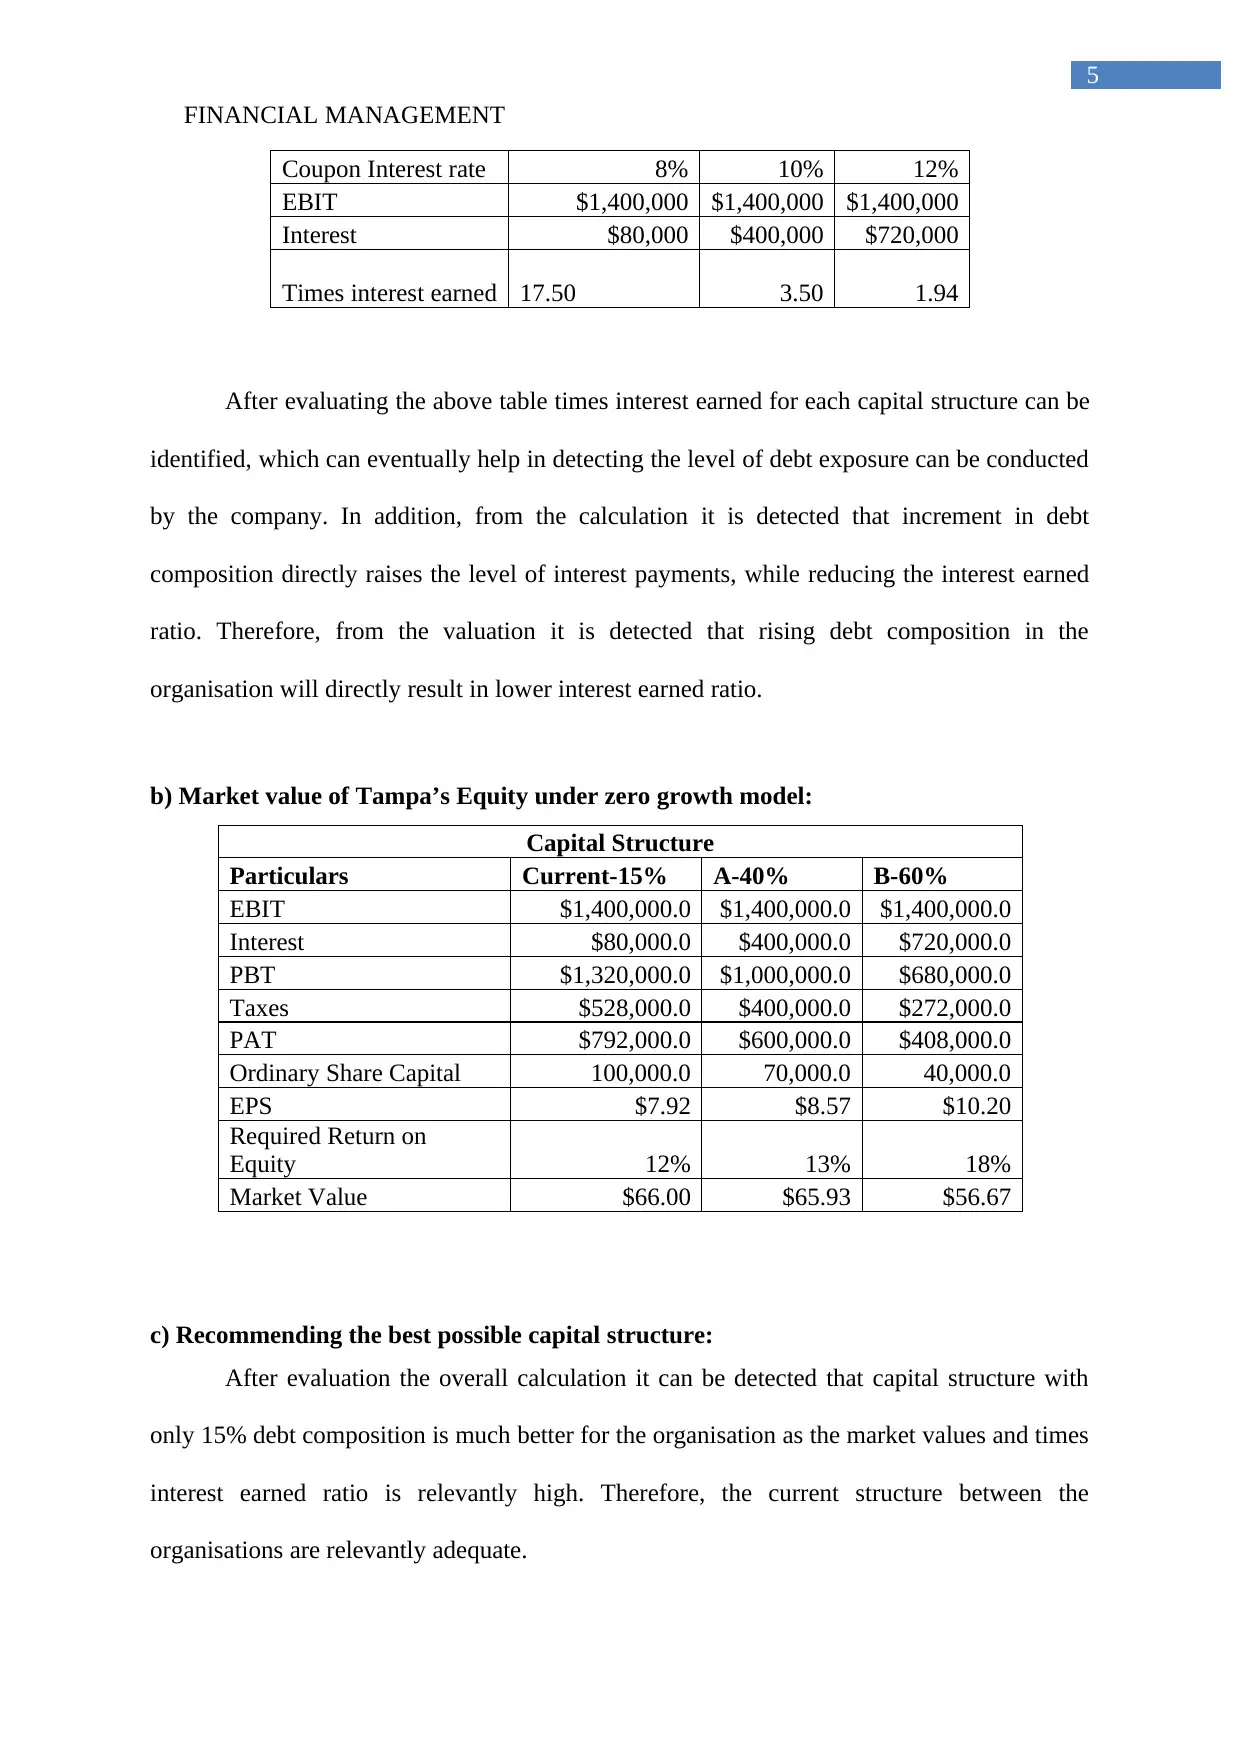
After evaluating the above table times interest earned for each capital structure can be
identified, which can eventually help in detecting the level of debt exposure can be conducted
by the company. In addition, from the calculation it is detected that increment in debt
composition directly raises the level of interest payments, while reducing the interest earned
ratio. Therefore, from the valuation it is detected that rising debt composition in the
organisation will directly result in lower interest earned ratio.
b) Market value of Tampa’s Equity under zero growth model:
Capital Structure
Particulars Current-15% A-40% B-60%
EBIT $1,400,000.0 $1,400,000.0 $1,400,000.0
Interest $80,000.0 $400,000.0 $720,000.0
PBT $1,320,000.0 $1,000,000.0 $680,000.0
Taxes $528,000.0 $400,000.0 $272,000.0
PAT $792,000.0 $600,000.0 $408,000.0
Ordinary Share Capital 100,000.0 70,000.0 40,000.0
EPS $7.92 $8.57 $10.20
Required Return on
Equity 12% 13% 18%
Market Value $66.00 $65.93 $56.67
c) Recommending the best possible capital structure:
After evaluation the overall calculation it can be detected that capital structure with
only 15% debt composition is much better for the organisation as the market values and times
interest earned ratio is relevantly high. Therefore, the current structure between the
organisations are relevantly adequate.
5
Coupon Interest rate 8% 10% 12%
EBIT $1,400,000 $1,400,000 $1,400,000
Interest $80,000 $400,000 $720,000
Times interest earned 17.50 3.50 1.94
After evaluating the above table times interest earned for each capital structure can be
identified, which can eventually help in detecting the level of debt exposure can be conducted
by the company. In addition, from the calculation it is detected that increment in debt
composition directly raises the level of interest payments, while reducing the interest earned
ratio. Therefore, from the valuation it is detected that rising debt composition in the
organisation will directly result in lower interest earned ratio.
b) Market value of Tampa’s Equity under zero growth model:
Capital Structure
Particulars Current-15% A-40% B-60%
EBIT $1,400,000.0 $1,400,000.0 $1,400,000.0
Interest $80,000.0 $400,000.0 $720,000.0
PBT $1,320,000.0 $1,000,000.0 $680,000.0
Taxes $528,000.0 $400,000.0 $272,000.0
PAT $792,000.0 $600,000.0 $408,000.0
Ordinary Share Capital 100,000.0 70,000.0 40,000.0
EPS $7.92 $8.57 $10.20
Required Return on
Equity 12% 13% 18%
Market Value $66.00 $65.93 $56.67
c) Recommending the best possible capital structure:
After evaluation the overall calculation it can be detected that capital structure with
only 15% debt composition is much better for the organisation as the market values and times
interest earned ratio is relevantly high. Therefore, the current structure between the
organisations are relevantly adequate.
FINANCIAL MANAGEMENT
6
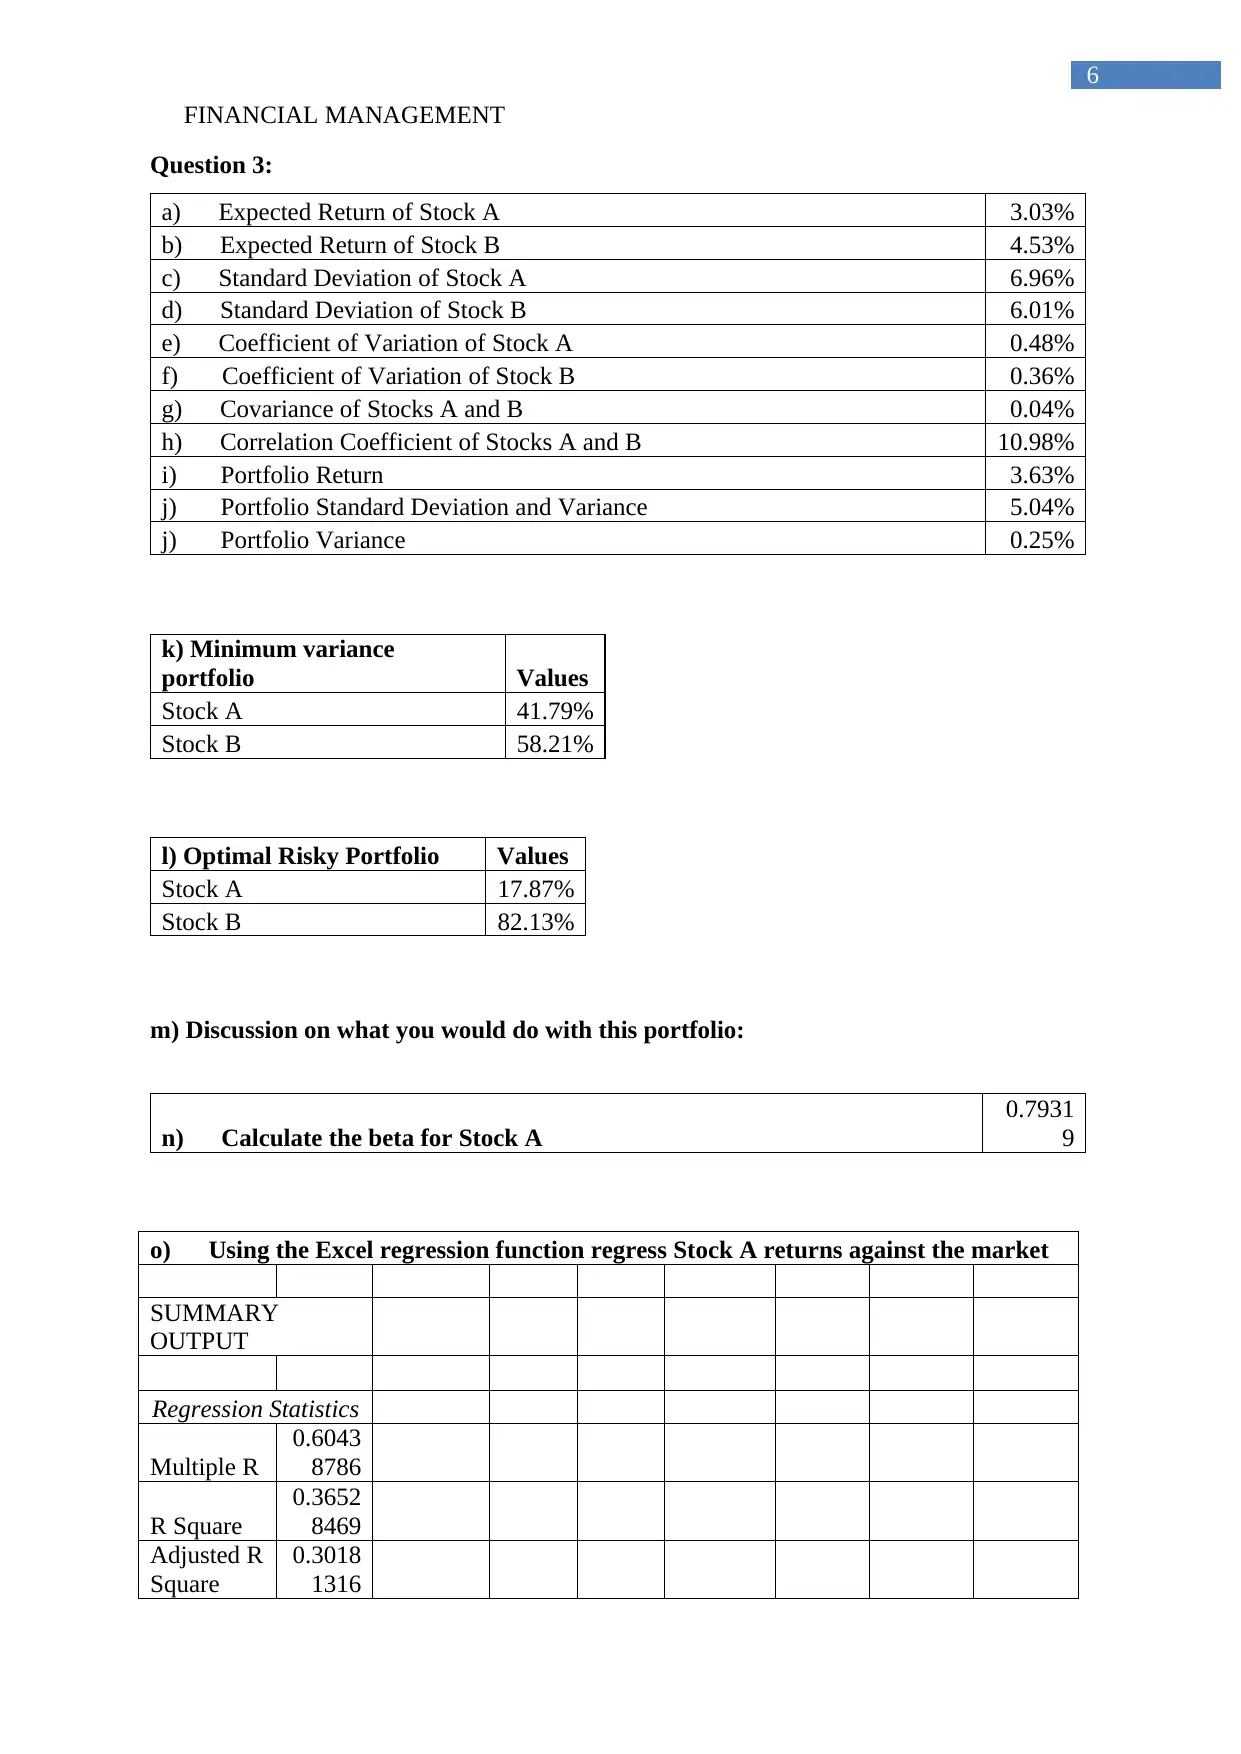
Question 3:
a) Expected Return of Stock A 3.03%
b) Expected Return of Stock B 4.53%
c) Standard Deviation of Stock A 6.96%
d) Standard Deviation of Stock B 6.01%
e) Coefficient of Variation of Stock A 0.48%
f) Coefficient of Variation of Stock B 0.36%
g) Covariance of Stocks A and B 0.04%
h) Correlation Coefficient of Stocks A and B 10.98%
i) Portfolio Return 3.63%
j) Portfolio Standard Deviation and Variance 5.04%
j) Portfolio Variance 0.25%
k) Minimum variance
portfolio Values
Stock A 41.79%
Stock B 58.21%
l) Optimal Risky Portfolio Values
Stock A 17.87%
Stock B 82.13%
m) Discussion on what you would do with this portfolio:
n) Calculate the beta for Stock A
0.7931
9
o) Using the Excel regression function regress Stock A returns against the market
SUMMARY
OUTPUT
Regression Statistics
Multiple R
0.6043
8786
R Square
0.3652
8469
Adjusted R
Square
0.3018
1316
6
Question 3:
a) Expected Return of Stock A 3.03%
b) Expected Return of Stock B 4.53%
c) Standard Deviation of Stock A 6.96%
d) Standard Deviation of Stock B 6.01%
e) Coefficient of Variation of Stock A 0.48%
f) Coefficient of Variation of Stock B 0.36%
g) Covariance of Stocks A and B 0.04%
h) Correlation Coefficient of Stocks A and B 10.98%
i) Portfolio Return 3.63%
j) Portfolio Standard Deviation and Variance 5.04%
j) Portfolio Variance 0.25%
k) Minimum variance
portfolio Values
Stock A 41.79%
Stock B 58.21%
l) Optimal Risky Portfolio Values
Stock A 17.87%
Stock B 82.13%
m) Discussion on what you would do with this portfolio:
n) Calculate the beta for Stock A
0.7931
9
o) Using the Excel regression function regress Stock A returns against the market
SUMMARY
OUTPUT
Regression Statistics
Multiple R
0.6043
8786
R Square
0.3652
8469
Adjusted R
Square
0.3018
1316
Paraphrase This Document
Need a fresh take? Get an instant paraphrase of this document with our AI Paraphraser
FINANCIAL MANAGEMENT
7
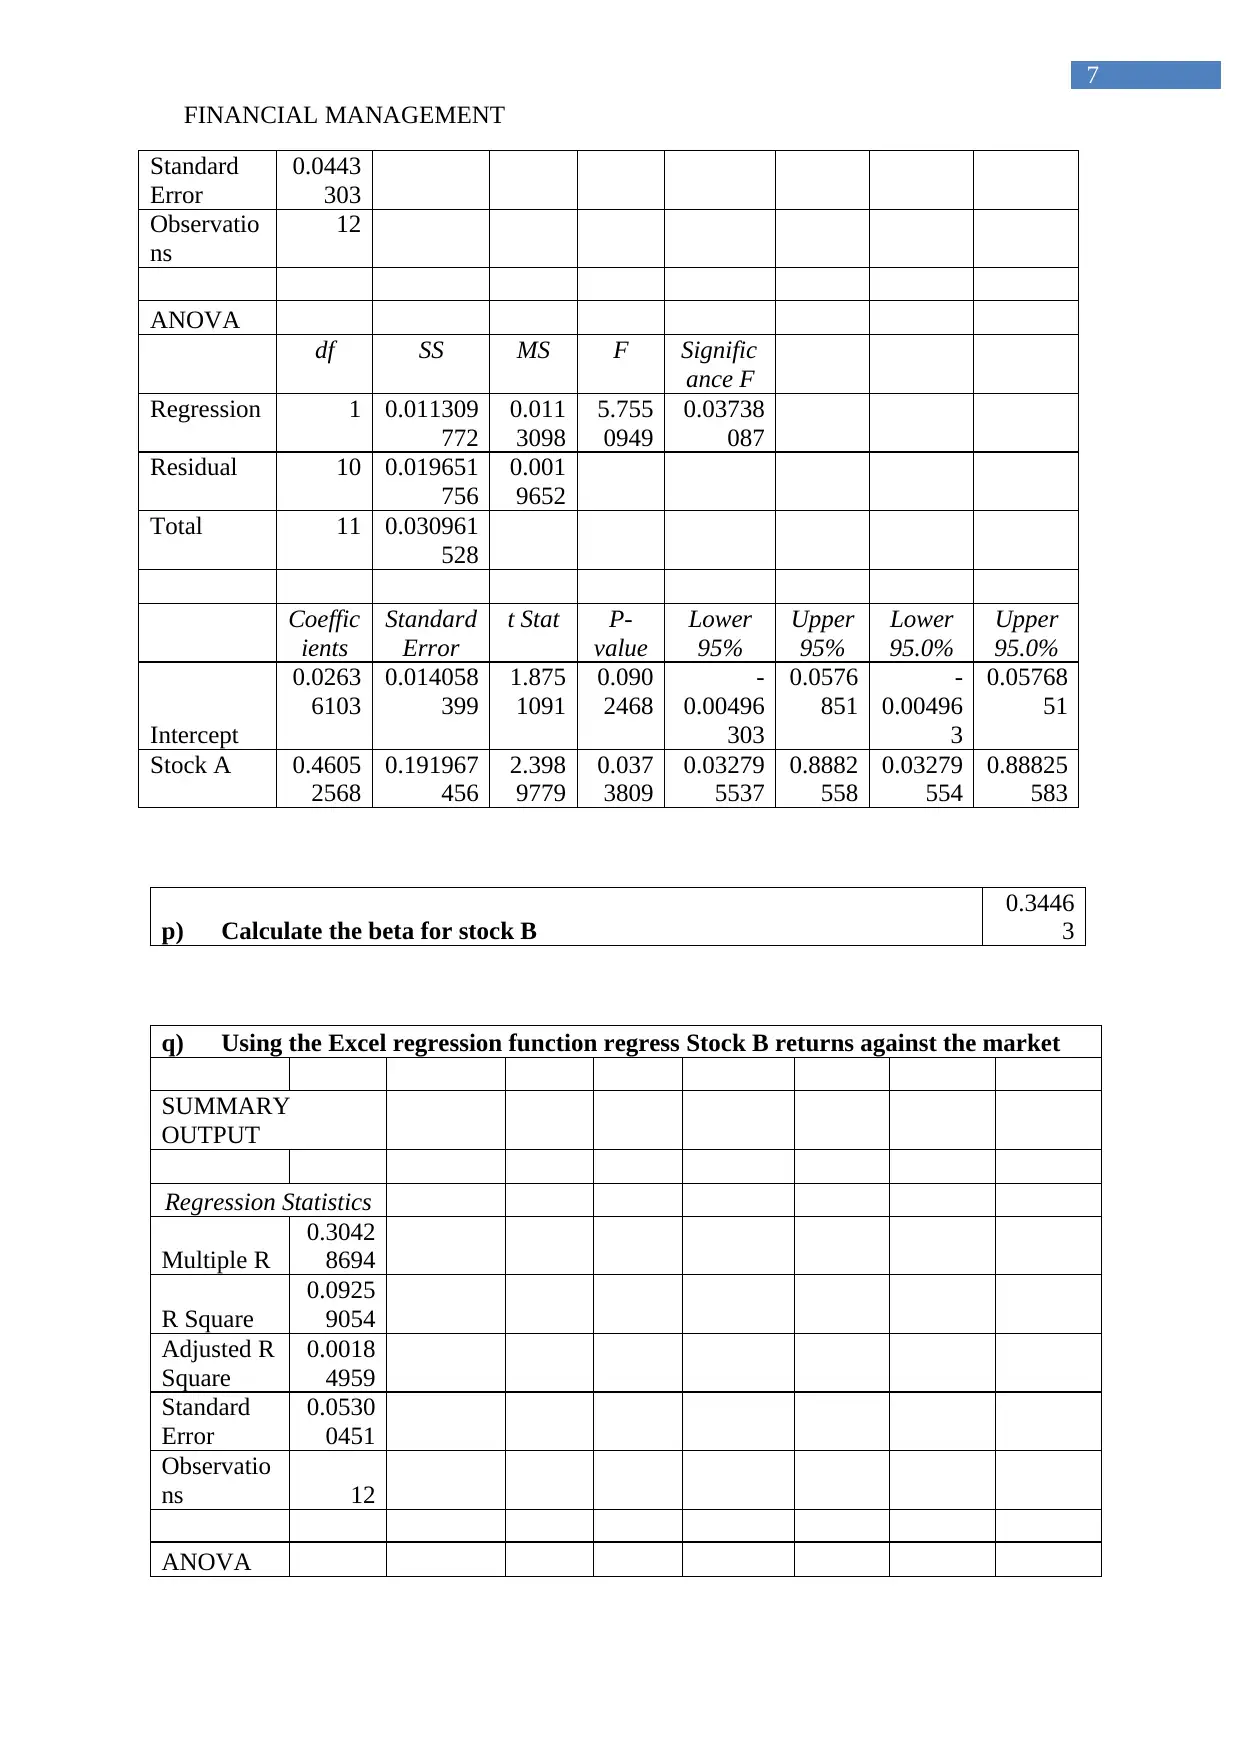
Standard
Error
0.0443
303
Observatio
ns
12
ANOVA
df SS MS F Signific
ance F
Regression 1 0.011309
772
0.011
3098
5.755
0949
0.03738
087
Residual 10 0.019651
756
0.001
9652
Total 11 0.030961
528
Coeffic
ients
Standard
Error
t Stat P-
value
Lower
95%
Upper
95%
Lower
95.0%
Upper
95.0%
Intercept
0.0263
6103
0.014058
399
1.875
1091
0.090
2468
-
0.00496
303
0.0576
851
-
0.00496
3
0.05768
51
Stock A 0.4605
2568
0.191967
456
2.398
9779
0.037
3809
0.03279
5537
0.8882
558
0.03279
554
0.88825
583
p) Calculate the beta for stock B
0.3446
3
q) Using the Excel regression function regress Stock B returns against the market
SUMMARY
OUTPUT
Regression Statistics
Multiple R
0.3042
8694
R Square
0.0925
9054
Adjusted R
Square
0.0018
4959
Standard
Error
0.0530
0451
Observatio
ns 12
ANOVA
7
Standard
Error
0.0443
303
Observatio
ns
12
ANOVA
df SS MS F Signific
ance F
Regression 1 0.011309
772
0.011
3098
5.755
0949
0.03738
087
Residual 10 0.019651
756
0.001
9652
Total 11 0.030961
528
Coeffic
ients
Standard
Error
t Stat P-
value
Lower
95%
Upper
95%
Lower
95.0%
Upper
95.0%
Intercept
0.0263
6103
0.014058
399
1.875
1091
0.090
2468
-
0.00496
303
0.0576
851
-
0.00496
3
0.05768
51
Stock A 0.4605
2568
0.191967
456
2.398
9779
0.037
3809
0.03279
5537
0.8882
558
0.03279
554
0.88825
583
p) Calculate the beta for stock B
0.3446
3
q) Using the Excel regression function regress Stock B returns against the market
SUMMARY
OUTPUT
Regression Statistics
Multiple R
0.3042
8694
R Square
0.0925
9054
Adjusted R
Square
0.0018
4959
Standard
Error
0.0530
0451
Observatio
ns 12
ANOVA
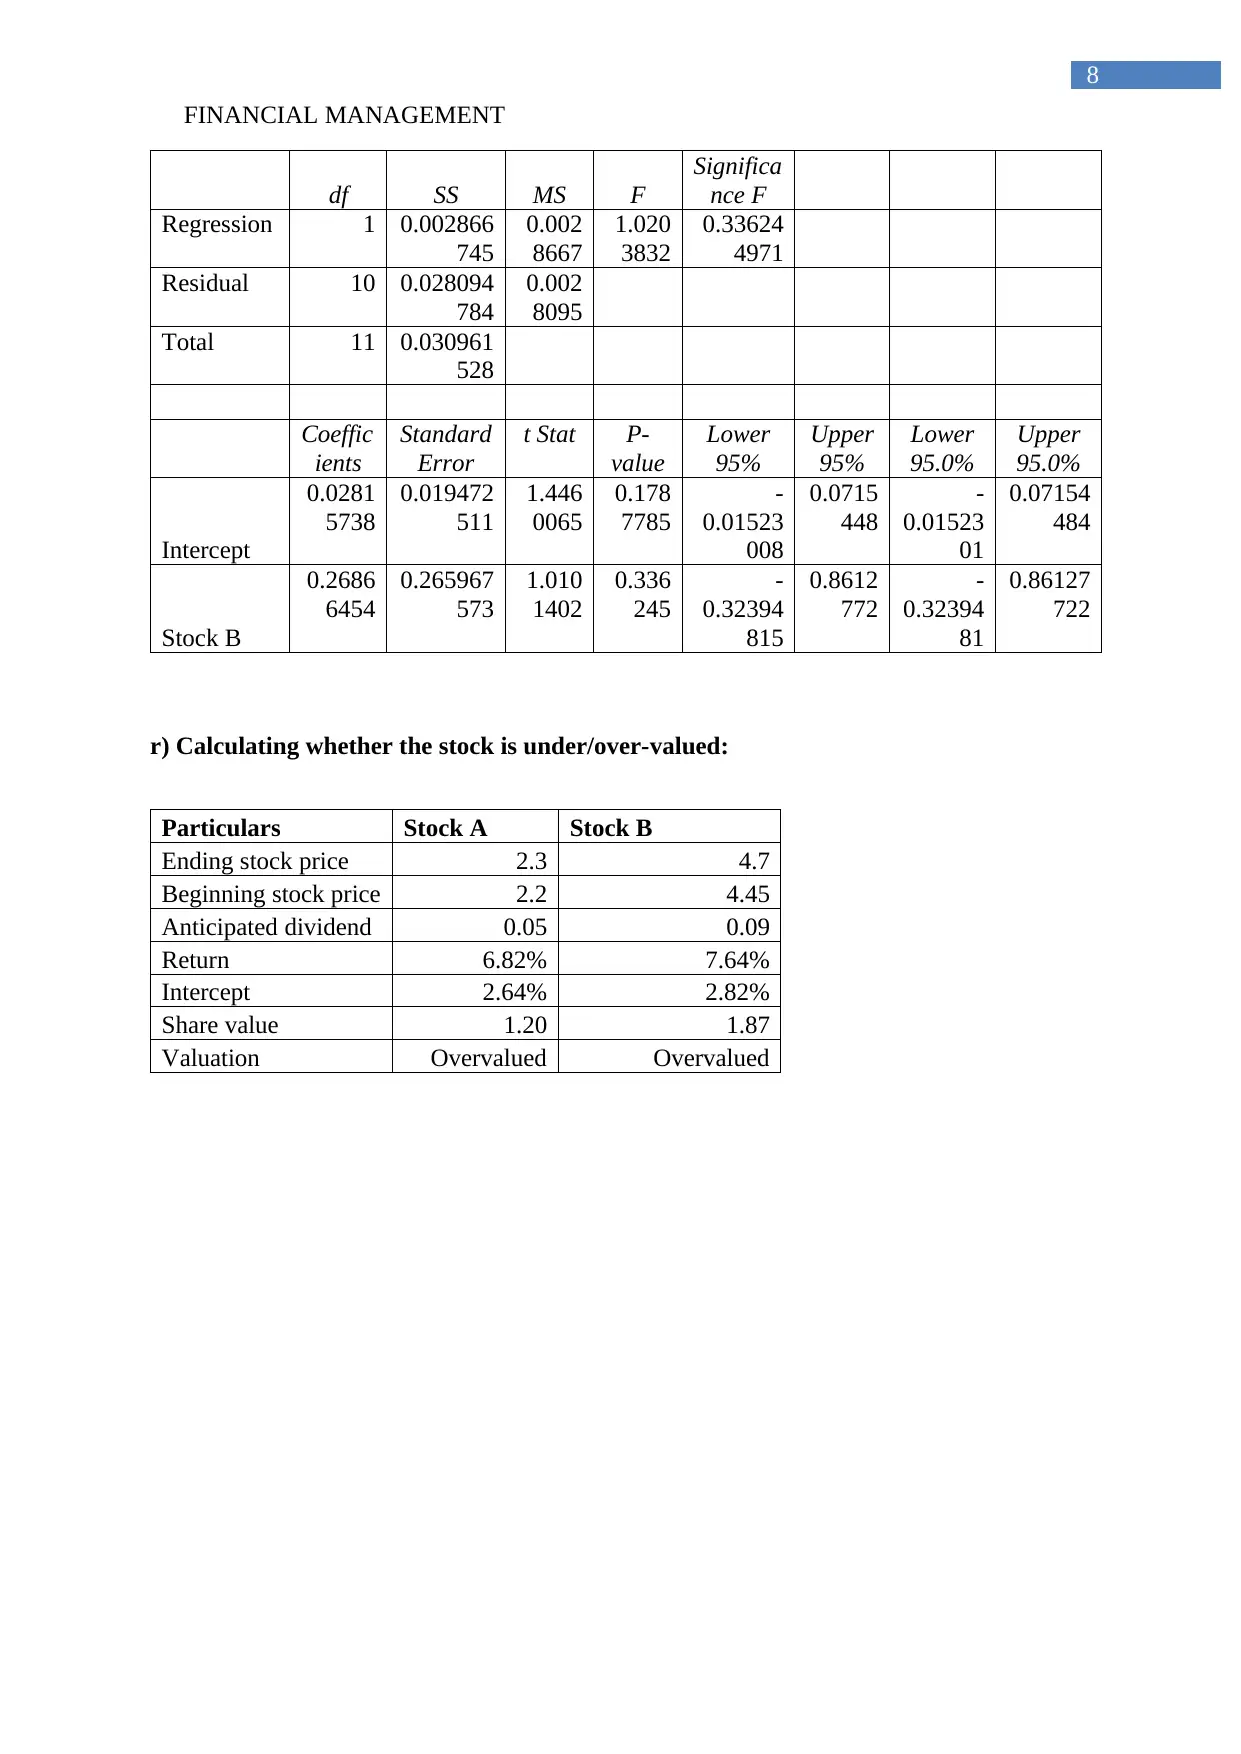
FINANCIAL MANAGEMENT
8
df SS MS F
Significa
nce F
Regression 1 0.002866
745
0.002
8667
1.020
3832
0.33624
4971
Residual 10 0.028094
784
0.002
8095
Total 11 0.030961
528
Coeffic
ients
Standard
Error
t Stat P-
value
Lower
95%
Upper
95%
Lower
95.0%
Upper
95.0%
Intercept
0.0281
5738
0.019472
511
1.446
0065
0.178
7785
-
0.01523
008
0.0715
448
-
0.01523
01
0.07154
484
Stock B
0.2686
6454
0.265967
573
1.010
1402
0.336
245
-
0.32394
815
0.8612
772
-
0.32394
81
0.86127
722
r) Calculating whether the stock is under/over-valued:
Particulars Stock A Stock B
Ending stock price 2.3 4.7
Beginning stock price 2.2 4.45
Anticipated dividend 0.05 0.09
Return 6.82% 7.64%
Intercept 2.64% 2.82%
Share value 1.20 1.87
Valuation Overvalued Overvalued
FINANCIAL MANAGEMENT
9
Bibliography:
Baker, M., & Wurgler, J. (2015). Do strict capital requirements raise the cost of capital? Bank
regulation, capital structure, and the low-risk anomaly. American Economic
Review, 105(5), 315-20.
Balios, D., Daskalakis, N., Eriotis, N., & Vasiliou, D. (2016). SMEs capital structure
determinants during severe economic crisis: The case of Greece. Cogent Economics &
Finance, 4(1), 1145535.
Berger, P. G., Chen, H. J., & Li, F. (2018). Firm specific information and the cost of equity
capital. Feng, Firm Specific Information and the Cost of Equity Capital (April 2,
2018).
Core, J. E., Hail, L., & Verdi, R. S. (2015). Mandatory disclosure quality, inside ownership,
and cost of capital. European Accounting Review, 24(1), 1-29.
Daskalakis, N., Balios, D., & Dalla, V. (2017). The behaviour of SMEs' capital structure
determinants in different macroeconomic states. Journal of Corporate Finance, 46,
248-260.
Frank, M. Z., & Shen, T. (2016). Investment and the weighted average cost of
capital. Journal of Financial Economics, 119(2), 300-315.
Graham, J. R., Leary, M. T., & Roberts, M. R. (2015). A century of capital structure: The
leveraging of corporate America. Journal of Financial Economics, 118(3), 658-683.
Hadi, A. R. A., & Suryanto, T. (2017). Capital Structure Determinants: Evidence From
Palestine and Egypt Stock Exchanges. IKONOMIKA, 1(2), 118-130.
Secure Best Marks with AI Grader
Need help grading? Try our AI Grader for instant feedback on your assignments.
FINANCIAL MANAGEMENT
10
Kanatani, M., & Yaghoubi, R. (2017). Determinants of Corporate Capital Structure in New
Zealand. AMR, 1.
Maillet, B., Tokpavi, S., & Vaucher, B. (2015). Global minimum variance portfolio
optimisation under some model risk: A robust regression-based approach. European
Journal of Operational Research, 244(1), 289-299.
Onaolapo, A. A., Kajola, S. O., & Nwidobie, M. B. (2015). Determinants of capital structure:
A study of Nigerian quoted companies. Methodology, 7, 23.
Yang, L., Couillet, R., & McKay, M. R. (2015). A robust statistics approach to minimum
variance portfolio optimization. IEEE Transactions on Signal Processing, 63(24),
6684-6697.
1 out of 11
Related Documents

![[SOLVED] JB HiFi Ltd Investment Analysis](/_next/image/?url=https%3A%2F%2Fdesklib.com%2Fmedia%2Fimages%2Fwh%2F8a736aa746774d07b1a1dbe34576782e.jpg&w=256&q=75)


Your All-in-One AI-Powered Toolkit for Academic Success.
+13062052269
info@desklib.com
Available 24*7 on WhatsApp / Email
![[object Object]](/_next/static/media/star-bottom.7253800d.svg)
Unlock your academic potential
© 2024 | Zucol Services PVT LTD | All rights reserved.