Numerical Data Analysis and Calculations
VerifiedAdded on 2020/09/17
|11
|1557
|33
AI Summary
This assignment provides a detailed guide on numerical data analysis and calculations. It includes questions on calculating percentage increase, finding the mean, median, and range of a set of numbers, as well as analyzing an index value and creating a per-week time table. The questions are designed to test understanding of various mathematical concepts and their applications in real-world scenarios.
Contribute Materials
Your contribution can guide someone’s learning journey. Share your
documents today.
Numeracy 1
Secure Best Marks with AI Grader
Need help grading? Try our AI Grader for instant feedback on your assignments.
TABLE OF CONTENTS
SECTION 1......................................................................................................................................1
TASK 1...................................................................................................................................1
Skills audit..............................................................................................................................1
TASK 2...................................................................................................................................1
Q1 Reflection..........................................................................................................................1
Q2 Real-life situation based on order of operations..............................................................1
SECTION 2......................................................................................................................................2
TASK 1 ..................................................................................................................................2
Skills Audit.............................................................................................................................2
TASK 2............................................................................................................................................2
Q1 Reflection..........................................................................................................................2
Q2 Real-life situation based on Percentages.........................................................................2
SECTION 3......................................................................................................................................2
TASK 1 ..................................................................................................................................2
Skills Audit.............................................................................................................................2
TASK 2............................................................................................................................................3
Q1 Reflection..........................................................................................................................3
Q2 Real-life situation based on Graph..................................................................................3
SECTION 4......................................................................................................................................3
Q1 FTSE index.......................................................................................................................3
Q2 Percentage increase...........................................................................................................4
Q3 Real net worth...................................................................................................................4
Q4 Pie chart............................................................................................................................4
Q5 Bar chart...........................................................................................................................5
Q6 Doctors change over period..............................................................................................5
Q7 Managers..........................................................................................................................5
Q8 Mean, median, range........................................................................................................5
Q9 Percentage change............................................................................................................6
Q10 Statement outlining the changes ....................................................................................6
Q11 Mean, median and range.................................................................................................6
Q12 Index value.....................................................................................................................7
Q13 Canada index..................................................................................................................7
Q14 Relative position of countries on basis of index.............................................................7
Q15 Per week time table.........................................................................................................8
SECTION 1
TASK 1
Skills audit
The BODMAS stands for Brackets Open first Division Multiplication Addition
Subtraction. I'm able to apply BODMAS rule in different aspects of my problem. However,
while defining fractions, numerator and denominator, I 'm not as good as others. I 'm not sure
that I can define mixed number and improper fractions. I can convert mixed number to improper
fractions. Further, I can convert vice versa as well. However, I can solve division, multiplication,
addition and subtraction. I m, need to have practice to improve calculations of ratios.
TASK 2
Q1 Reflection
The BODMAS rule is one of the basic rule of solving mathematical problems. I had
learned this rule and I'm applying the rule in my day to day problems. Further, I have learned
ratios in my classroom learning and I'm able to prepare several ratios as well. I have also learnt
to solve mixed numbers questions and I' m able to convert mixed number to improper fractions
as well. This has helped in my area of improvement to solve various mathematical related
problems.
Q2 Real-life situation based on order of operations
In a classroom ,the ratio between boys and girls are 6 : 8. The total number of students in
the class is 58. Find out the number of boys in the classroom. To do the problem,firstly add up
the ratios' given.
= 6 + 8 = 14
The total number of students in the class= 58
To find out the ratio boys and girls. Divide the number of students in classroom by the sum of
ratio of boys and girls individually.
Number of boys= 6 / 14 * 58 = 25
Number of the girls = 8 / 14 * 58 = 33
This means the number of the boys in class=25
To check the answer, add the number of the boys and girls = 25 + 33 = 58
1
Secure Best Marks with AI Grader
Need help grading? Try our AI Grader for instant feedback on your assignments.
SECTION 2
TASK 1
Skills Audit
I need to practice so that I may solve relationship between fractions, decimals and
percentages. Along with this, I need improvement in identifying decimal and fraction equivalent.
I' m able to follow concepts to solve problems. I can apply formulas to solve questions. I cannot
construct simple index and interpretations of it.
TASK 2
Q1 Reflection
I need to practice a lot so that I can solve simple index. My areas of improvement consist
of identifying decimal and fraction equivalent. I need to work upon them.
Q2 Real-life situation based on Percentages
Adam needs 30% to pass. If he scored 213 and falls short by 12 marks, what is maximum
number of marks he could have obtained?
A. Adam required 213+13 = 225
Let maximum marks be x
Then, 30%v of x= 225
x= 225* 30/100
x= 67.5 % to pass
SECTION 3
TASK 1
Skills Audit
I know how to calculate mean, median, mode and range. I understand statistical
implications of these methods. Therefore, I can construct line graph, bar and pie chart. But I
cannot interpret conclusions from it.
2
TASK 1
Skills Audit
I need to practice so that I may solve relationship between fractions, decimals and
percentages. Along with this, I need improvement in identifying decimal and fraction equivalent.
I' m able to follow concepts to solve problems. I can apply formulas to solve questions. I cannot
construct simple index and interpretations of it.
TASK 2
Q1 Reflection
I need to practice a lot so that I can solve simple index. My areas of improvement consist
of identifying decimal and fraction equivalent. I need to work upon them.
Q2 Real-life situation based on Percentages
Adam needs 30% to pass. If he scored 213 and falls short by 12 marks, what is maximum
number of marks he could have obtained?
A. Adam required 213+13 = 225
Let maximum marks be x
Then, 30%v of x= 225
x= 225* 30/100
x= 67.5 % to pass
SECTION 3
TASK 1
Skills Audit
I know how to calculate mean, median, mode and range. I understand statistical
implications of these methods. Therefore, I can construct line graph, bar and pie chart. But I
cannot interpret conclusions from it.
2
TASK 2
Q1 Reflection
I need to practice about drawing out interpretations from the bar and pie charts. Else, I
can compute mean, median, mode and range.
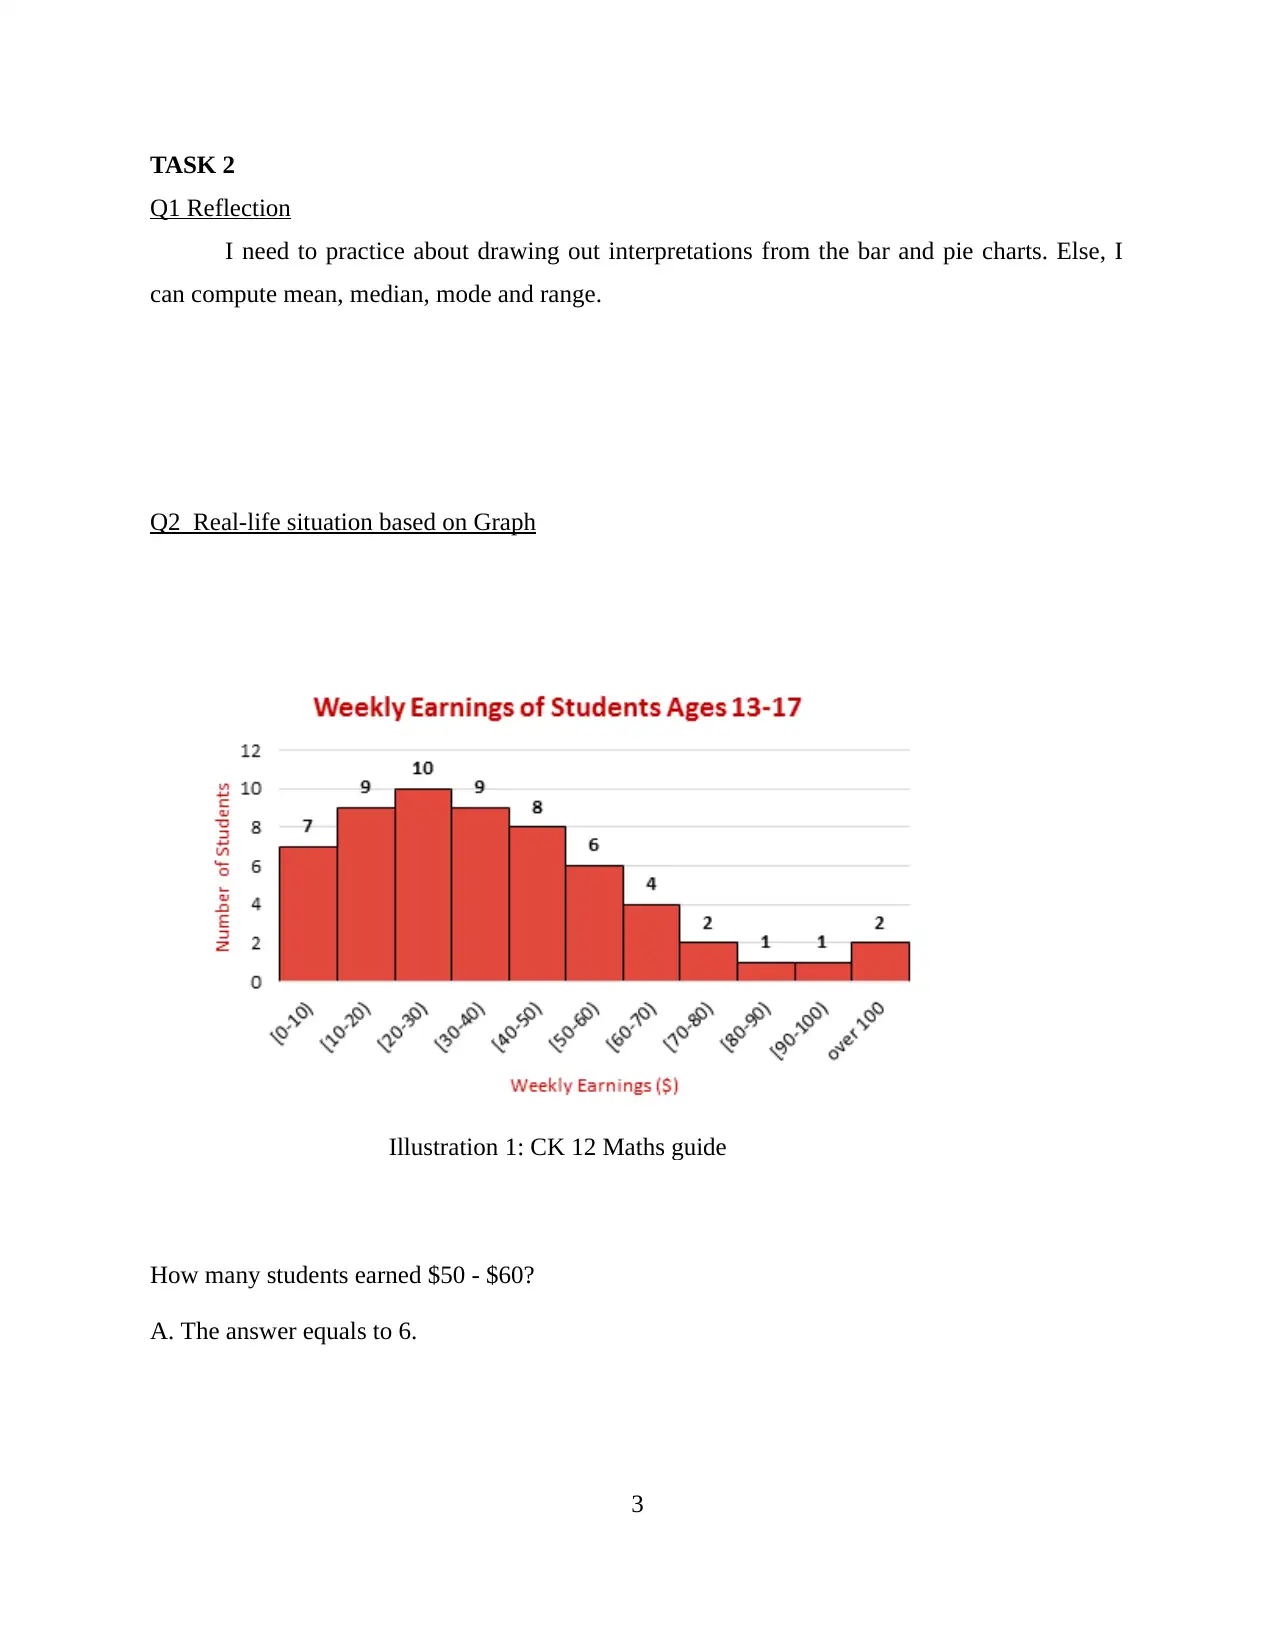
Q2 Real-life situation based on Graph
How many students earned $50 - $60?
A. The answer equals to 6.
3
Illustration 1: CK 12 Maths guide
Q1 Reflection
I need to practice about drawing out interpretations from the bar and pie charts. Else, I
can compute mean, median, mode and range.
Q2 Real-life situation based on Graph
How many students earned $50 - $60?
A. The answer equals to 6.
3
Illustration 1: CK 12 Maths guide
SECTION 4
Q1 FTSE index
1521.4 in 1994, increase by 58.5%
= 1521.4*58.5/100+ 1521.4
= 890.01+1521.4
= 2411.41
Q2 Percentage increase
Wealth in 1996= 18.5 billions
Wealth in 2017= 89.2 billions
Therefore, percentage change of formula will be applied
= 70.7 / 18.5 = 3.82
= 3.82 * 100 = 382 % increase in wealth
Q3 Real net worth
Wealth in 2017= 5.1, 70%v more than real worth in 2005
Therefore, real worth in 2005= =5.1*100/17
= £3 billion
Q4 Pie chart
a) coal
b) Wind
c) The total energy consumption =100%.To find the unclear, firstly add all the percentages of
other energy sources showed on the pie chart.
= wind (2%)+coal(20%)+oil(34%)+gas(36%)=92%
Subtract the value from the answer.
100-92=8
The percentage of nuclear= 8%
4
Paraphrase This Document
Need a fresh take? Get an instant paraphrase of this document with our AI Paraphraser
d) To find the terawatt hours of gas, workout the percentage of gas represented from the total
amount of terawatt hours consumed.
=36% of 2,249
=0.36*2249=810 terawatt hours ( 809.64)
e) To solve the question ,firstly need to find out terawatt hours of oil and coal.
Terawatt hours of oil=0.34%*2,249=765 (764.66)
Terawatt hours of coal =0.20%*2,249=449 (449.8)
To find out how many more terawatt produced by oil, substract the values.
=765-450=315 more terawatt hours.
Q5 Bar chart
a) 42 %
b) Oil consumed in 1990=25%
Oil consumed in 2010=45%
=45%-25% =20% more oil consumed in 2010
c) 25 %
Q6 Doctors change over period
Doctors= 915637
Total= 10203984
= 915637/10203984*100
= 8.9 % are doctors
Q7 Managers
In 2014, fell by 12%
= 32429 *12.12%= 3930.39
= 32429 - 3930.09
= 28499
5
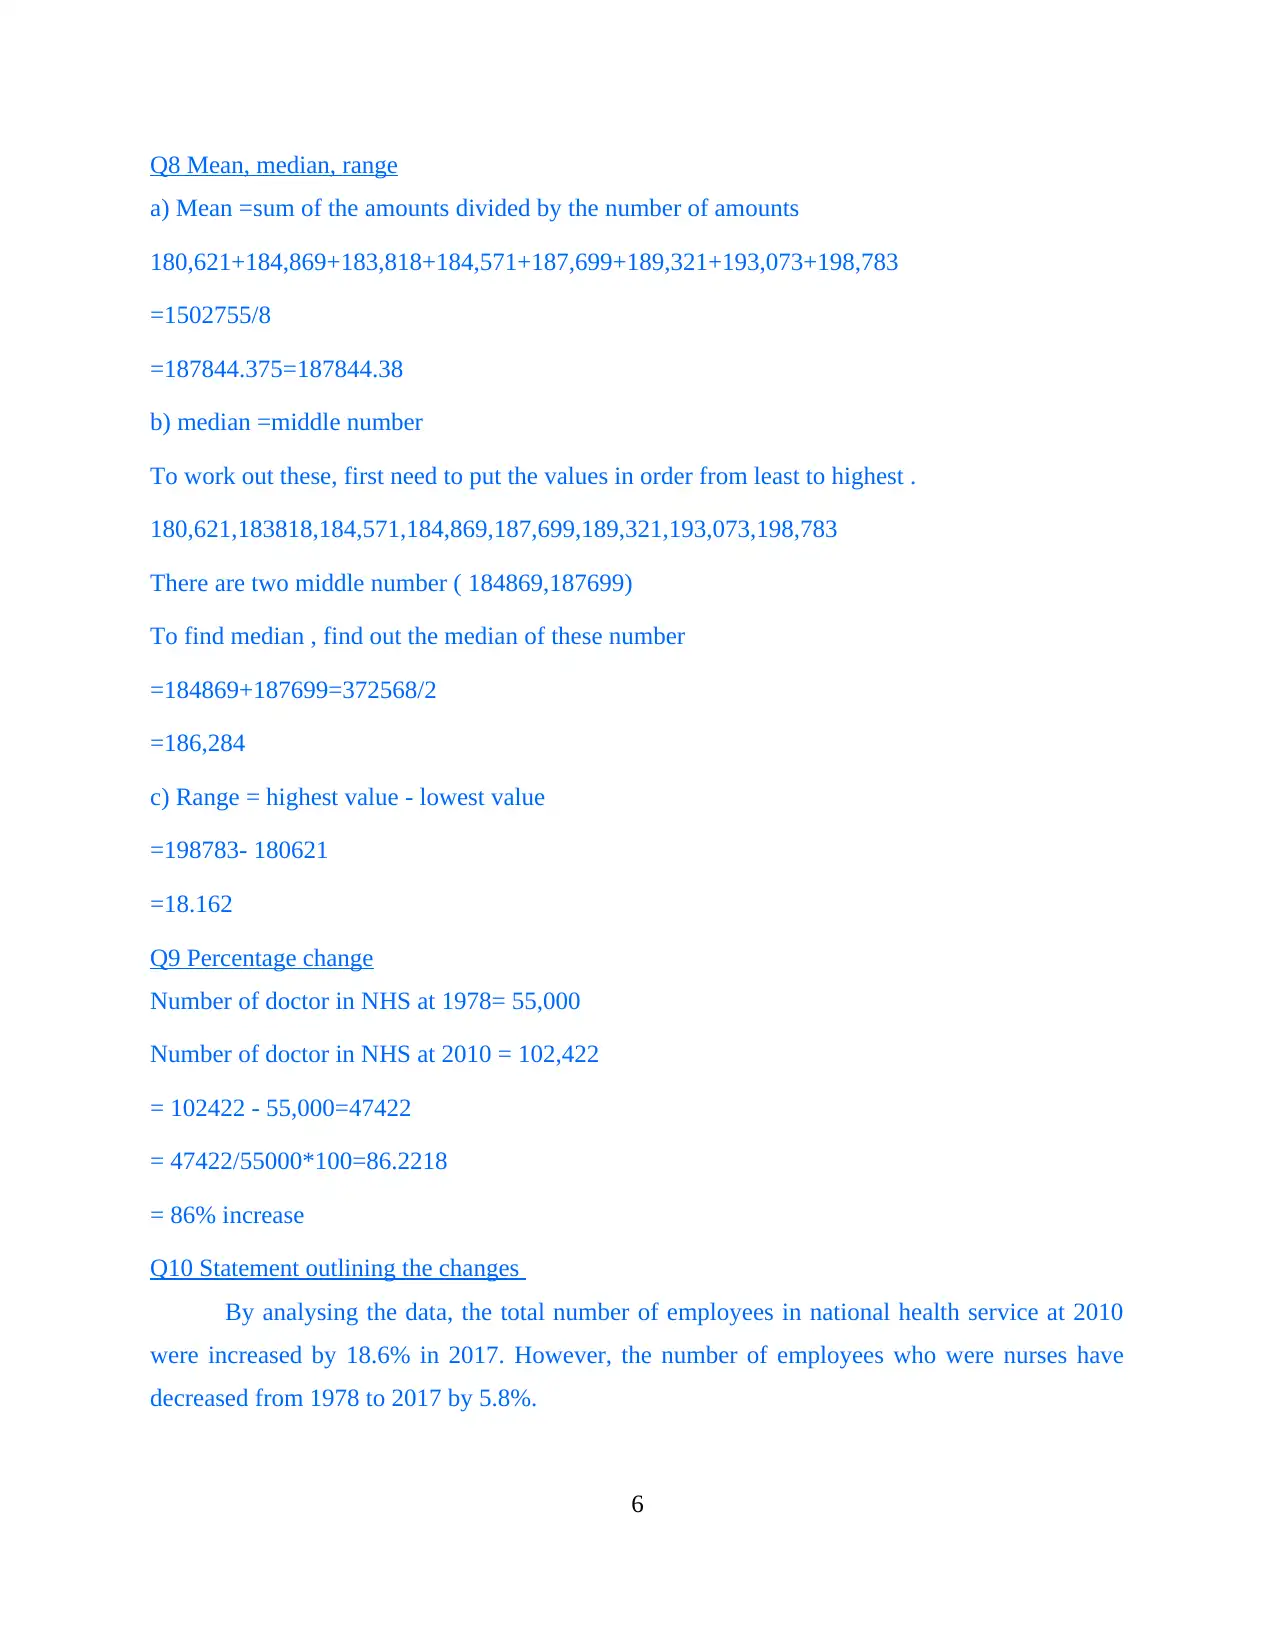
Q8 Mean, median, range
a) Mean =sum of the amounts divided by the number of amounts
180,621+184,869+183,818+184,571+187,699+189,321+193,073+198,783
=1502755/8
=187844.375=187844.38
b) median =middle number
To work out these, first need to put the values in order from least to highest .
180,621,183818,184,571,184,869,187,699,189,321,193,073,198,783
There are two middle number ( 184869,187699)
To find median , find out the median of these number
=184869+187699=372568/2
=186,284
c) Range = highest value - lowest value
=198783- 180621
=18.162
Q9 Percentage change
Number of doctor in NHS at 1978= 55,000
Number of doctor in NHS at 2010 = 102,422
= 102422 - 55,000=47422
= 47422/55000*100=86.2218
= 86% increase
Q10 Statement outlining the changes
By analysing the data, the total number of employees in national health service at 2010
were increased by 18.6% in 2017. However, the number of employees who were nurses have
decreased from 1978 to 2017 by 5.8%.
6
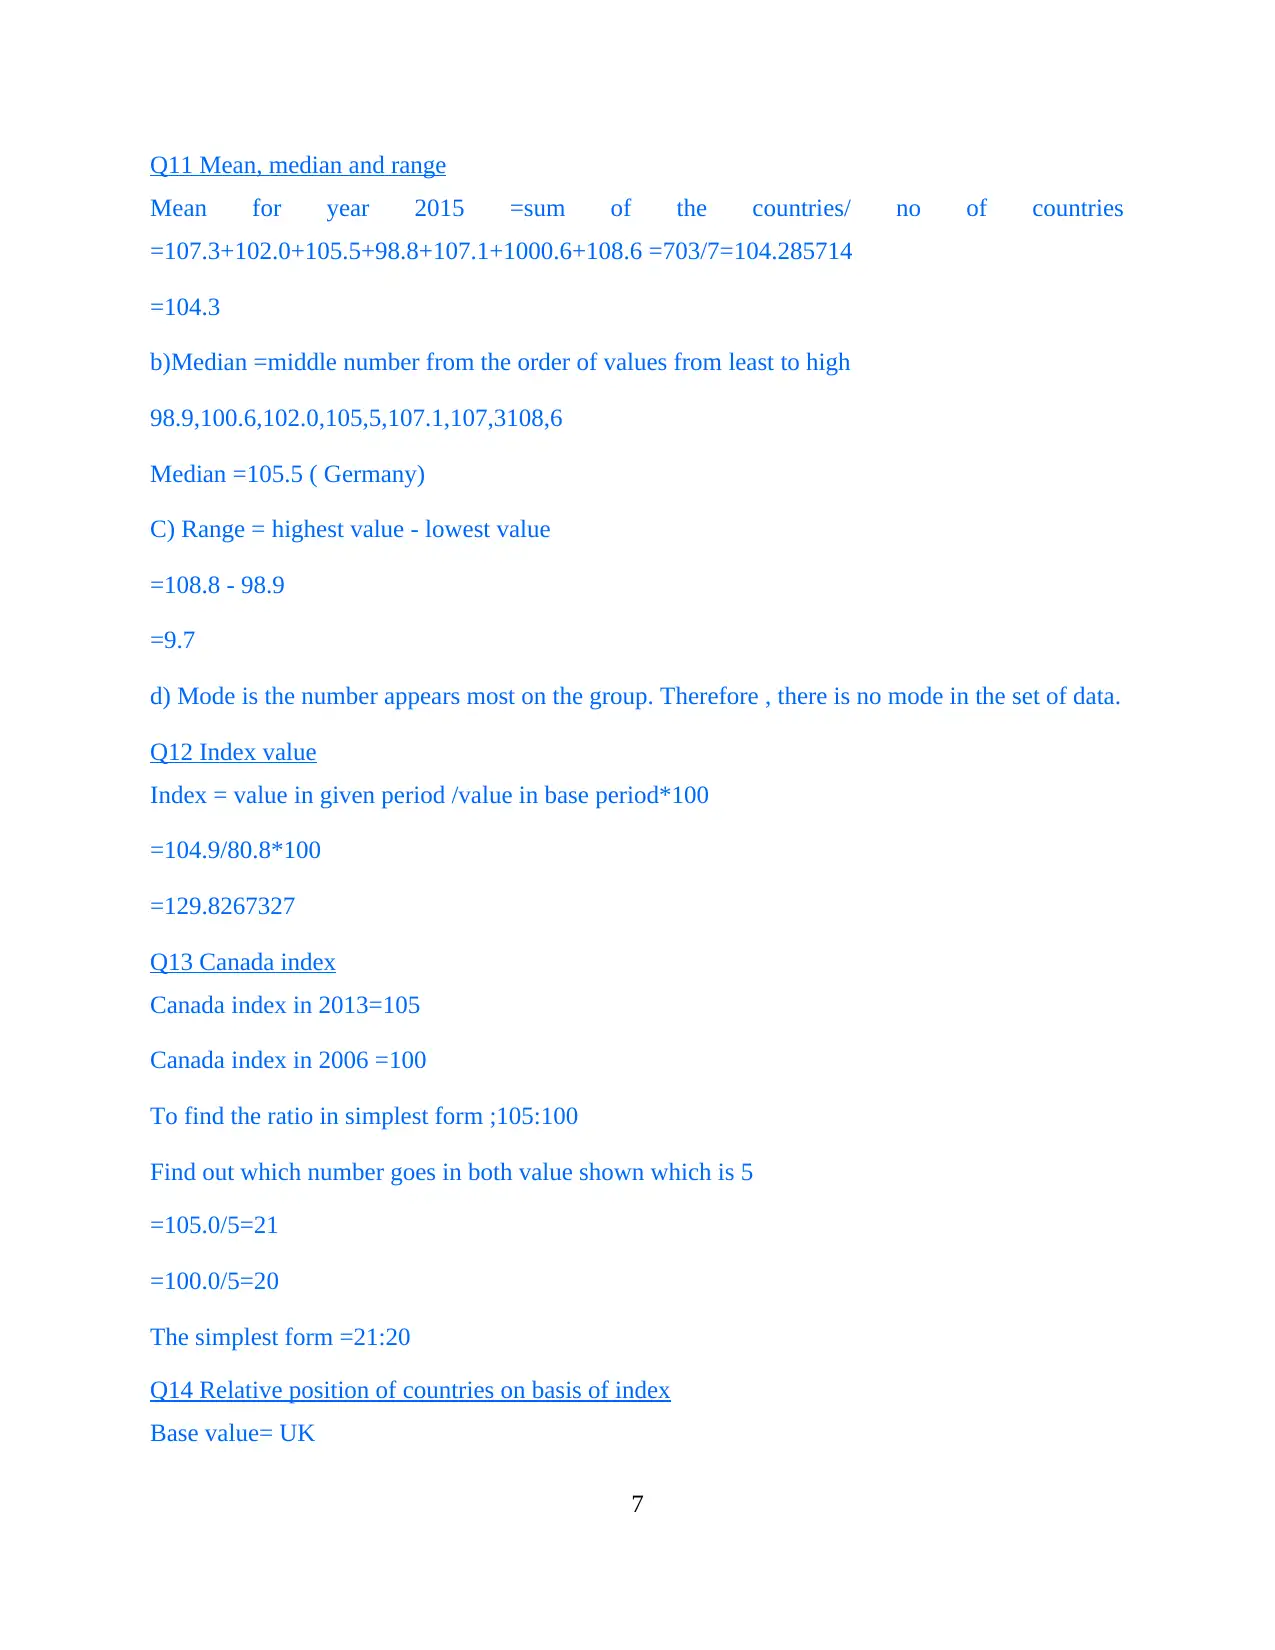
Q11 Mean, median and range
Mean for year 2015 =sum of the countries/ no of countries
=107.3+102.0+105.5+98.8+107.1+1000.6+108.6 =703/7=104.285714
=104.3
b)Median =middle number from the order of values from least to high
98.9,100.6,102.0,105,5,107.1,107,3108,6
Median =105.5 ( Germany)
C) Range = highest value - lowest value
=108.8 - 98.9
=9.7
d) Mode is the number appears most on the group. Therefore , there is no mode in the set of data.
Q12 Index value
Index = value in given period /value in base period*100
=104.9/80.8*100
=129.8267327
Q13 Canada index
Canada index in 2013=105
Canada index in 2006 =100
To find the ratio in simplest form ;105:100
Find out which number goes in both value shown which is 5
=105.0/5=21
=100.0/5=20
The simplest form =21:20
Q14 Relative position of countries on basis of index
Base value= UK
7
Secure Best Marks with AI Grader
Need help grading? Try our AI Grader for instant feedback on your assignments.
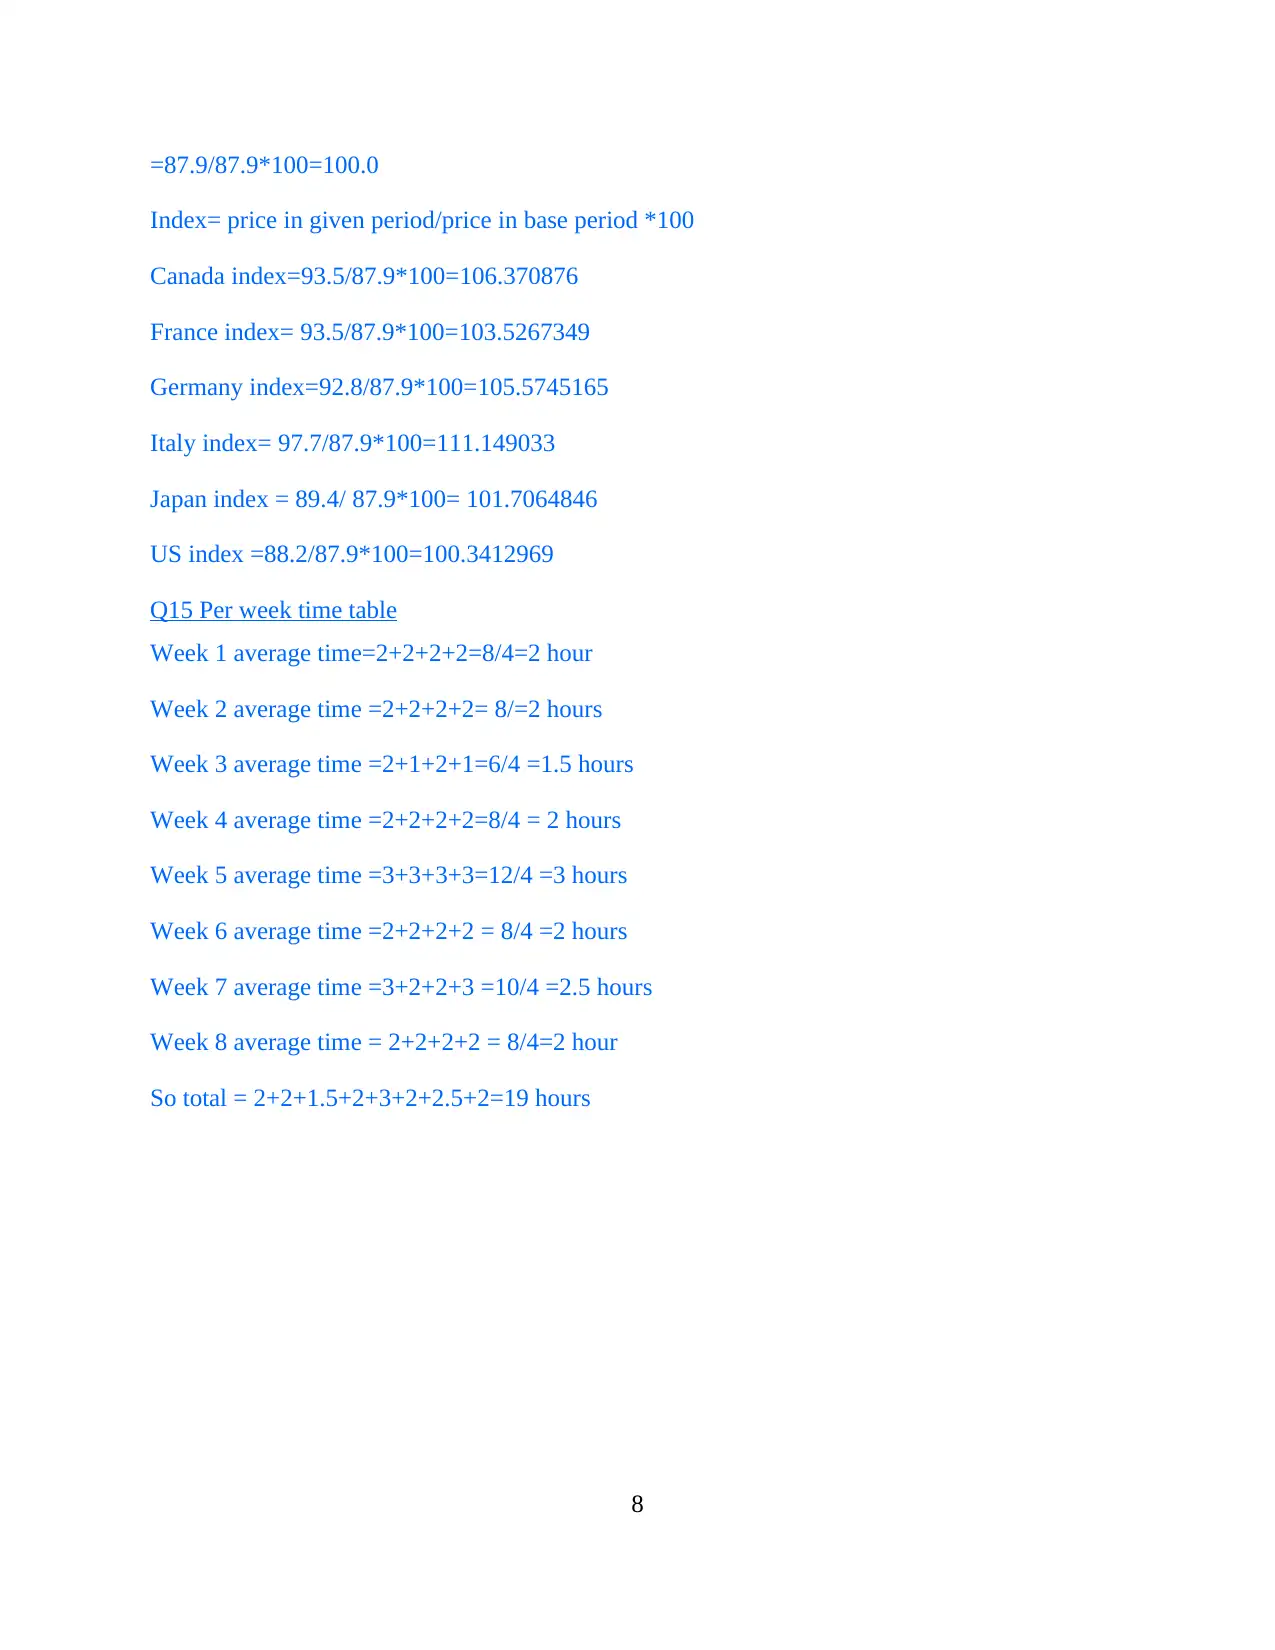
=87.9/87.9*100=100.0
Index= price in given period/price in base period *100
Canada index=93.5/87.9*100=106.370876
France index= 93.5/87.9*100=103.5267349
Germany index=92.8/87.9*100=105.5745165
Italy index= 97.7/87.9*100=111.149033
Japan index = 89.4/ 87.9*100= 101.7064846
US index =88.2/87.9*100=100.3412969
Q15 Per week time table
Week 1 average time=2+2+2+2=8/4=2 hour
Week 2 average time =2+2+2+2= 8/=2 hours
Week 3 average time =2+1+2+1=6/4 =1.5 hours
Week 4 average time =2+2+2+2=8/4 = 2 hours
Week 5 average time =3+3+3+3=12/4 =3 hours
Week 6 average time =2+2+2+2 = 8/4 =2 hours
Week 7 average time =3+2+2+3 =10/4 =2.5 hours
Week 8 average time = 2+2+2+2 = 8/4=2 hour
So total = 2+2+1.5+2+3+2+2.5+2=19 hours
8
1 out of 11
Related Documents


Your All-in-One AI-Powered Toolkit for Academic Success.
+13062052269
info@desklib.com
Available 24*7 on WhatsApp / Email
![[object Object]](/_next/static/media/star-bottom.7253800d.svg)
Unlock your academic potential
© 2024 | Zucol Services PVT LTD | All rights reserved.