Understanding the Slope Coefficient and its Implications

Verified

Added on  2019/09/26

|5
|1500
|167
Report
AI Summary
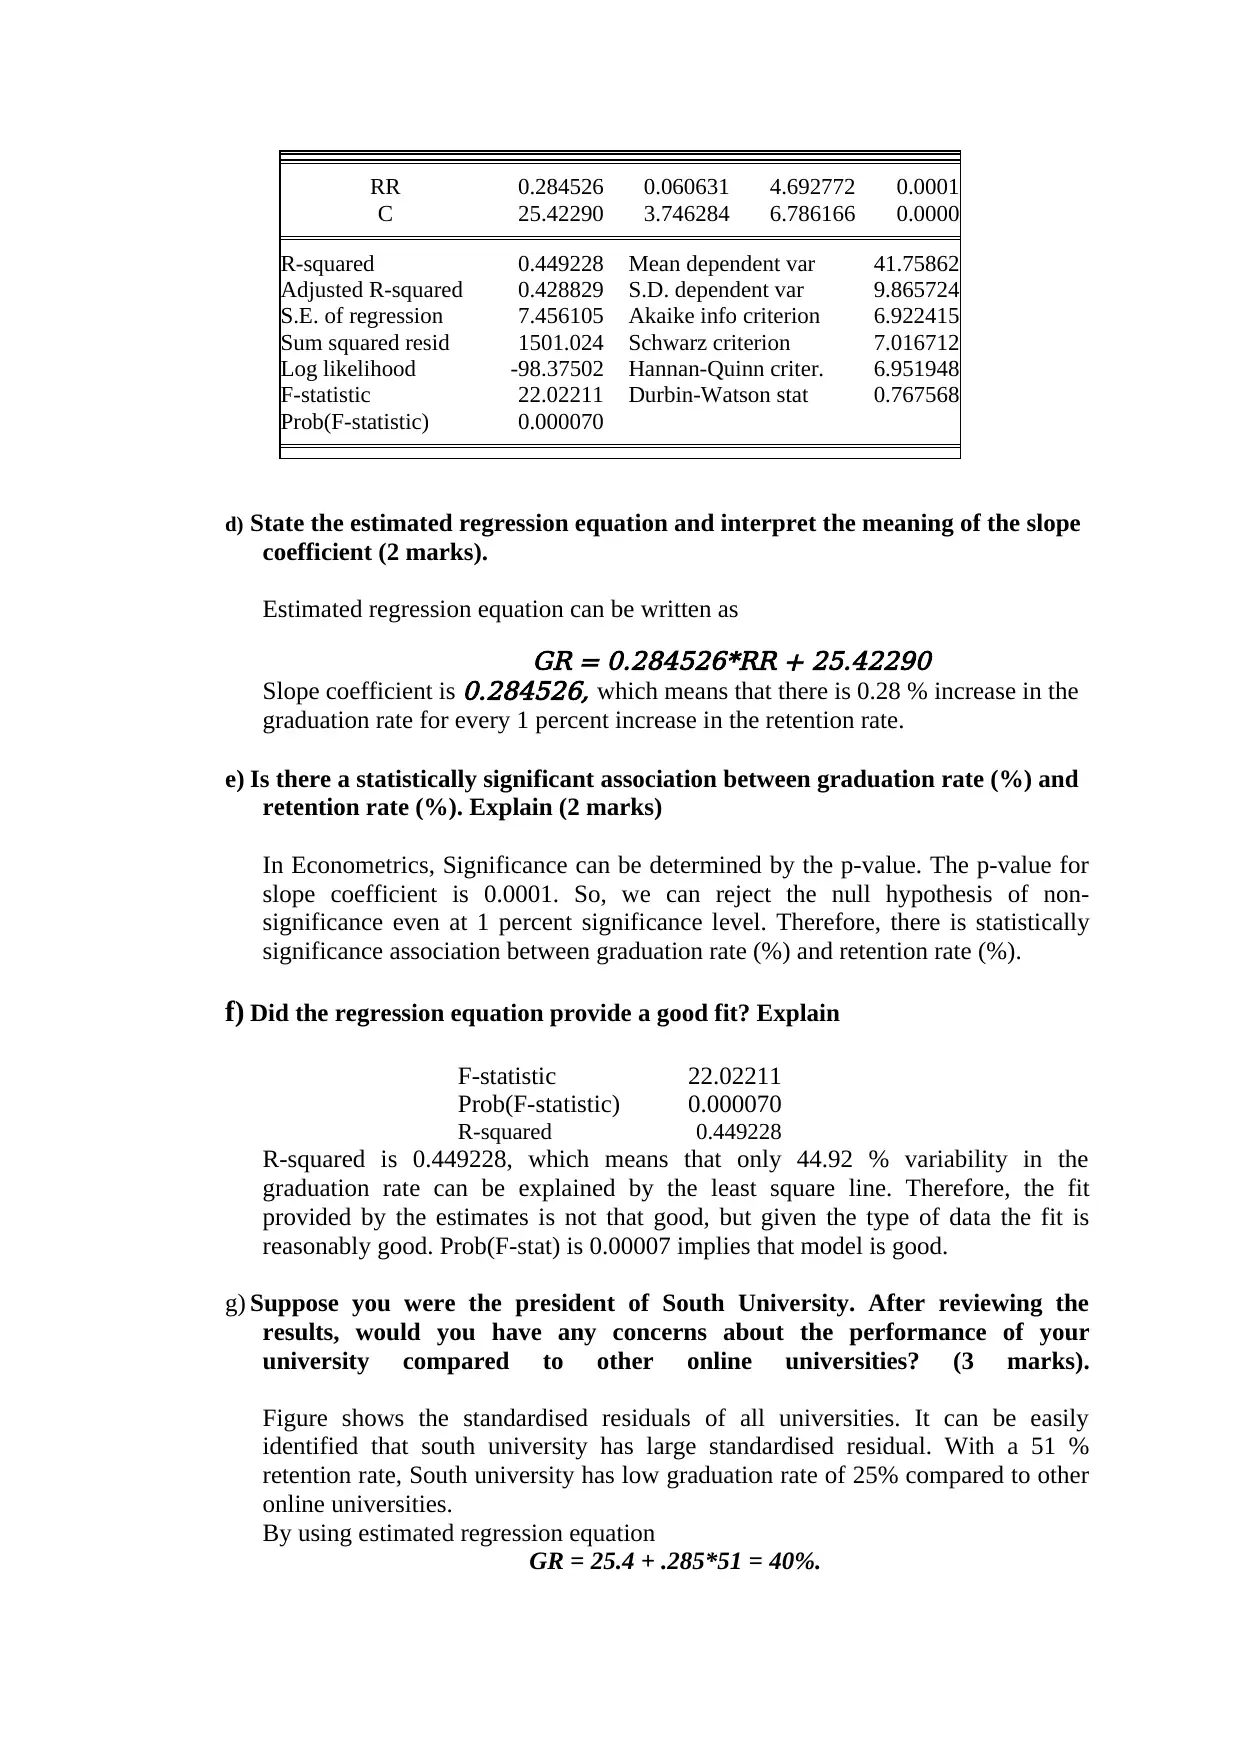
A regression analysis was conducted to examine the relationship between graduation rate and retention rate among online universities. The results showed a statistically significant positive association between the two variables, with a slope coefficient indicating a 0.28% increase in graduation rate for every 1% increase in retention rate. However, the R-squared value of 0.449228 suggests that only 44.92% variability in graduation rate can be explained by the least square line, implying a moderate correlation between the variables.
tabler-icon-diamond-filled.svg

Contribute Materials

Your contribution can guide someone’s learning journey. Share your documents today.
Document Page
Assignment
1. Purpose:
The main purpose of this study is to examine the relationship between graduation rate
and retention rate. This paper presents a linear regression analysis and provides
recommendation to improve graduation rate.
2. Background
In the last decade, there is rapid growth of online education compared to conventional
ways of learning. Ease of accessibility is one of the main reasons in the rapid growth
of online education. Most of the past researches suggests that financial downturn has
expanded interest for online courses. This study is planned to focus on specific two
variables: graduation rate and retention rate. Graduation rate is the percentage of first
year undergraduate students, who complete their programme within 150% of the
published time for the program. Retention rate is the percentage of first time, first-
year undergraduate students who continue study at that university for next year.
3. Methods
This study presents simple linear regression analysis by using data of 29 online
universities. Graduation rate is taken as the dependent variable and retention rate is
taken as the independent variable. Regression model used in this study is given as
GR=β0 + β1 ( RR ) + ε
Where, GR is the Graduation rate and RR is retention rate. β0 is the intercept and
β1 is the slope coefficient . ε is the stochastic error, which is normally distributed with
zero mean and 1 variance.
4. Results
a) Provide a descriptive analysis of the two variables (e.g., mean standard
deviation, minimum and maximum). (2 marks).
Descriptive Analysis of Graduation rate (%) and Retention rate(%) is shown in the
table 1.
Table 1
GR (%) RR(%)
Mean 41.75862 57.41379
Median 39.00000 60.00000
Maximum 61.00000 100.0000
Minimum 25.00000 4.000000
Std. Dev. 9.865724 23.24023
Skewness 0.167108 -0.293654
Kurtosis 2.062566 3.185897
tabler-icon-diamond-filled.svg

Secure Best Marks with AI Grader

Need help grading? Try our AI Grader for instant feedback on your assignments.
Document Page
Jarque-Bera 1.196832 0.458549
Probability 0.549682 0.795110
Sum 1211.000 1665.000
Sum Sq. Dev. 2725.310 15123.03
Observations 29 29
b) Develop a scatter diagram with retention rate as the independent variable.
What does the scatter diagram indicate about the relationship between the
two variables? (3marks)
Figure 1 shows a scatter plot between Graduation rate(%) and retention rate(%).
0 20 40 60 80 100 120
0
10
20
30
40
50
60
70
GR(%) Vs RR(%)
Retention Rate(%)
Graduation Rate(%)
It can be easily observed that there is linear relationship between Graduation
rate(%) and retention rate(%).
c) Estimate a regression equation that can be used to predict the graduation
rate (%) given the retention rate (%) (2 marks).
Regression estimates are shown in the table 2. Graduation rate is the dependent
variable and retention rate is the independent variable.
Dependent Variable: GR
Method: Least Squares
Date: 02/11/19 Time: 07:15
Sample: 1 29
Included observations: 29
Variable Coefficient Std. Error t-Statistic Prob.
Document Page
RR 0.284526 0.060631 4.692772 0.0001
C 25.42290 3.746284 6.786166 0.0000
R-squared 0.449228 Mean dependent var 41.75862
Adjusted R-squared 0.428829 S.D. dependent var 9.865724
S.E. of regression 7.456105 Akaike info criterion 6.922415
Sum squared resid 1501.024 Schwarz criterion 7.016712
Log likelihood -98.37502 Hannan-Quinn criter. 6.951948
F-statistic 22.02211 Durbin-Watson stat 0.767568
Prob(F-statistic) 0.000070
d) State the estimated regression equation and interpret the meaning of the slope
coefficient (2 marks).
Estimated regression equation can be written as
GR = 0.284526*RR + 25.42290
Slope coefficient is
0.284526, which means that there is 0.28 % increase in the
graduation rate for every 1 percent increase in the retention rate.
e) Is there a statistically significant association between graduation rate (%) and
retention rate (%). Explain (2 marks)
In Econometrics, Significance can be determined by the p-value. The p-value for
slope coefficient is 0.0001. So, we can reject the null hypothesis of non-
significance even at 1 percent significance level. Therefore, there is statistically
significance association between graduation rate (%) and retention rate (%).
f) Did the regression equation provide a good fit? Explain
F-statistic 22.02211
Prob(F-statistic) 0.000070
R-squared 0.449228
R-squared is 0.449228, which means that only 44.92 % variability in the
graduation rate can be explained by the least square line. Therefore, the fit
provided by the estimates is not that good, but given the type of data the fit is
reasonably good. Prob(F-stat) is 0.00007 implies that model is good.
g) Suppose you were the president of South University. After reviewing the
results, would you have any concerns about the performance of your
university compared to other online universities? (3 marks).
Figure shows the standardised residuals of all universities. It can be easily
identified that south university has large standardised residual. With a 51 %
retention rate, South university has low graduation rate of 25% compared to other
online universities.
By using estimated regression equation
GR = 25.4 + .285*51 = 40%.
Document Page
South university predicted graduation rate at south university should be 40%. But
there is only 25 % graduation rate at south university. So, the president of south
university should be concerned after looking at the data.
-3
-2
-1
0
1
2
Western International University
South University
University of Phoenix
American InterContinental University
Franklin University
Devry University
Tiffin University
Post University
Peirce College
Everest University
Upper Iowa University
Dickinson State University
Western Governors University
Kaplan University
Salem International University
Ashford University
ITT Technical Institute
Berkeley College
Grand Canyon University
Nova Southeastern University
Westwood College
Everglades University
Liberty University
LeTourneau University
Rasmussen College
Keiser University
Herzing College
National University
Florida National College
Standardized Residuals
h) Suppose you were the president of the University of Phoenix. After reviewing
the results, would you have any concerns about the performance of your
university compared to other online universities? (3 marks)
University of Phoenix has only 4% retention rate, and graduation rate is positively
related to retention rate. Therefore, University of phoenix is largely influenced by
low retention rate. Therefore, the president of the University of Phoenix should
be concerned after looking at the data.
5. Discussion
The scatter plot and linear regression analysis presented in this paper suggest a
positive linear relationship between graduation rate (%) and retention rate (%). Online
universities with higher retention rates tend to have higher graduation rates. Positive
slope coefficient with a p value of 0.00007, implies that retention rate has positive and
significant impact on graduation rate. Two unusual observations are identified in the
tabler-icon-diamond-filled.svg

Secure Best Marks with AI Grader

Need help grading? Try our AI Grader for instant feedback on your assignments.
Document Page
dataset. One observation is of south university and other is of Phoenix university.
South university has low graduation rate compared to other online universities. Based
on the simple regression model graduation rate at south university should be 40%, but
it has only 25 % graduation rate. On the other hand, Phoenix university is largely
influenced by its low retention rate (4%). So, president of both the university should
be concerned by observing the data.
This study considered only 29 online universities data. Due to lack of data, goodness
of fit comes out not that good. Therefore, fit can be improved by considering more
data. One of the important features of scatter diagram is its strength. The strength of
scatter plot can be also categorised into four categories: No correlation, weak
correlation, moderate correlation and strong correlation. Scatter diagram shows that
there is moderate correlation between graduation rate and retention rate.
6. Recommendations
Based on this study, we can provide 3 recommendations to online universities.
i. Graduation rate is positively related with the retention rate. Therefore,
universities should pay attention to improve their retention rate. Higher
retention rate will lead to higher graduation rate. For example, Phoenix
university is largely influenced by low retention rate. So, Phoenix university
should pay attention to improve its retention rate.
ii. The model used in this study is not the best fit. So, other variables can
influence the graduation rate, Therefore, multiple regression analysis should
be used to predict the graduation rate.
iii. The study reveals that there is moderate association between the retention rate
and graduation rate.
7. References:
Hope, J. (2016). Increase graduation rate with tools that promote student planning. The
Successful Registrar, 15(12), pp.6-7.
Schneider, A., Hommel, G. and Blettner, M. (2010). Linear Regression Analysis. Deutsches
Aerzteblatt Online.
Framstad, E., Engen, S. and Stenseth, N. (1985). Regression Analysis, Residual Analysis
and Missing Variables in Regression Models. Oikos, 44(2), p.319.
Booch, G. (2006). Goodness of Fit. IEEE Software, 23(6), pp.14-15.
Boden, G. (2011). Retention and Graduation Rates: Insights from an Extended Longitudinal
View. Journal of College Student Retention: Research, Theory & Practice, 13(2), pp.179-203.
chevron_up_icon
1 out of 5
circle_padding
hide_on_mobile
zoom_out_icon
[object Object]

Your All-in-One AI-Powered Toolkit for Academic Success.

Available 24*7 on WhatsApp / Email

[object Object]