Quantitative Data Analysis Homework: Statistical Inference
VerifiedAdded on 2021/04/17
|18
|3759
|381
Homework Assignment
AI Summary
This assignment delves into quantitative data analysis, exploring null hypothesis significance testing (NHST) and confidence intervals. The solution begins with an overview of statistical theory, explaining the core concepts of NHST, including the formulation of null and alternative hypotheses, the use of p-values, and the interpretation of statistical significance. It also discusses the limitations of NHST, such as its vulnerability to sampling errors and the potential for misinterpretation of results. The assignment then examines confidence intervals, defining them as a range of values within which a population parameter is expected to lie with a specific degree of certainty, and explains their application in inferential testing. The analysis includes a case study using data from a cross-sectional survey of community volunteers in Australia to test the hypothesis that male participants are older, on average, than female participants. The analysis uses the theory of null hypothesis testing, and the results are presented with reference to the relevant data variables, including age, sex, employment status, and number of days volunteered.

Running head: Assignment _ Quantitative Data Analysis
Assignment_ Quantitative Data analysis
Name of Student
Name of University
Author note
Assignment_ Quantitative Data analysis
Name of Student
Name of University
Author note
Paraphrase This Document
Need a fresh take? Get an instant paraphrase of this document with our AI Paraphraser
Assignment _ Quantitative Data Analysis
Part 1: Quantitative Analysis
(B) Null hypothesis significance testing
Statistical Theory:
The bottom line of any statistical investigation is to draw some inference regarding the
underlying probability law of the phenomenon of interest on the basis of available, observable data
(Cohen, Manion & Morrison, 2013). According to statistical theory, observations form the foundation on
which any assertion, conjecture or research hypothesis could be analysed and inferred upon.
A statistical hypothesis testing method is a tool to evaluate the validity of a conjecture regarding
the parameter of the probability distribution which is assumed to be underlying the phenomenon being
considered in the hypothesis (Casella & Berger, 2013).. This is done on the basis of a sample statistic.
The procedure takes into consideration two contesting hypothesis, namely the null hypothesis and the
alternate hypothesis (Levine, 2014). The null hypothesis assumes a position of no difference with respect
to the population parameter(s) involved in the conjecture when compared to a specific value or one
another. The alternate hypothesis challenges the assertion of the null hypothesis (Zacks, 2014). Drawing
on the fact that the process is dependent on observable values and based upon probability theory, the
task is then to look at the sample evidence and determine whether there is reasonable doubt on the
validity of the assumption. The rule or test which determines whether the null shall be rejected or not, is
based upon the sampling distribution of the test statistic (Casella & Berger, 2013).
Consider the following example. It is of interest to test the validity of the claim that babies born
to mothers who are regular smokers have lower weight at birth on an average than those born to
mothers who do not. Then mean weight at birth for babies born to mothers who are regular smokers
could be compared with the mean birth weight of those born to mothers who do not smoke. According
Page 1 of 18
ID: 31860125 Module DHR.529 Code 2750
Assignment _ Quantitative Data Analysis
to null hypothesis testing method, then mean or average weight at birth would be the statistic of
interest (Salkind, 2016). According to central limit theorem, large sample distribution of mean is normal
with mean equal to the population mean, μ and variance equal to σ 2 /n where σ 2 is the population
variance of weights of the babies at birth (Casella & Berger, 2013). Then assuming that specification of
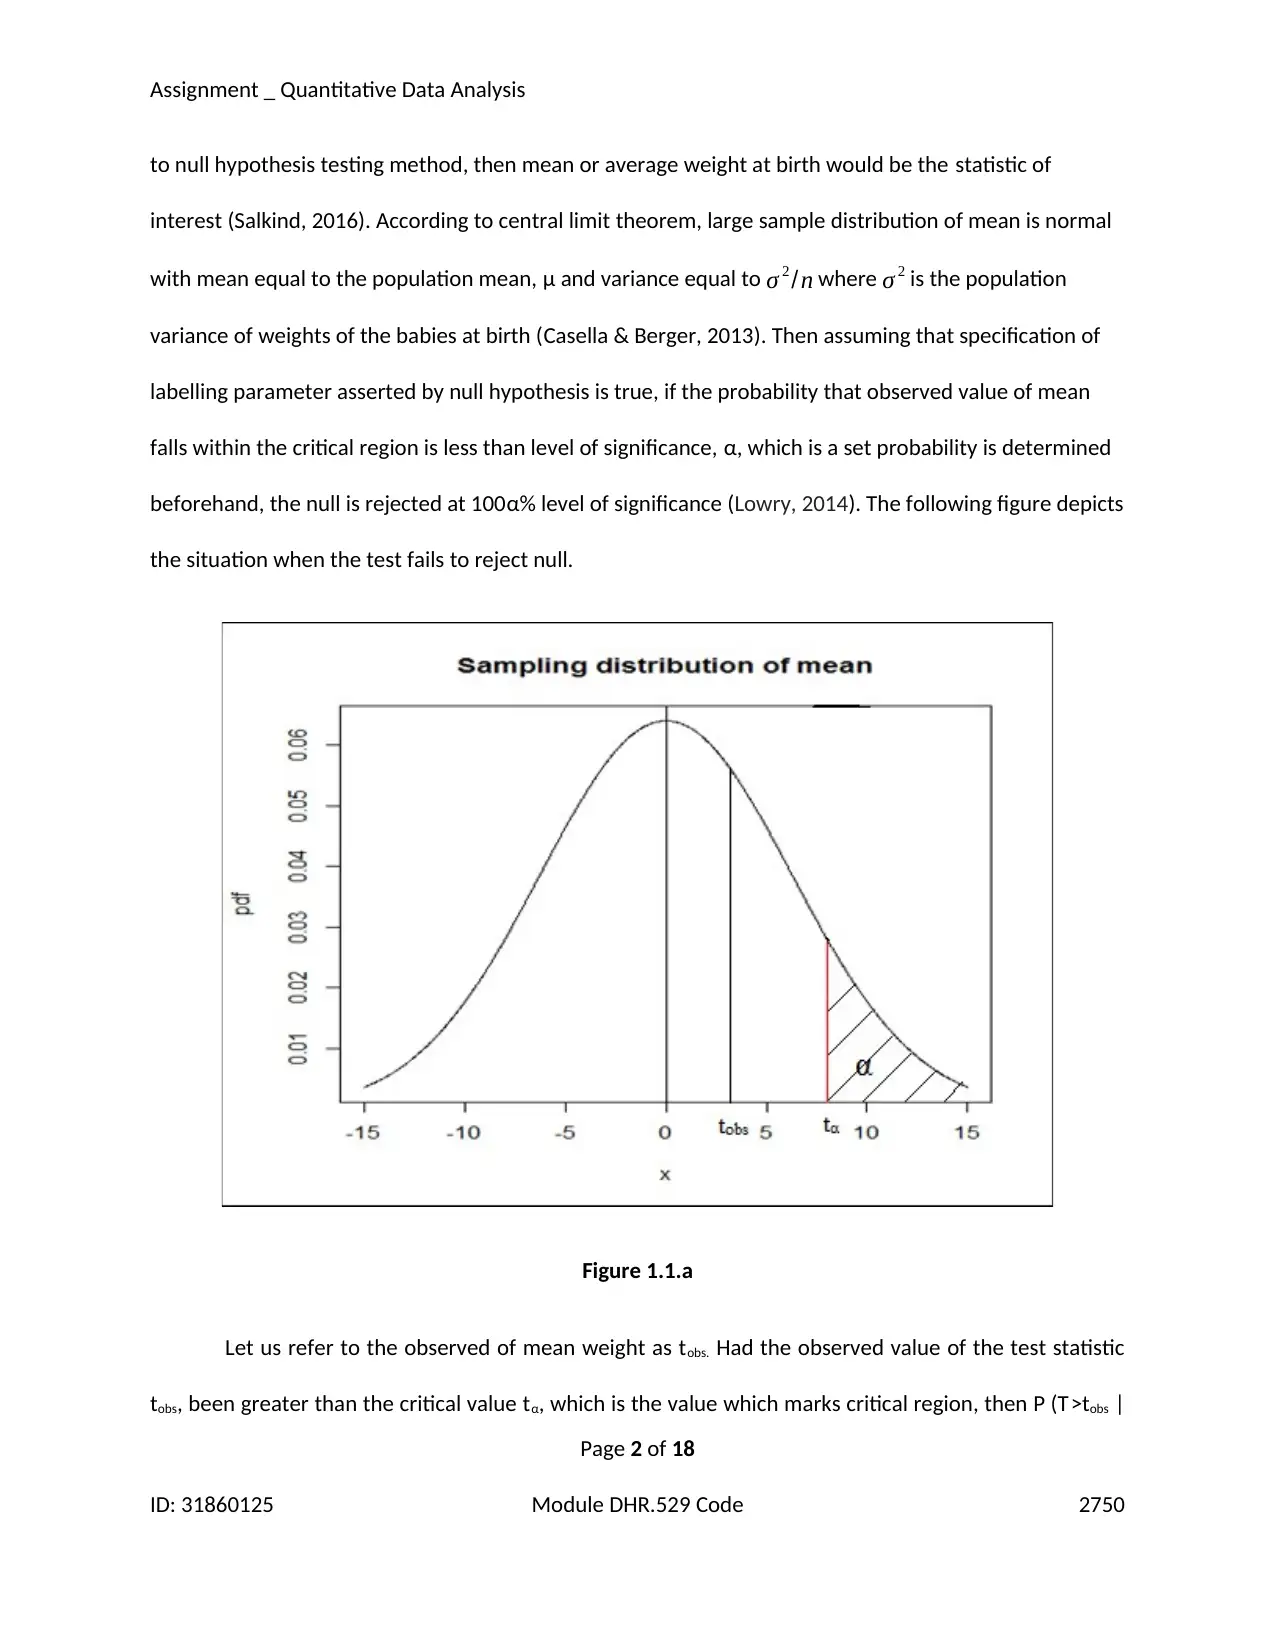
labelling parameter asserted by null hypothesis is true, if the probability that observed value of mean
falls within the critical region is less than level of significance, α, which is a set probability is determined
beforehand, the null is rejected at 100α% level of significance (Lowry, 2014). The following figure depicts
the situation when the test fails to reject null.
Figure 1.1.a
Let us refer to the observed of mean weight as tobs. Had the observed value of the test statistic
tobs, been greater than the critical value tα, which is the value which marks critical region, then P (T>tobs |
Page 2 of 18
ID: 31860125 Module DHR.529 Code 2750
to null hypothesis testing method, then mean or average weight at birth would be the statistic of
interest (Salkind, 2016). According to central limit theorem, large sample distribution of mean is normal
with mean equal to the population mean, μ and variance equal to σ 2 /n where σ 2 is the population
variance of weights of the babies at birth (Casella & Berger, 2013). Then assuming that specification of
labelling parameter asserted by null hypothesis is true, if the probability that observed value of mean
falls within the critical region is less than level of significance, α, which is a set probability is determined
beforehand, the null is rejected at 100α% level of significance (Lowry, 2014). The following figure depicts
the situation when the test fails to reject null.
Figure 1.1.a
Let us refer to the observed of mean weight as tobs. Had the observed value of the test statistic
tobs, been greater than the critical value tα, which is the value which marks critical region, then P (T>tobs |
Page 2 of 18
ID: 31860125 Module DHR.529 Code 2750
⊘ This is a preview!⊘
Do you want full access?
Subscribe today to unlock all pages.
Trusted by 1+ million students worldwide
Assignment _ Quantitative Data Analysis
H0 is true) which is defined as the p-value, would be less than the level of significance leading to rejection
of null hypothesis (Lehmann & Romano, 2012). Figure 1 however shows the situation when the
probability is greater than α.
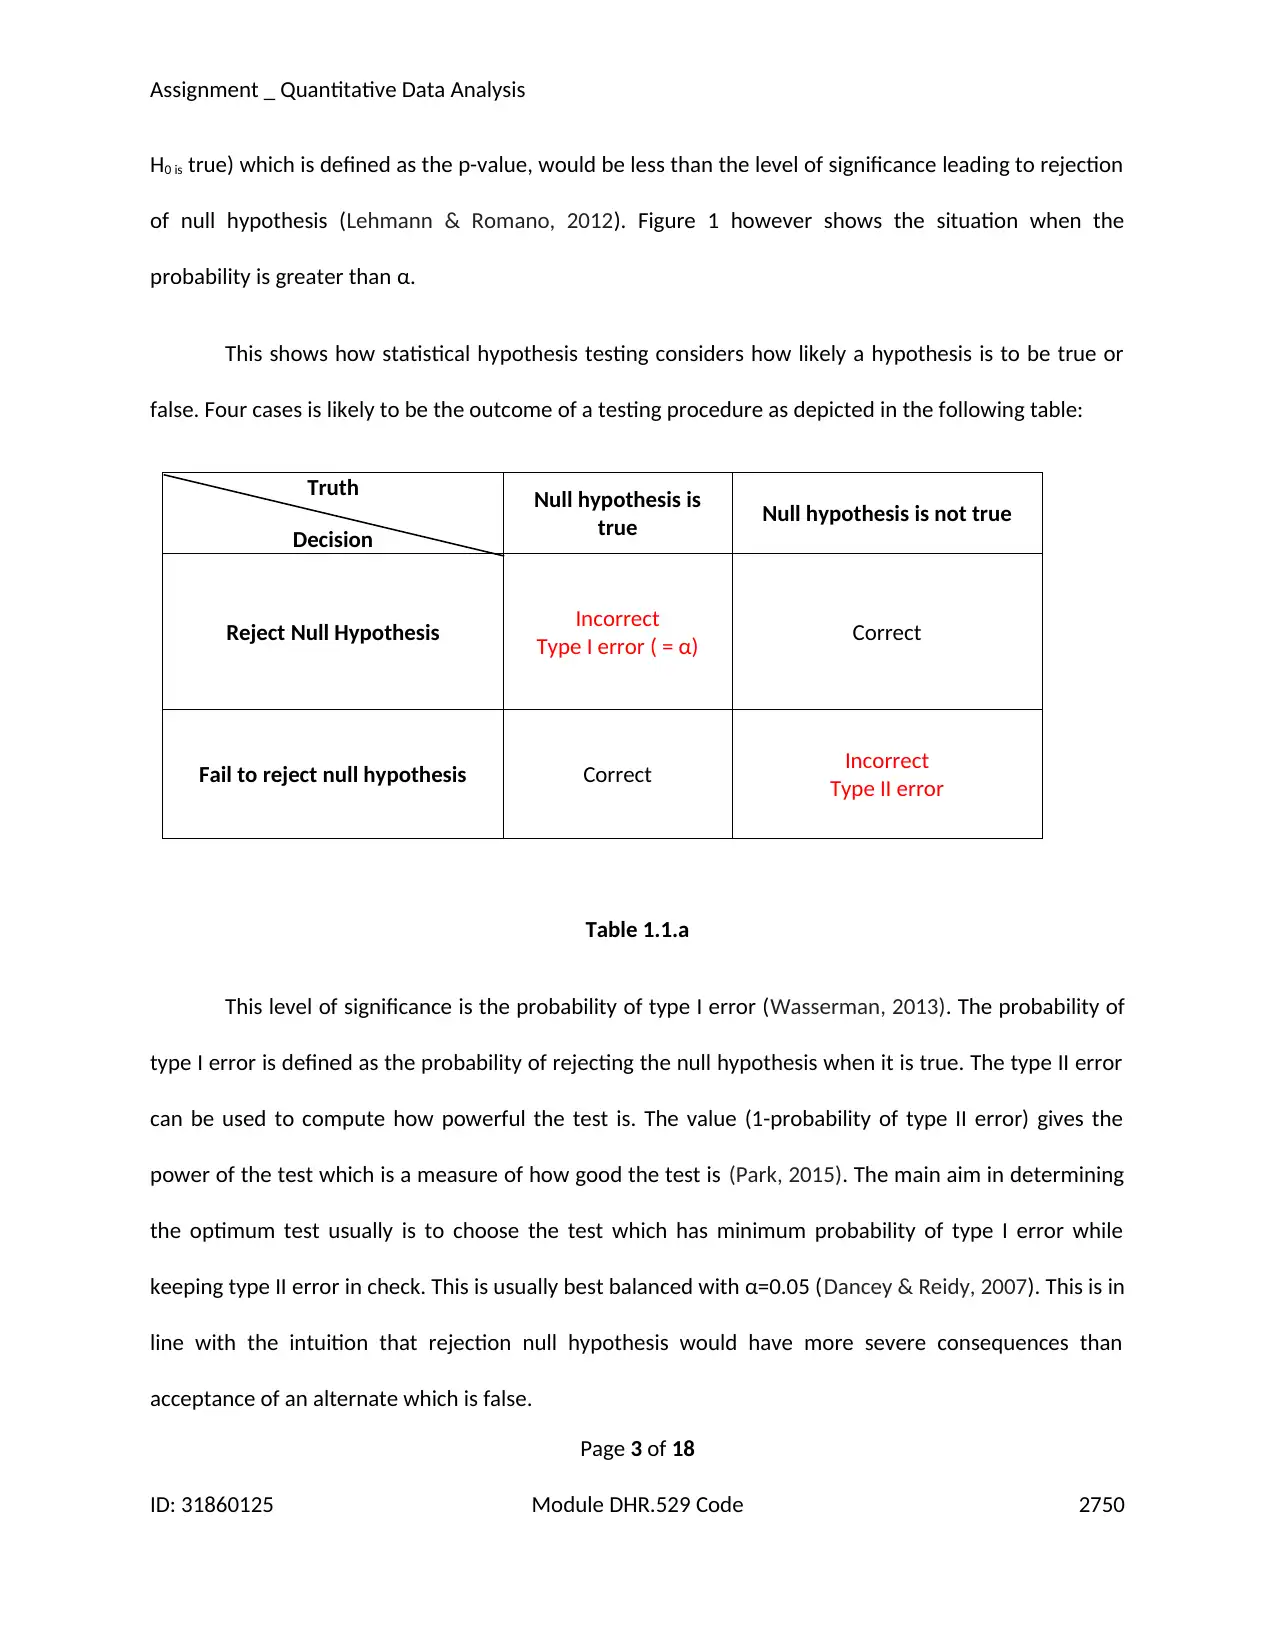
This shows how statistical hypothesis testing considers how likely a hypothesis is to be true or
false. Four cases is likely to be the outcome of a testing procedure as depicted in the following table:
Truth Null hypothesis is
true Null hypothesis is not true
Decision
Reject Null Hypothesis Incorrect
Type I error ( = α) Correct
Fail to reject null hypothesis Correct Incorrect
Type II error
Table 1.1.a
This level of significance is the probability of type I error (Wasserman, 2013). The probability of
type I error is defined as the probability of rejecting the null hypothesis when it is true. The type II error
can be used to compute how powerful the test is. The value (1-probability of type II error) gives the
power of the test which is a measure of how good the test is (Park, 2015). The main aim in determining
the optimum test usually is to choose the test which has minimum probability of type I error while
keeping type II error in check. This is usually best balanced with α=0.05 (Dancey & Reidy, 2007). This is in
line with the intuition that rejection null hypothesis would have more severe consequences than
acceptance of an alternate which is false.
Page 3 of 18
ID: 31860125 Module DHR.529 Code 2750
H0 is true) which is defined as the p-value, would be less than the level of significance leading to rejection
of null hypothesis (Lehmann & Romano, 2012). Figure 1 however shows the situation when the
probability is greater than α.
This shows how statistical hypothesis testing considers how likely a hypothesis is to be true or
false. Four cases is likely to be the outcome of a testing procedure as depicted in the following table:
Truth Null hypothesis is
true Null hypothesis is not true
Decision
Reject Null Hypothesis Incorrect
Type I error ( = α) Correct
Fail to reject null hypothesis Correct Incorrect
Type II error
Table 1.1.a
This level of significance is the probability of type I error (Wasserman, 2013). The probability of
type I error is defined as the probability of rejecting the null hypothesis when it is true. The type II error
can be used to compute how powerful the test is. The value (1-probability of type II error) gives the
power of the test which is a measure of how good the test is (Park, 2015). The main aim in determining
the optimum test usually is to choose the test which has minimum probability of type I error while
keeping type II error in check. This is usually best balanced with α=0.05 (Dancey & Reidy, 2007). This is in
line with the intuition that rejection null hypothesis would have more severe consequences than
acceptance of an alternate which is false.
Page 3 of 18
ID: 31860125 Module DHR.529 Code 2750
Paraphrase This Document
Need a fresh take? Get an instant paraphrase of this document with our AI Paraphraser
Assignment _ Quantitative Data Analysis
Limitations:
The theory of hypothesis testing as explained above requires a large volume of data given its
assumption being based on large sample distribution. The results are also vulnerable to sampling errors
of the observable test statistic that is used to attain the final decision (Foster, Diamond & Jefferies,
2014). Additionally the procedure does not take into account any prior information in its assumptions
which may amount to key information getting left out. A key problem thus lies in the interpretation of
the results. Statistical significance does not necessarily suggest scientific significance (Wasserman,
2013). Although a small p-value suggests that chance of null being true is low, does not exactly indicate
that chance of the alternative being true is high. Therefore p-value being less than significance level
leads to rejection of the null but not the acceptance of the alternative hypothesis (Casella & Berger,
2013). This means that even if the null is failed to be rejected, it is simply owing to the fact that there is
not enough evidence to accept is given the sample used to arrive at the conclusion. However there is no
guarantee that it is really so (Levine, 2014).
(A) Confidence intervals
A confidence interval of a parameter is a range of values within which the population value of
the parameter is expected to lie with a specific degree of certainty or confidence (Salkind, 2016). The
confidence interval estimates as opposed to the point estimates of the parameter estimates a set of
values that the parameter value may assume. These values are dispersed around the point estimate and
lie within a margin of error, which depends on the size of the sample used for estimation and the
required degree of certainty. Confidence intervals are thus by definition provide more information
about the estimate, specifically the degree of uncertainty that the estimate has (Levine, 2014). This has
far greater implications practically and the measure has thus gained in popularity in recent times.
Page 4 of 18
ID: 31860125 Module DHR.529 Code 2750
Assignment _ Quantitative Data Analysis
The upper and lower bounds of the confidence interval, in general, are therefore defined as:
Upper bound = estimate + error margin
Lower bound = estimate - error margin
The error margin is computed using the formula:
Z−score × standard deviation
√n
The exact form of the intervals may however differ as per the type of estimates and thus the
underlying distribution, the confidence level as reflected by the confidence coefficient (1-α) and the kind
of sampling method that had been employed for estimation purposes. A 95% confidence intervals imply
that that the confidence of the true parameter value to lie in the specified range of values is 95%. This
does not mean that the probability of the true value to lie in the interval is 0.95. It means that 95% of
the time that the estimation process has been generated, the true value has been found to lie in the
specified interval (Migon, Gamerman & Louzada, 2014). A specific interval may either have the true
population value or may not, but there is no in between. The rationale driving the theory is that,
although two confidence intervals with two different sample of same length would be different, but
repeatedly generating those using different samples of same size drawn randomly would exhibit that
proportion of the times the intervals contain the true parameter value is equal to the confidence
coefficient 1-α (Salkind, 2016).
Considering the example of estimating the mean of a normal distribution where the population
standard deviation is known. The mean of random variables following normal distribution is known to be
Page 5 of 18
ID: 31860125 Module DHR.529 Code 2750
⊘ This is a preview!⊘
Do you want full access?
Subscribe today to unlock all pages.
Trusted by 1+ million students worldwide
Assignment _ Quantitative Data Analysis
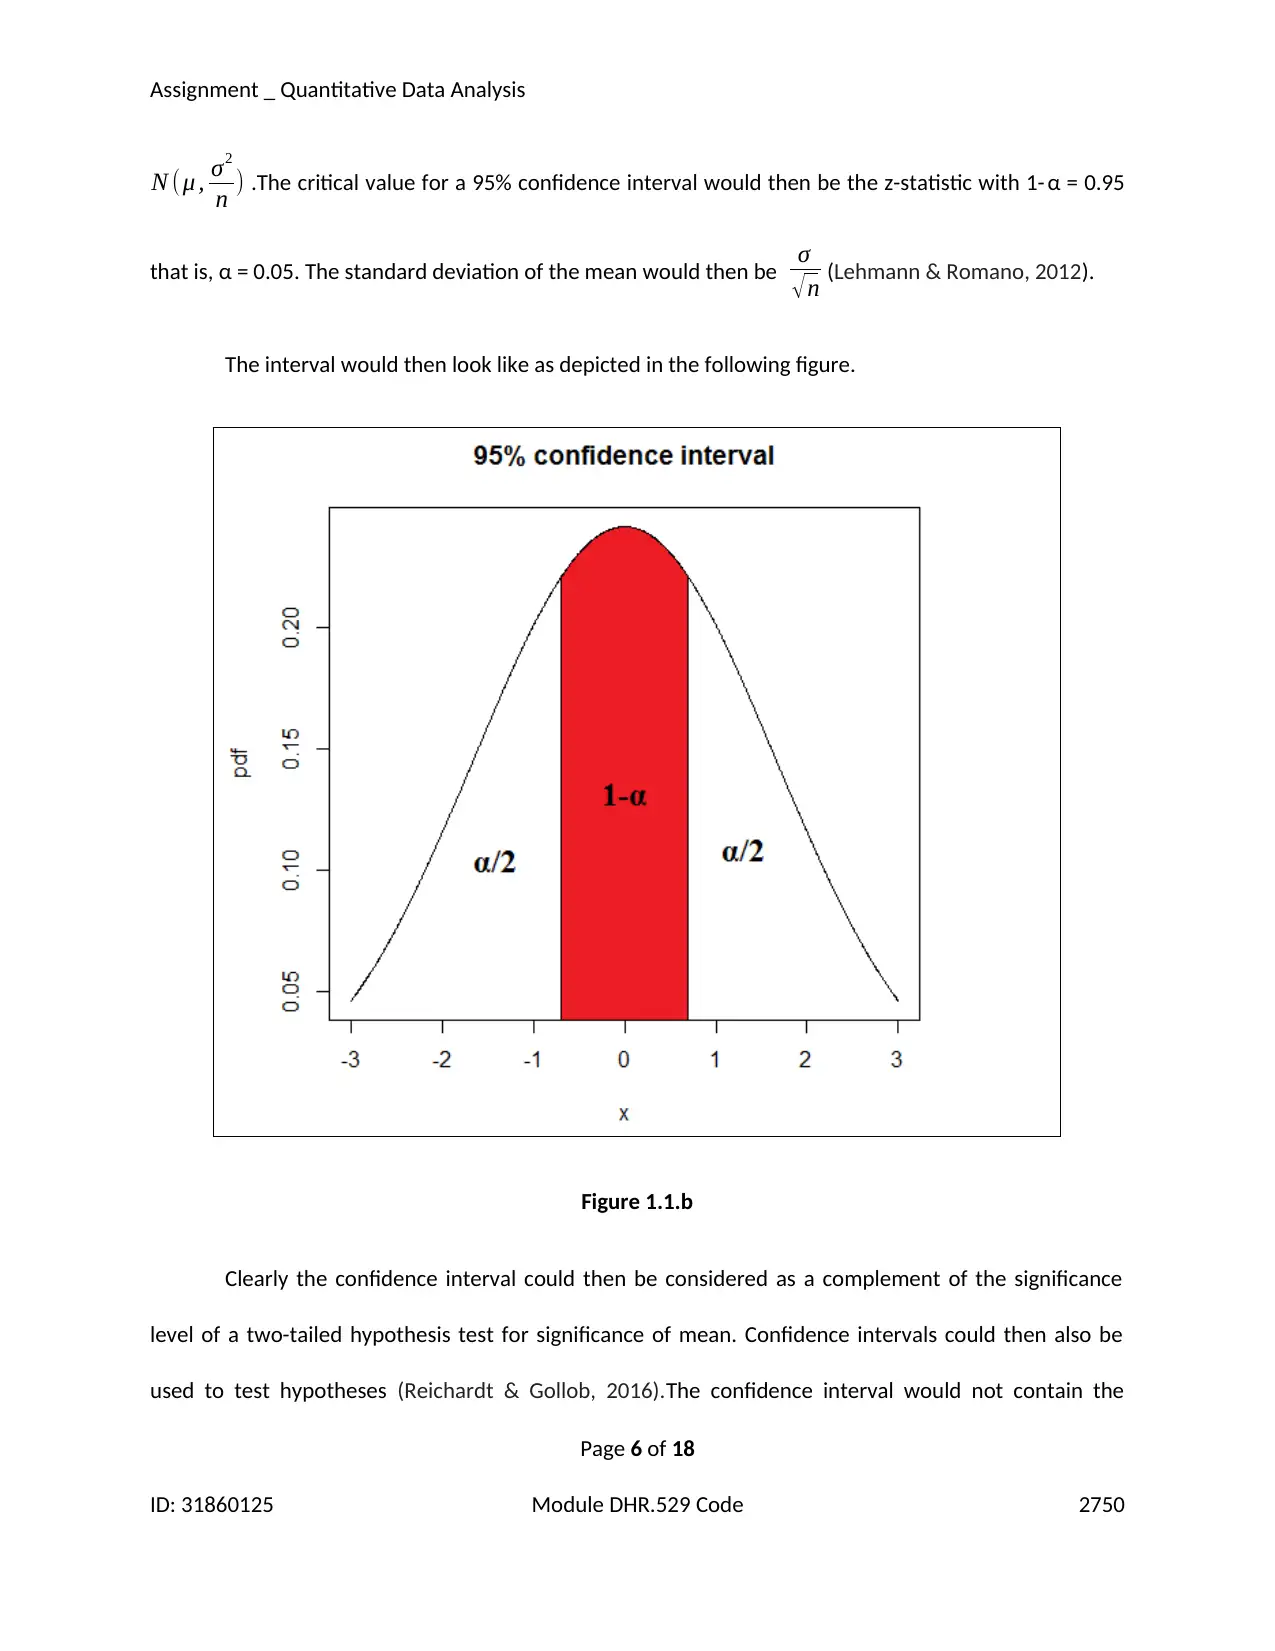
N ( μ , σ2
n ) .The critical value for a 95% confidence interval would then be the z-statistic with 1- α = 0.95
that is, α = 0.05. The standard deviation of the mean would then be σ
√ n (Lehmann & Romano, 2012).
The interval would then look like as depicted in the following figure.
Figure 1.1.b
Clearly the confidence interval could then be considered as a complement of the significance
level of a two-tailed hypothesis test for significance of mean. Confidence intervals could then also be
used to test hypotheses (Reichardt & Gollob, 2016).The confidence interval would not contain the
Page 6 of 18
ID: 31860125 Module DHR.529 Code 2750
Paraphrase This Document
Need a fresh take? Get an instant paraphrase of this document with our AI Paraphraser
Assignment _ Quantitative Data Analysis
hypothesised value of the mean under null hypothesis if the test statistic were to be significantly
different from the value (Dancey & Reidy, 2007). Thus the null hypothesis would be rejected.
The above example explains confidence intervals when the population standard deviation is
known, however when the population value of standard error is unknown, the t-interval confidence
intervals are used where the critical value is computed on basis of t-statistic and the standard error on
basis of sample standard error (Cohen, Manion & Morrison, 2013).
A confidence interval with a specific level of confidence which is narrower is the one which is
more preferred. The width of a confidence interval with a specific confidence coefficient depends on the
standard error and hence on the size of the sample used to generate the confidence interval
(Kalinowski, 2010). The width of the confidence interval increases with decrease in size of the sample
that has been used to compute the confidence interval and vice versa (Dancey & Reidy, 2007). This is
owing to the decrease in sampling error as the size of sample increases. Thus a 95% confidence interval
with sample size, n=1000 would be narrower than one which has n=500.There for a confidence interval
based on larger sample size will always be better. Again, a 99% confidence interval would be narrower
than a 95% confidence interval (Migon, Gamerman & Louzada, 2014). This is due to the fact that
increasing the confidence level would decrease the critical value and hence decrease the width. Lastly, a
greater standard deviation of the sample would increase standard error and hence the width ( Ott &
Longnecker, 2015).
(C) Data analysis: Testing of hypothesis
Data description:
The data relates to 253 participants from a cross-sectional survey of community volunteers in
Australia. The relevant data for this part consists of four different sets of attributes for each participant,
Page 7 of 18
ID: 31860125 Module DHR.529 Code 2750
Assignment _ Quantitative Data Analysis
namely, age, sex, employment status and number of days that the participant had engaged in
volunteering. Each participant has been assigned a unique ID, ranging from 1 to 253 for identification
purposes. The age variable has an interval scale assuming discrete value of age in years, the “sex”
variable has a nominal scale with two categories (Male = “1” and Female = “2”), the “EMPLOY” variable
representing employment status is also categorical with two categories (Employed= “1” and
Unemployed= “0”) and finally the “DAY_VOL” variable which represents number of days volunteered
which is also interval scale assuming discrete values of the count of days volunteered.
Hypothesis:
The chosen hypothesis out of the two options provided for this paper states that, “The male
participants of the survey are older, on average, relative to the female participants”.
The formal definition of hypothesis is thus stated as follows:
H0: The age of men are same as that of the women participants (Null)
H1: The men are older than the women participants. (Alternate)
Analysis and Results:
The following analysis makes use of the theory of null hypothesis testing. The data variables
relevant for the chosen hypothesis are “Age” and “Sex”. It is seen that there are 75 individuals who are
female and 178 who are male. The data can thus be viewed upon two sets of ages, one for females,
having length of 75 data points and the other for males, having a length of 178 data points.
Page 8 of 18
ID: 31860125 Module DHR.529 Code 2750
⊘ This is a preview!⊘
Do you want full access?
Subscribe today to unlock all pages.
Trusted by 1+ million students worldwide
Assignment _ Quantitative Data Analysis
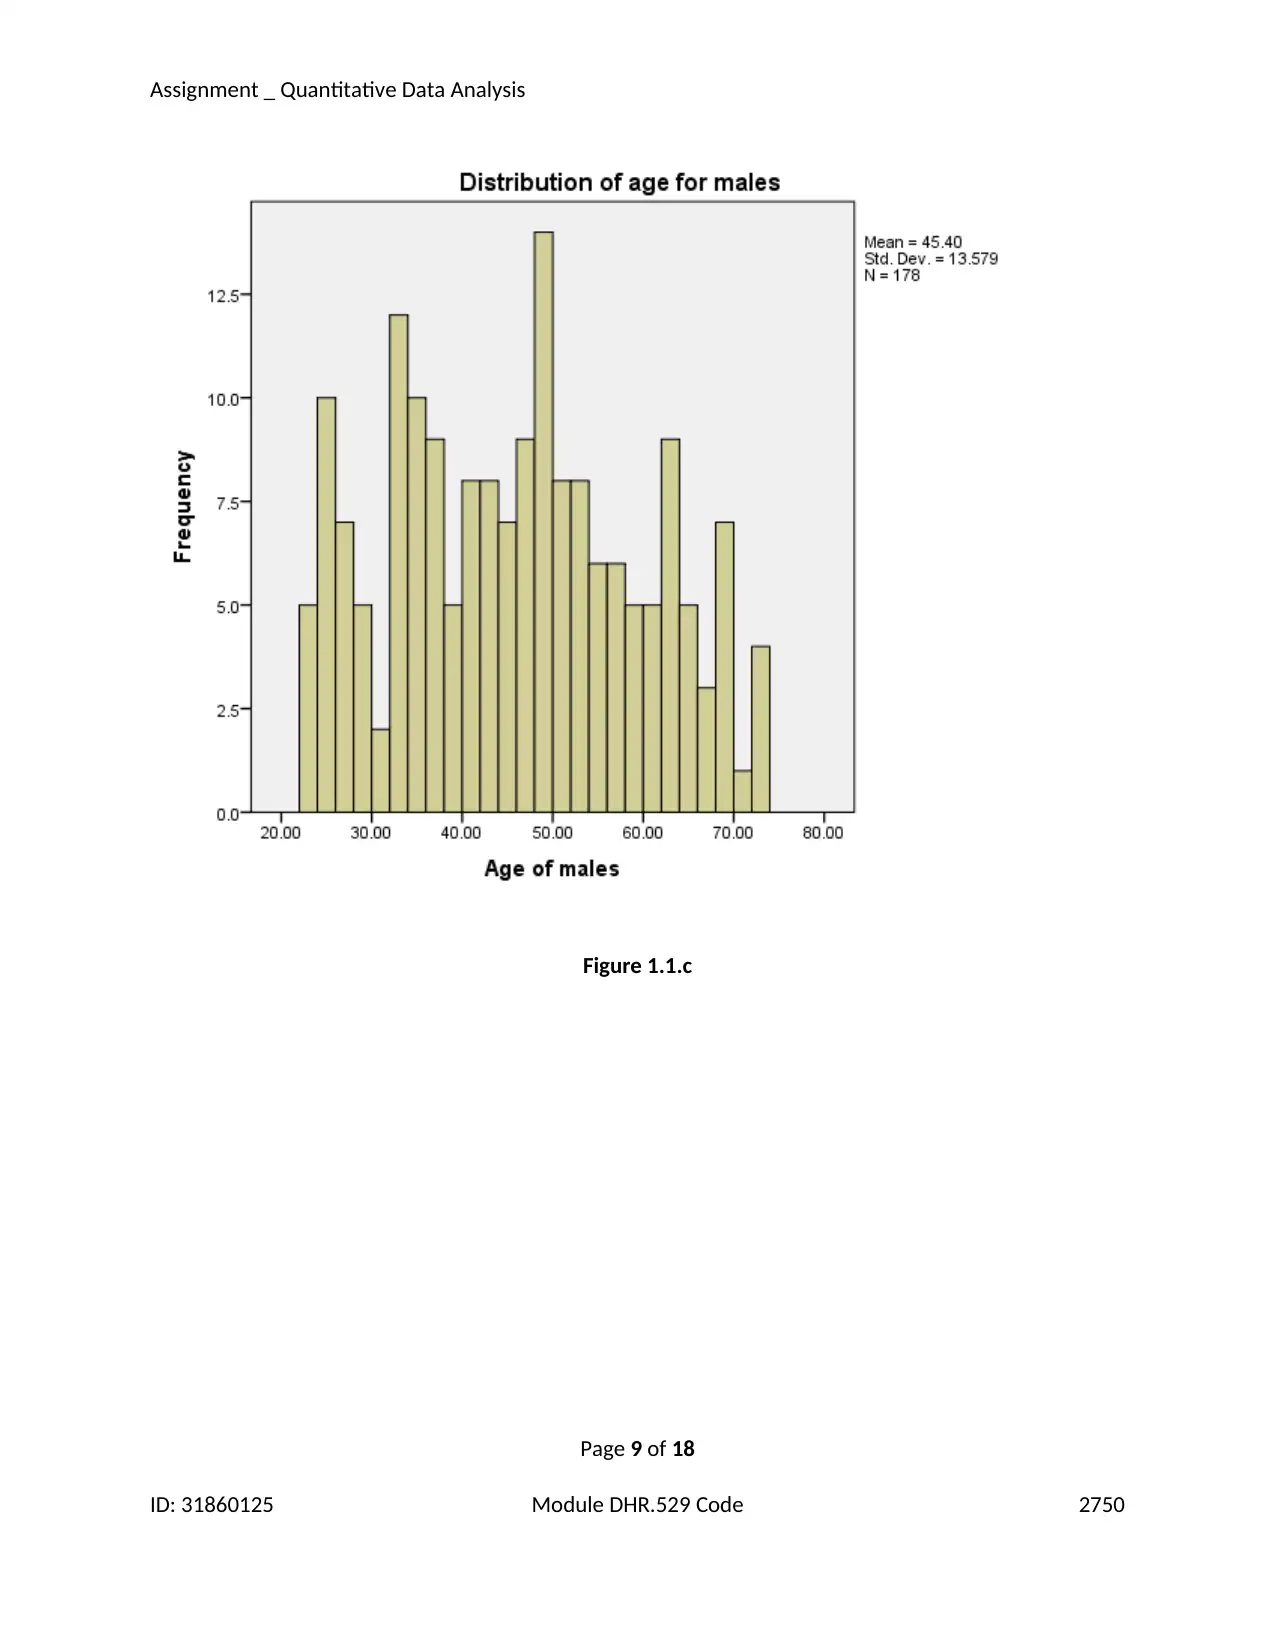
Figure 1.1.c
Page 9 of 18
ID: 31860125 Module DHR.529 Code 2750
Figure 1.1.c
Page 9 of 18
ID: 31860125 Module DHR.529 Code 2750
Paraphrase This Document
Need a fresh take? Get an instant paraphrase of this document with our AI Paraphraser
Assignment _ Quantitative Data Analysis
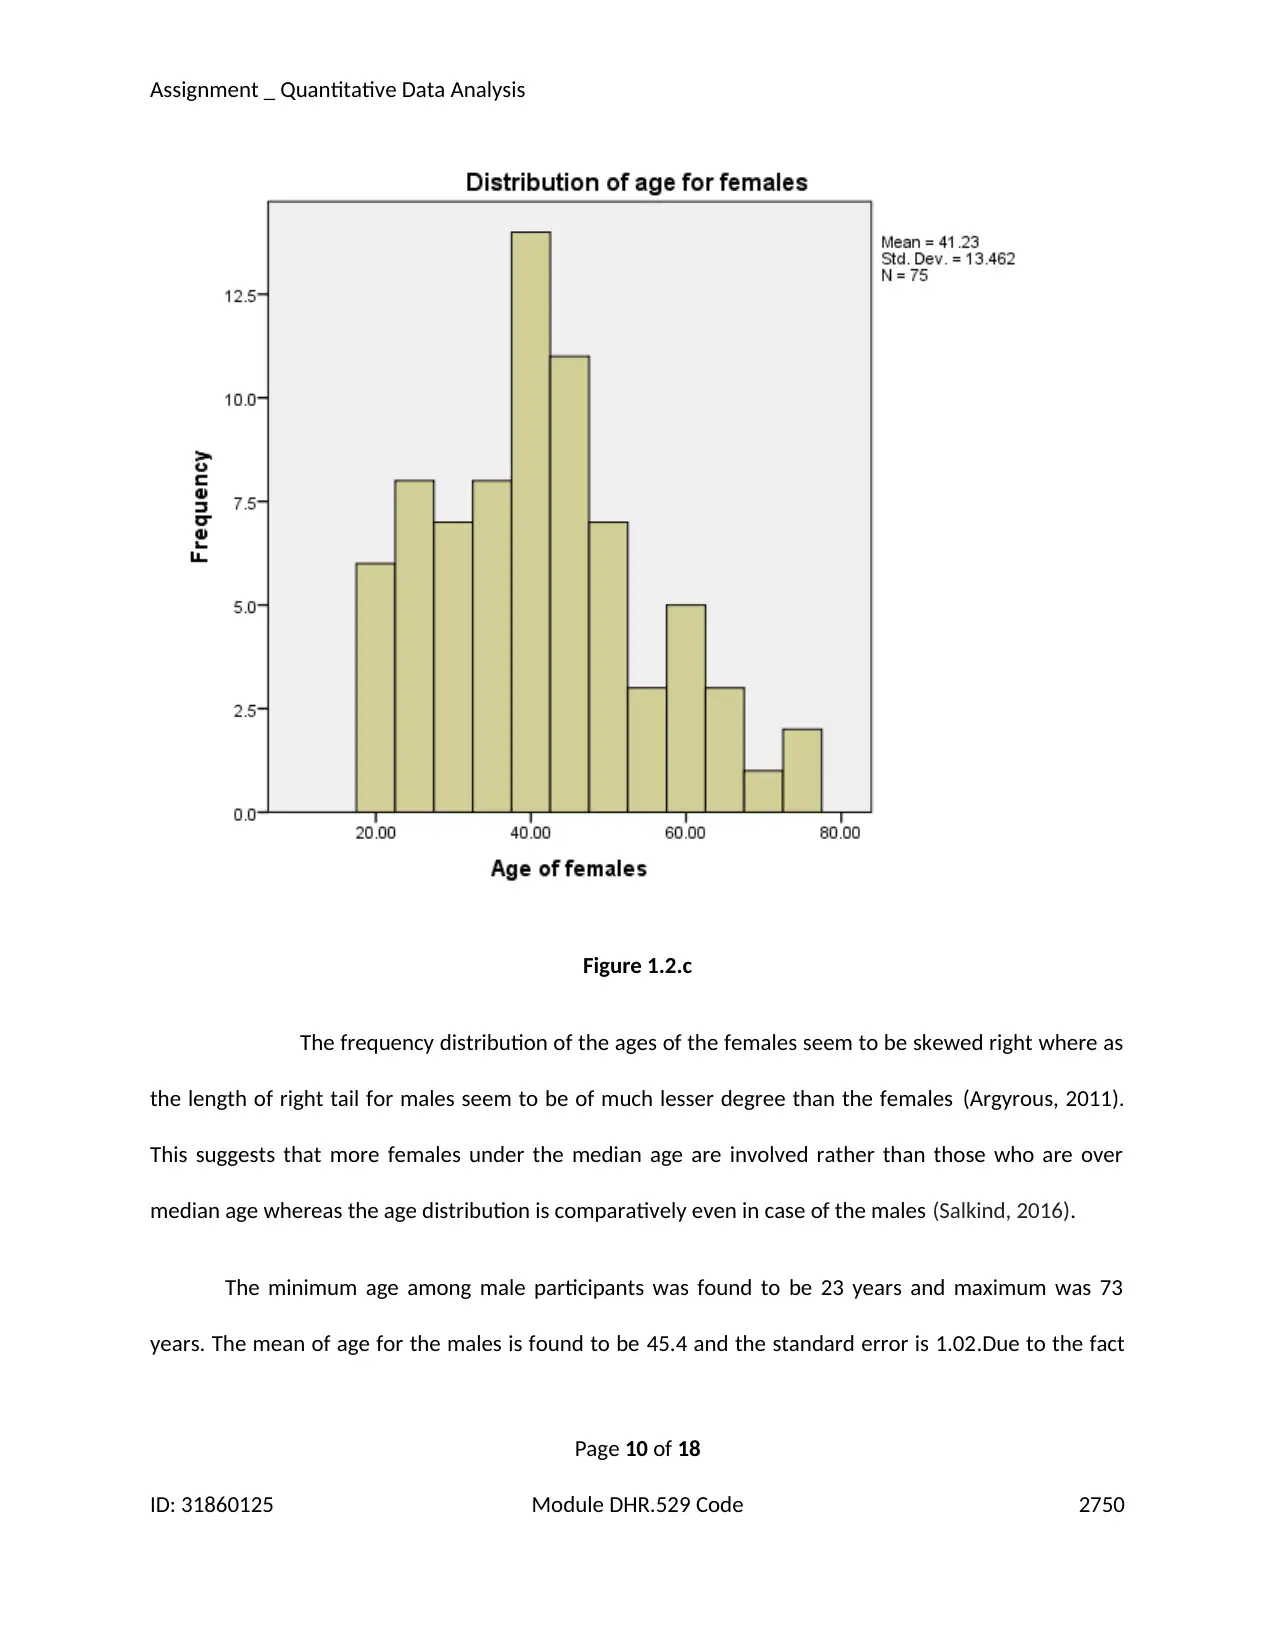
Figure 1.2.c
The frequency distribution of the ages of the females seem to be skewed right where as
the length of right tail for males seem to be of much lesser degree than the females (Argyrous, 2011).
This suggests that more females under the median age are involved rather than those who are over
median age whereas the age distribution is comparatively even in case of the males (Salkind, 2016).
The minimum age among male participants was found to be 23 years and maximum was 73
years. The mean of age for the males is found to be 45.4 and the standard error is 1.02.Due to the fact
Page 10 of 18
ID: 31860125 Module DHR.529 Code 2750
Assignment _ Quantitative Data Analysis
that population variance of age distribution of the males was unknown, the confidence interval had
been computed using t-intervals (George & Mallery, 2016).
Then the computed 95% confidence interval for the mean age of the males was found to be
(43.00, 44.99).
The minimum age among female participants was found to be 20 years and the maximum age
was found to be 74 years. The mean age of the females was estimated to be 41.23. The standard error
was found to be 1.55. The 95% confidence interval for the mean age of females was computed in the
same way as the males due to same reasons. The confidence interval of the mean age of females was
computed to be (39.70, 42.75).
Therefore it is indicated that the age for females are in a range of values which are slightly lower
than those of the males.
The test for significance of the hypothesis can then be framed as follows:
H0: mean age for males= mean age for females (Null)
H1: mean age for males > mean age for females (Alternate)
The task is then to compare the mean values of two groups of variables, namely the men and
the women. The population variances are unknown and therefore the one tailed t-test for significance is
used to test the hypothesis. The level of significance assumed is 0.05.The p-value is observed to be 0.026
which is less than the level of significance assumed. The null hypothesis is thus rejected at 0.05 or 5%
level of significance. Therefore the test indicates that participating men are indeed older on an average
than the women who are participating (George & Mallery, 2016).
Page 11 of 18
ID: 31860125 Module DHR.529 Code 2750
⊘ This is a preview!⊘
Do you want full access?
Subscribe today to unlock all pages.
Trusted by 1+ million students worldwide
1 out of 18
Related Documents


Your All-in-One AI-Powered Toolkit for Academic Success.
+13062052269
info@desklib.com
Available 24*7 on WhatsApp / Email
![[object Object]](/_next/static/media/star-bottom.7253800d.svg)
Unlock your academic potential
Copyright © 2020–2026 A2Z Services. All Rights Reserved. Developed and managed by ZUCOL.