Ask a question from expert
Assignment: Statistics for Management
19 Pages3721 Words88 Views
Added on 2020-10-05
Assignment: Statistics for Management
Added on 2020-10-05
BookmarkShareRelated Documents
Statistics for Management

TABLE OF CONTENTSINTRODUCTION...........................................................................................................................1ACTIVITY 1....................................................................................................................................1A) Annual earnings of employees in public and private sector..............................................11. Changes in gross earnings annually in both sector.............................................................12. Gap between male and female in gross earnings................................................................3B) Statistics given by ONS (Office for National Statistics)...................................................61. Gap between education and finance...................................................................................62. Ascertaining whether earnings of health and social care staff are more than administrativestaff.........................................................................................................................................7ACTIVITY 2....................................................................................................................................7A) 1. Estimating median hourly earnings and quartiles.........................................................72. Compute mean and standard deviation for hourly earnings...............................................9B) Comparison of earnings in two regions...........................................................................10ACTIVITY 3..................................................................................................................................10A) Deliveries made in each year..........................................................................................10B) Determining number of bags currently delivered with delivery.....................................11C) Calculating EOQ (Economic Order Quantity)................................................................12D) Providing recommendation and comparing new and existing ordering policies............13ACTIVITY 4..................................................................................................................................13A) Producing line chart of male and female gross annual earnings for public and private sector..............................................................................................................................................13B) Preparing ogive as per Activity 2 of hourly earnings......................................................15CONCLUSION..............................................................................................................................15REFERENCES..............................................................................................................................16
INTRODUCTIONThe implication of statistical tools in business operations are helpful and beneficial as, tohave appropriate revenue generation as well as execution of the operations. It comprises with themathematical observations and techniques to resolve the huge data set and analyse the logicalreasons behind issues. However, in the following study there will be determination of detailsrelevant with employments in public and private sector. Similarly, to analyse the requirement ofindustrial operations such as production level as well as profitability through various methods ofanalysis, statistical tools are applied. ACTIVITY 1A) Annual earnings of employees in public and private sector1. Changes in gross earnings annually in both sectorMaleYearPrivate sectoremployeesChange in salaryon annual basisin %Public sectoremployeesChange insalary onannual basis in%201031264270002011313800.37%272330.86%2012318161.39%277051.73%2013325412.28%282011.79%2014328781.04%284420.85%2015336852.45%288811.54%2016340110.97%296792.76%1
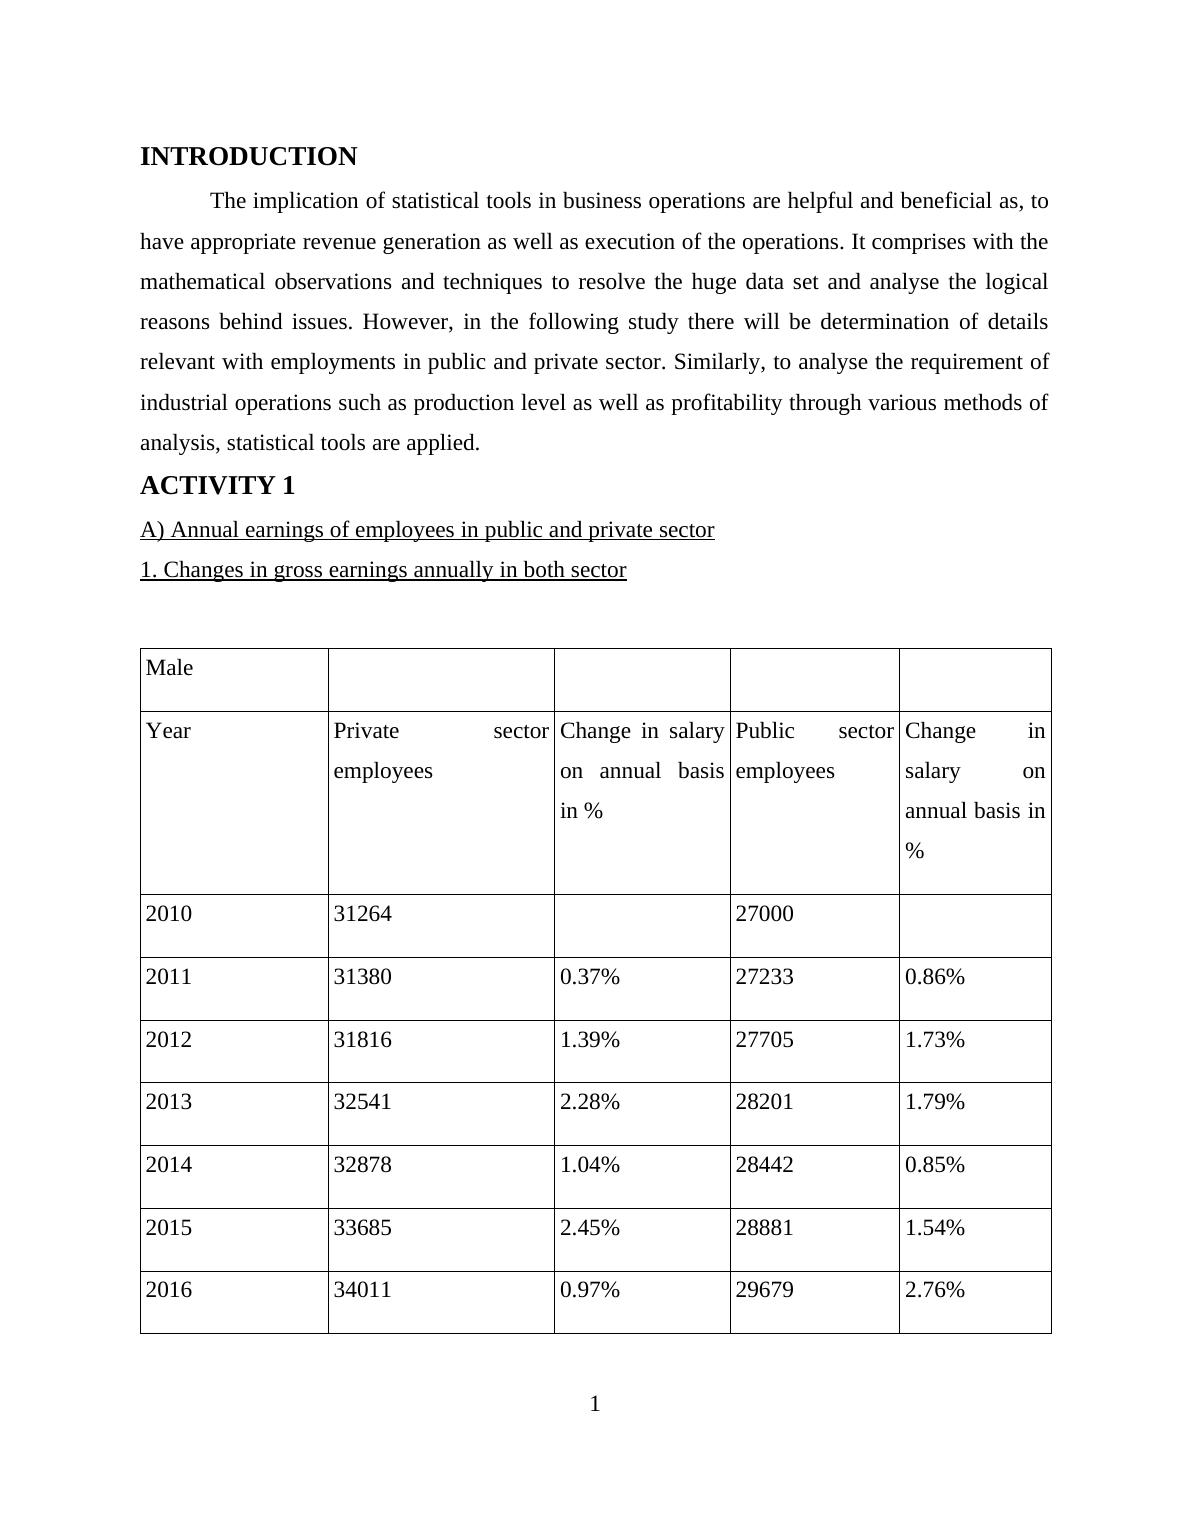
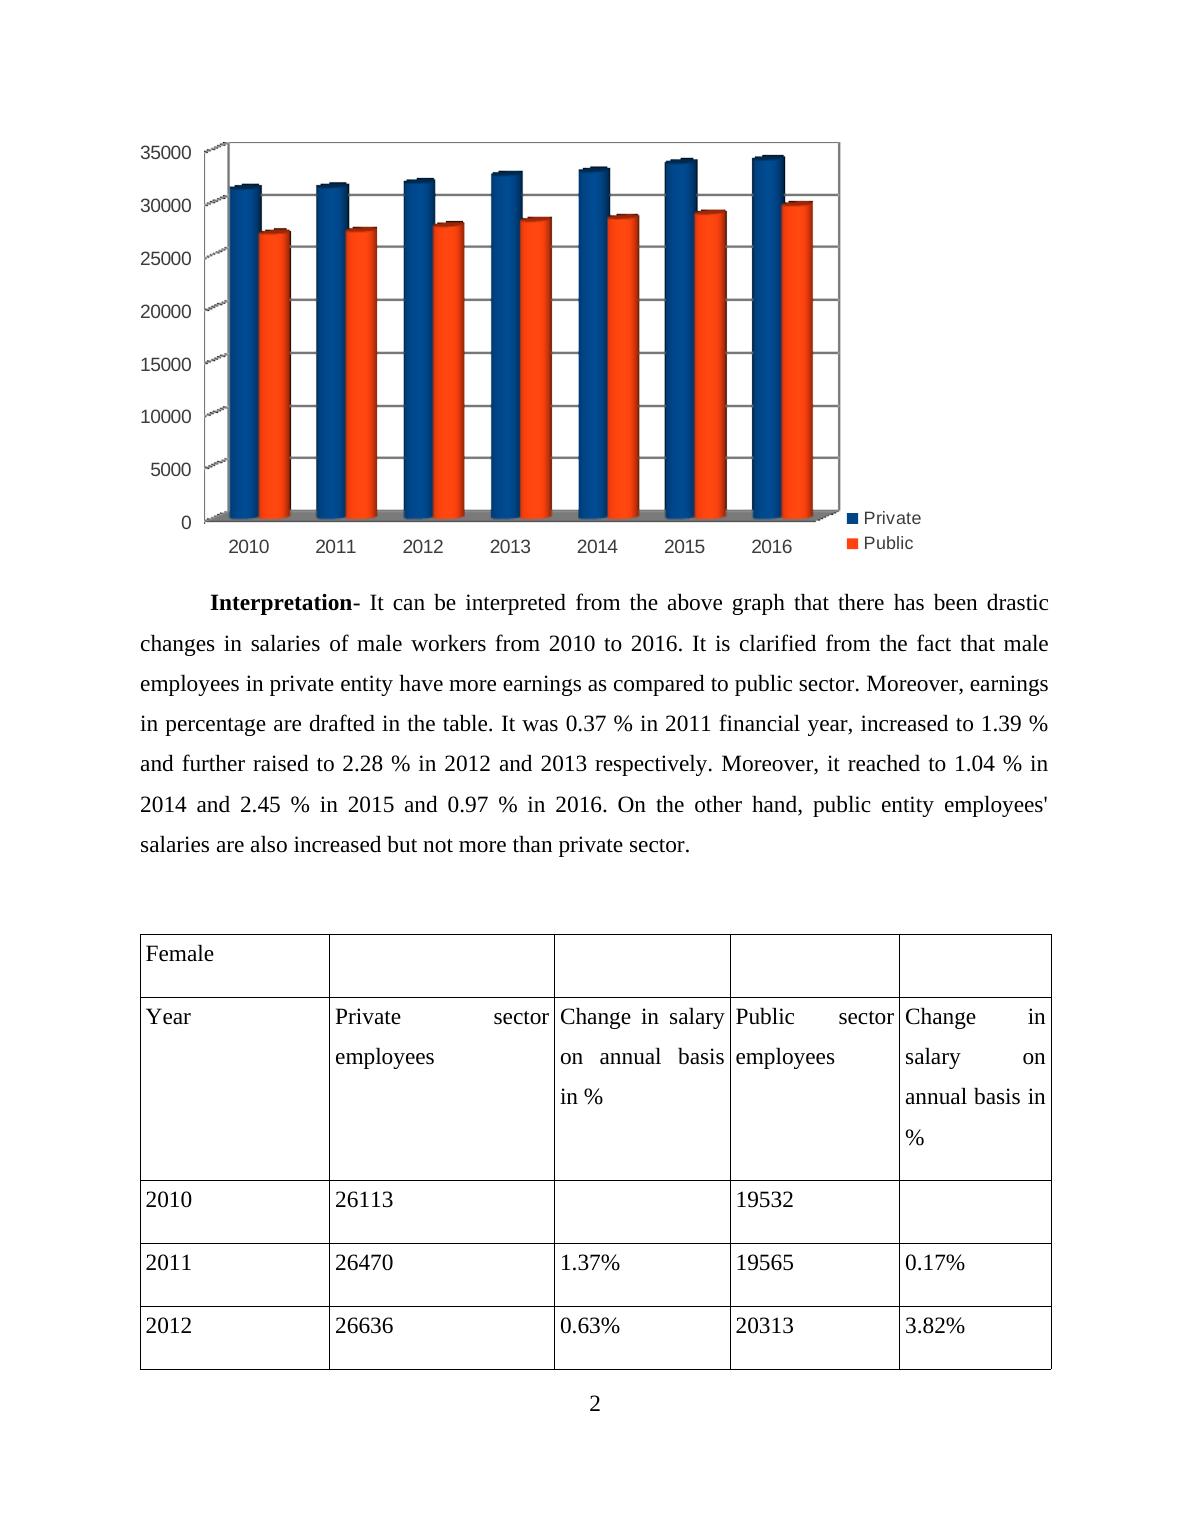
201020112012201320142015201605000100001500020000250003000035000PrivatePublicInterpretation- It can be interpreted from the above graph that there has been drasticchanges in salaries of male workers from 2010 to 2016. It is clarified from the fact that maleemployees in private entity have more earnings as compared to public sector. Moreover, earningsin percentage are drafted in the table. It was 0.37 % in 2011 financial year, increased to 1.39 %and further raised to 2.28 % in 2012 and 2013 respectively. Moreover, it reached to 1.04 % in2014 and 2.45 % in 2015 and 0.97 % in 2016. On the other hand, public entity employees'salaries are also increased but not more than private sector. FemaleYearPrivate sectoremployeesChange in salaryon annual basisin %Public sectoremployeesChange insalary onannual basis in%201026113195322011264701.37%195650.17%2012266360.63%203133.82%2013273382.64%206981.90%2014277051.34%210171.54%2
End of preview
Want to access all the pages? Upload your documents or become a member.
Related Documents
Assignment of Statistics for Managementlg...
|21
|5135
|28
Statistics for Management Assignment Solution (Doc)lg...
|15
|3020
|285
Statistics for Management PDFlg...
|19
|3977
|326
Statistics For Management Sample Assignment PDFlg...
|21
|4631
|478
Statistic for Management - Reportlg...
|18
|3321
|200
Statistics in Management ACTIVTIY 1 1lg...
|17
|3350
|361