Statistics for Management: Statistical Analysis and Report
VerifiedAdded on 2020/06/06
|22
|4725
|101
Report
AI Summary
This report presents a comprehensive statistical analysis for management, covering various aspects of data interpretation and decision-making. It begins with an introduction to statistical tools and their significance in business, followed by an analysis of earnings differences between men and women in the public and private sectors using T-tests. The report includes time charts and growth rate analyses, providing insights into income trends. Furthermore, it delves into graphical presentations of data, analyzing student marks and calculating measures of dispersion like mean, mode, and standard deviation. The report also addresses topics like economic order quantity (EOQ) and concludes with an overview of data visualization techniques using bar and pie charts, along with an analysis of the relationship between bedroom numbers and prices. The analysis is supported by calculations, interpretations, and graphical representations to facilitate a clear understanding of the statistical concepts and their applications in management.
STATISTICS FOR
MANAGEMENT
MANAGEMENT
Paraphrase This Document
Need a fresh take? Get an instant paraphrase of this document with our AI Paraphraser
Table of Contents
INTRODUCTION...........................................................................................................................1
TASK 1............................................................................................................................................1
a. Assessing whether significant difference takes place in the earnings of men and women
working in public sector.........................................................................................................1
(B) Difference in income level in private sector between male and female..........................2
© Earning time chart for year 2009 to 2016...........................................................................3
D) Using chart of c and determines annual growth rate in earning of the four groups..........3
TASK 2............................................................................................................................................5
Section A..........................................................................................................................................5
2.1 Graphical presentation of the data....................................................................................5
2.2 Analysis of the data..........................................................................................................6
B Measure of the dispersion...................................................................................................8
2.2 Preparation of the report and interpret the results............................................................9
Section B........................................................................................................................................10
2.4 Line of the best fit...........................................................................................................10
TASK 3..........................................................................................................................................12
(a) Number of deliveries made currently every year............................................................12
(b) Number of bottles of olive oil are delivered currently every year..................................12
(c) Economic order quantity (EOQ).....................................................................................12
TASK 4..........................................................................................................................................14
4.1 Bar and Pie charts...........................................................................................................14
4.2 Relationship between bedroom and their prices in varied streets..................................16
CONCLUSION..............................................................................................................................18
REFERENCES..............................................................................................................................19
INTRODUCTION
In the recent times, business units lay high level of emphasis on undertaking statistical
tools and techniques with the motive to summarize large data set for decision making. Statistical
techniques enable management team to analyse and present gathered data set in a meaningful
way. Now, statistical tools are widely used by the firm for making suitable decisions that makes
contribution in the attainment of goals. Moreover, without using statistical techniques it is not
possible for the management team to take profitable decision from the large data set considered
for evaluation. The present report is based on different case scenarios that will provide deeper
insight about the manner which statistical test helps in presenting meaningful results. It also
develops understanding about measures of dispersion along with its strengths and weaknesses.
Further, report also depicts how graphical presentation facilitates better understanding in relation
to data set and thereby helps in making appropriate decision about near future.
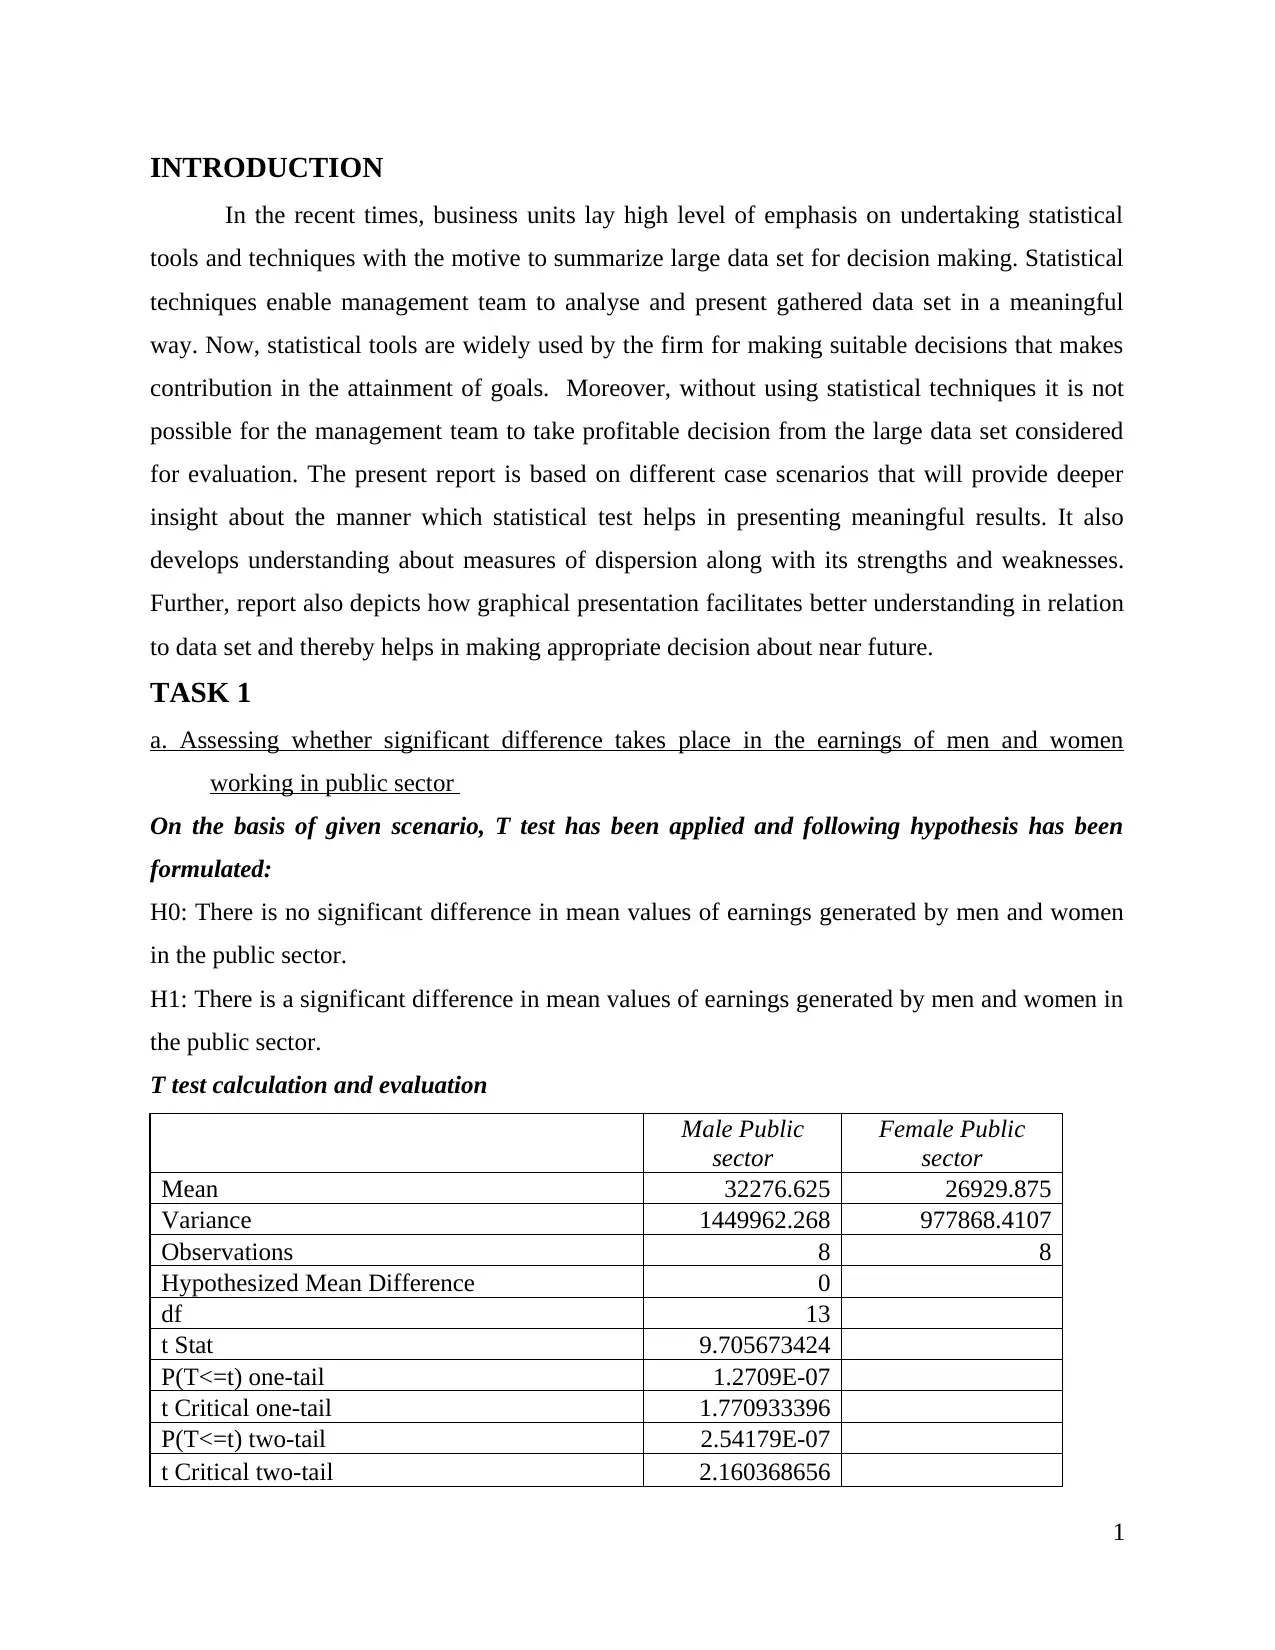
TASK 1
a. Assessing whether significant difference takes place in the earnings of men and women
working in public sector
On the basis of given scenario, T test has been applied and following hypothesis has been
formulated:
H0: There is no significant difference in mean values of earnings generated by men and women
in the public sector.
H1: There is a significant difference in mean values of earnings generated by men and women in
the public sector.
T test calculation and evaluation
Male Public
sector
Female Public
sector
Mean 32276.625 26929.875
Variance 1449962.268 977868.4107
Observations 8 8
Hypothesized Mean Difference 0
df 13
t Stat 9.705673424
P(T<=t) one-tail 1.2709E-07
t Critical one-tail 1.770933396
P(T<=t) two-tail 2.54179E-07
t Critical two-tail 2.160368656
1
In the recent times, business units lay high level of emphasis on undertaking statistical
tools and techniques with the motive to summarize large data set for decision making. Statistical
techniques enable management team to analyse and present gathered data set in a meaningful
way. Now, statistical tools are widely used by the firm for making suitable decisions that makes
contribution in the attainment of goals. Moreover, without using statistical techniques it is not
possible for the management team to take profitable decision from the large data set considered
for evaluation. The present report is based on different case scenarios that will provide deeper
insight about the manner which statistical test helps in presenting meaningful results. It also
develops understanding about measures of dispersion along with its strengths and weaknesses.
Further, report also depicts how graphical presentation facilitates better understanding in relation
to data set and thereby helps in making appropriate decision about near future.
TASK 1
a. Assessing whether significant difference takes place in the earnings of men and women
working in public sector
On the basis of given scenario, T test has been applied and following hypothesis has been
formulated:
H0: There is no significant difference in mean values of earnings generated by men and women
in the public sector.
H1: There is a significant difference in mean values of earnings generated by men and women in
the public sector.
T test calculation and evaluation
Male Public
sector
Female Public
sector
Mean 32276.625 26929.875
Variance 1449962.268 977868.4107
Observations 8 8
Hypothesized Mean Difference 0
df 13
t Stat 9.705673424
P(T<=t) one-tail 1.2709E-07
t Critical one-tail 1.770933396
P(T<=t) two-tail 2.54179E-07
t Critical two-tail 2.160368656
1
⊘ This is a preview!⊘
Do you want full access?
Subscribe today to unlock all pages.
Trusted by 1+ million students worldwide
Interpretation: By applying statistical tool on data set, it has assessed that mean income
of male and females working in public sector accounts for £32276.62 & £26929.87 respectively.
This aspect clearly exhibits that average income earned by males, in the context of public sector,
are higher over females but not with the higher level. Further, it has assessed from evaluation
that p>0.05 which in turn indicates that null hypothesis is true and other one rejected.
Considering the results of such evaluation, it can be depicted that there is no significant
difference takes place in the average income of men and women working in public sector. In
other words, it can be said that both men and women are receiving similar salary during the
period considered for investigation.
e in the average income of men and women working in public sector. In other words, it
can be said that both men and women are receiving similar salary during the period considered
for investigation.
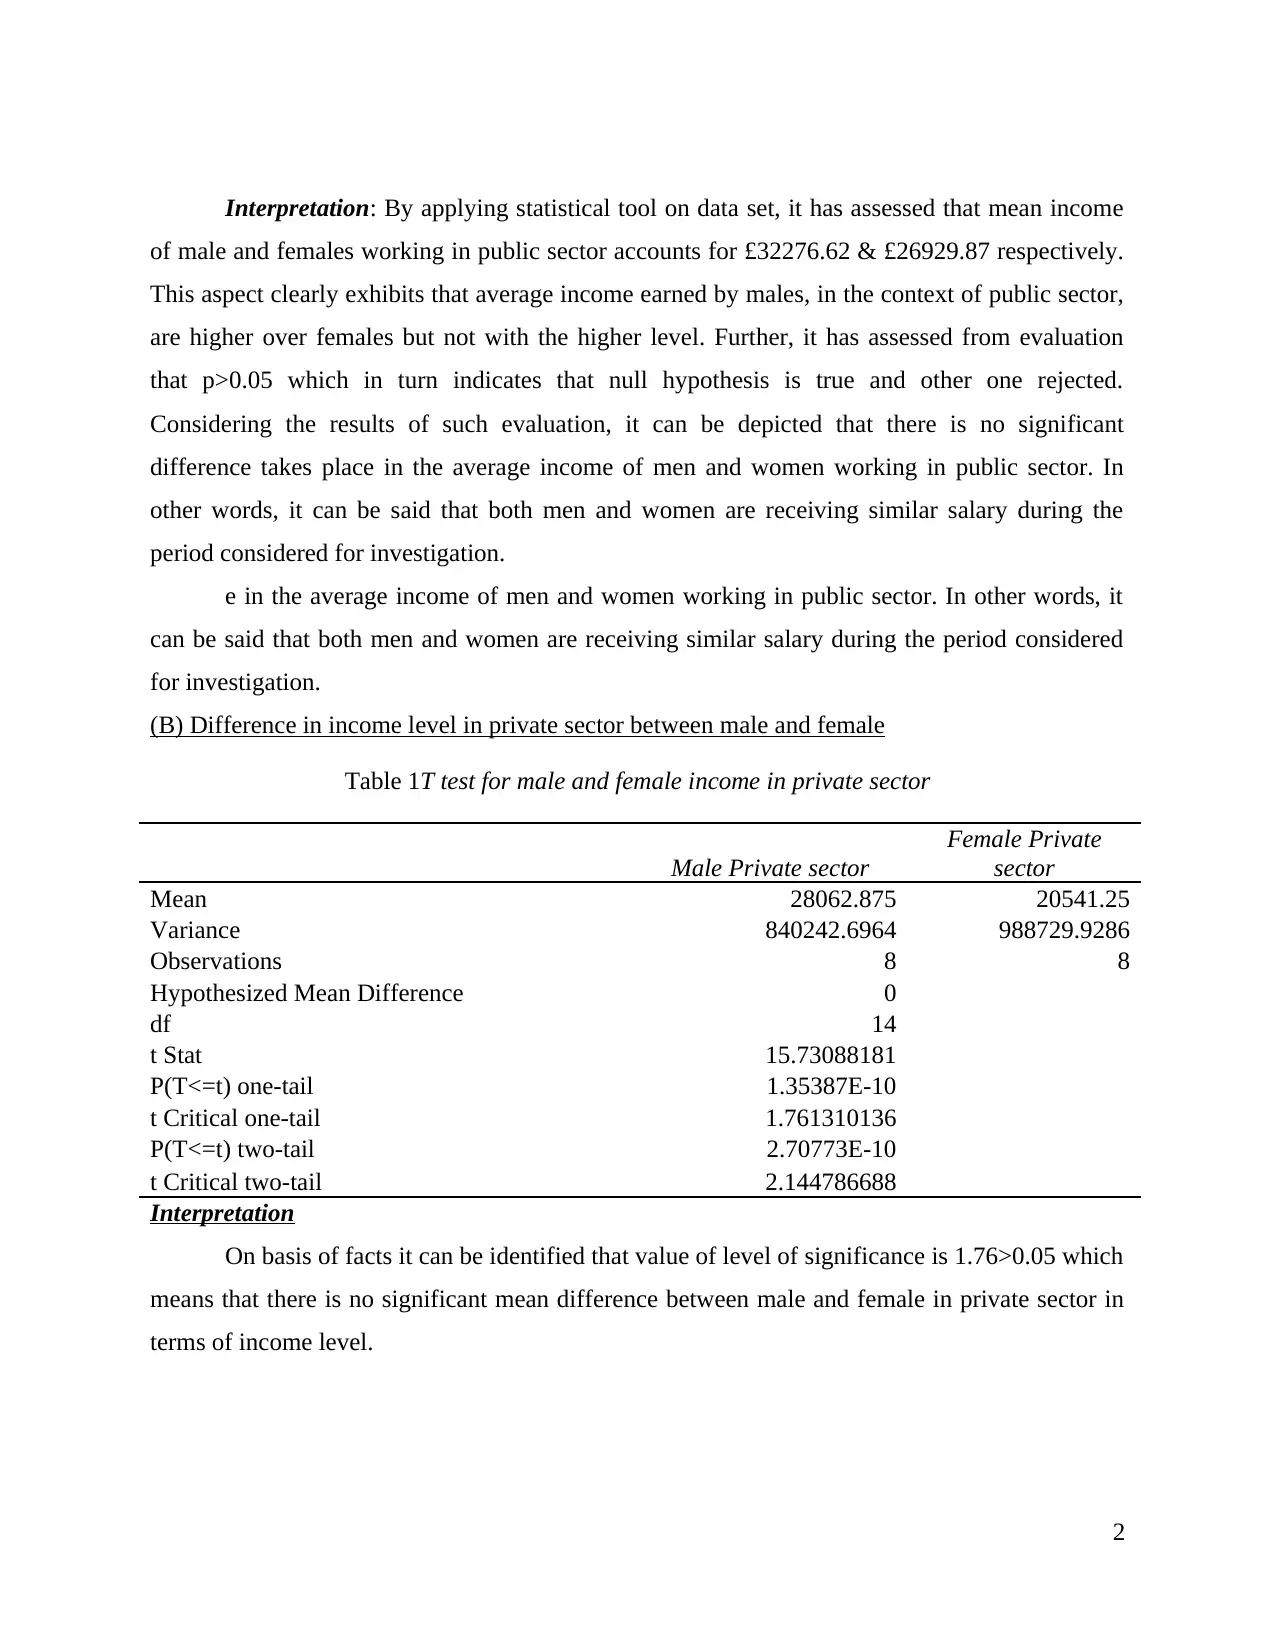
(B) Difference in income level in private sector between male and female
Table 1T test for male and female income in private sector
Male Private sector
Female Private
sector
Mean 28062.875 20541.25
Variance 840242.6964 988729.9286
Observations 8 8
Hypothesized Mean Difference 0
df 14
t Stat 15.73088181
P(T<=t) one-tail 1.35387E-10
t Critical one-tail 1.761310136
P(T<=t) two-tail 2.70773E-10
t Critical two-tail 2.144786688
Interpretation
On basis of facts it can be identified that value of level of significance is 1.76>0.05 which
means that there is no significant mean difference between male and female in private sector in
terms of income level.
2
of male and females working in public sector accounts for £32276.62 & £26929.87 respectively.
This aspect clearly exhibits that average income earned by males, in the context of public sector,
are higher over females but not with the higher level. Further, it has assessed from evaluation
that p>0.05 which in turn indicates that null hypothesis is true and other one rejected.
Considering the results of such evaluation, it can be depicted that there is no significant
difference takes place in the average income of men and women working in public sector. In
other words, it can be said that both men and women are receiving similar salary during the
period considered for investigation.
e in the average income of men and women working in public sector. In other words, it
can be said that both men and women are receiving similar salary during the period considered
for investigation.
(B) Difference in income level in private sector between male and female
Table 1T test for male and female income in private sector
Male Private sector
Female Private
sector
Mean 28062.875 20541.25
Variance 840242.6964 988729.9286
Observations 8 8
Hypothesized Mean Difference 0
df 14
t Stat 15.73088181
P(T<=t) one-tail 1.35387E-10
t Critical one-tail 1.761310136
P(T<=t) two-tail 2.70773E-10
t Critical two-tail 2.144786688
Interpretation
On basis of facts it can be identified that value of level of significance is 1.76>0.05 which
means that there is no significant mean difference between male and female in private sector in
terms of income level.
2
Paraphrase This Document
Need a fresh take? Get an instant paraphrase of this document with our AI Paraphraser
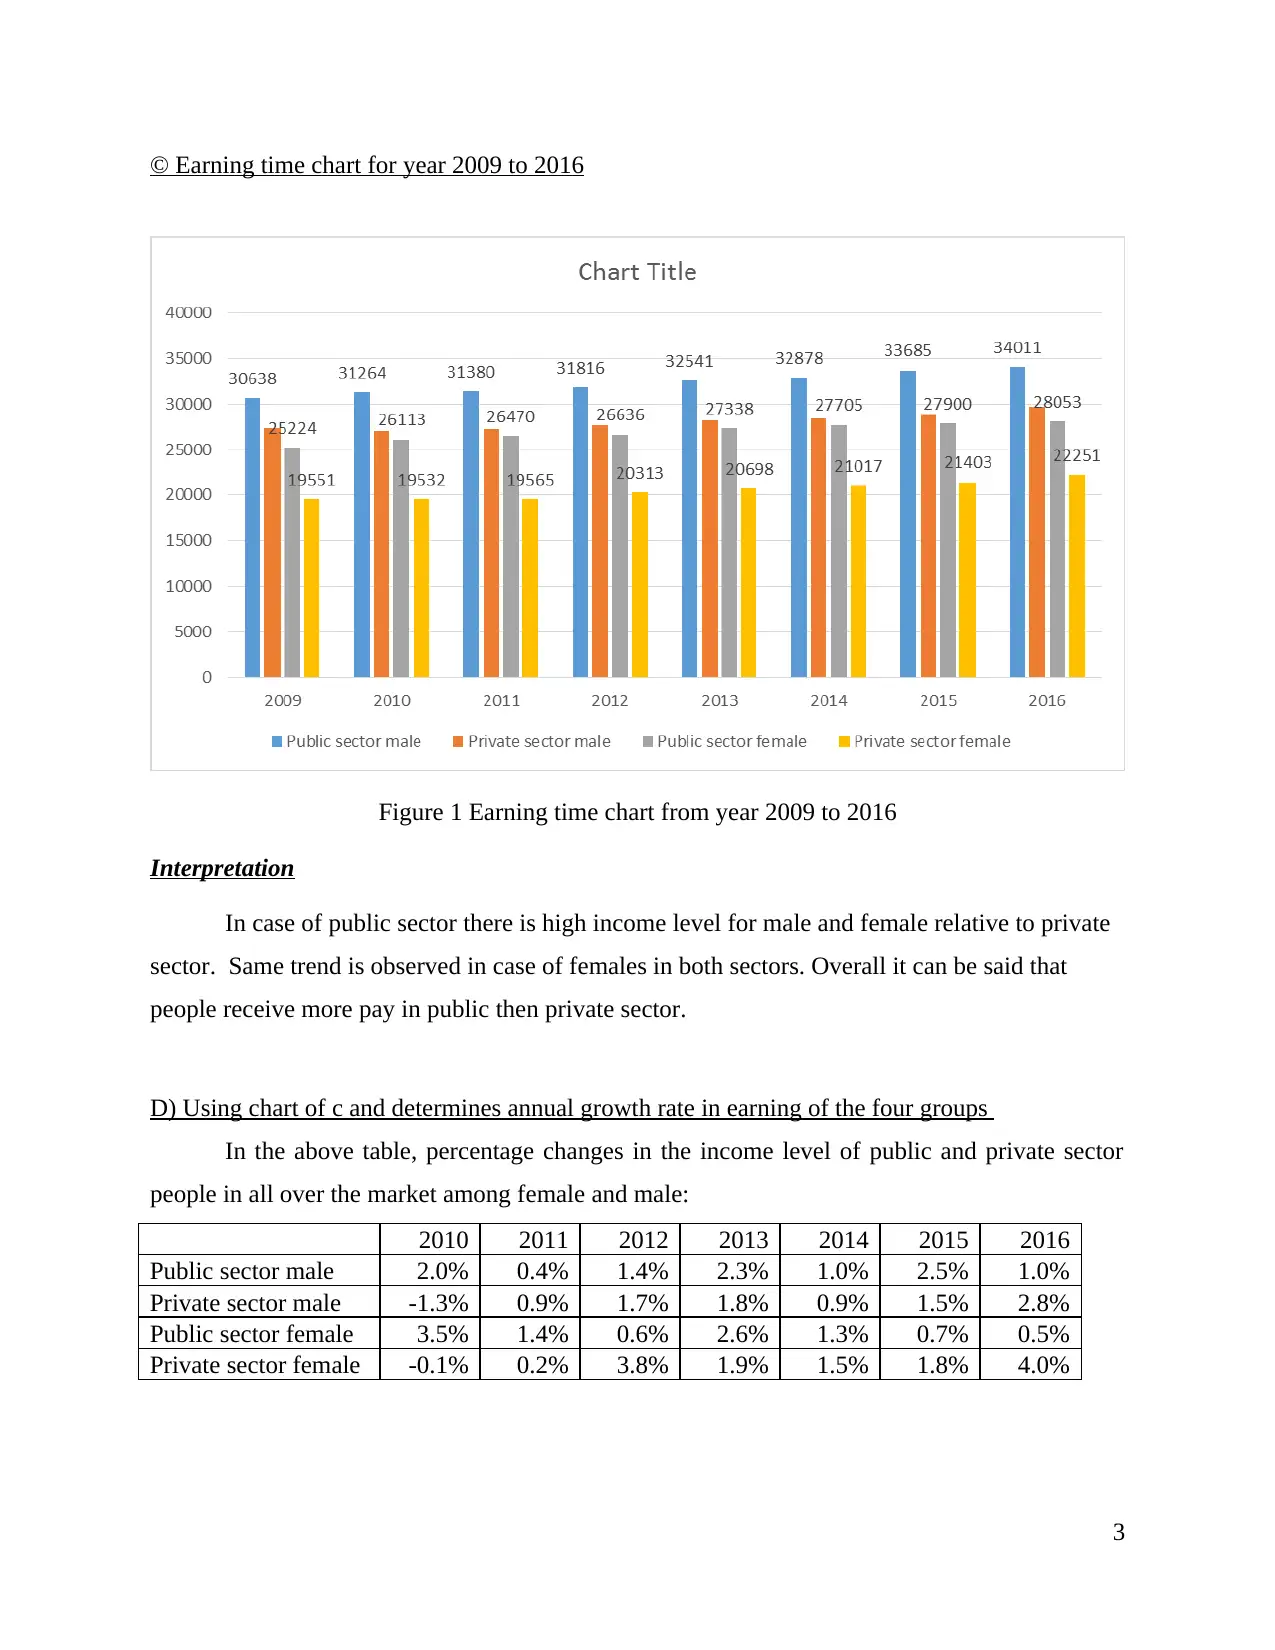
© Earning time chart for year 2009 to 2016
Figure 1 Earning time chart from year 2009 to 2016
Interpretation
In case of public sector there is high income level for male and female relative to private
sector. Same trend is observed in case of females in both sectors. Overall it can be said that
people receive more pay in public then private sector.
D) Using chart of c and determines annual growth rate in earning of the four groups
In the above table, percentage changes in the income level of public and private sector
people in all over the market among female and male:
2010 2011 2012 2013 2014 2015 2016
Public sector male 2.0% 0.4% 1.4% 2.3% 1.0% 2.5% 1.0%
Private sector male -1.3% 0.9% 1.7% 1.8% 0.9% 1.5% 2.8%
Public sector female 3.5% 1.4% 0.6% 2.6% 1.3% 0.7% 0.5%
Private sector female -0.1% 0.2% 3.8% 1.9% 1.5% 1.8% 4.0%
3
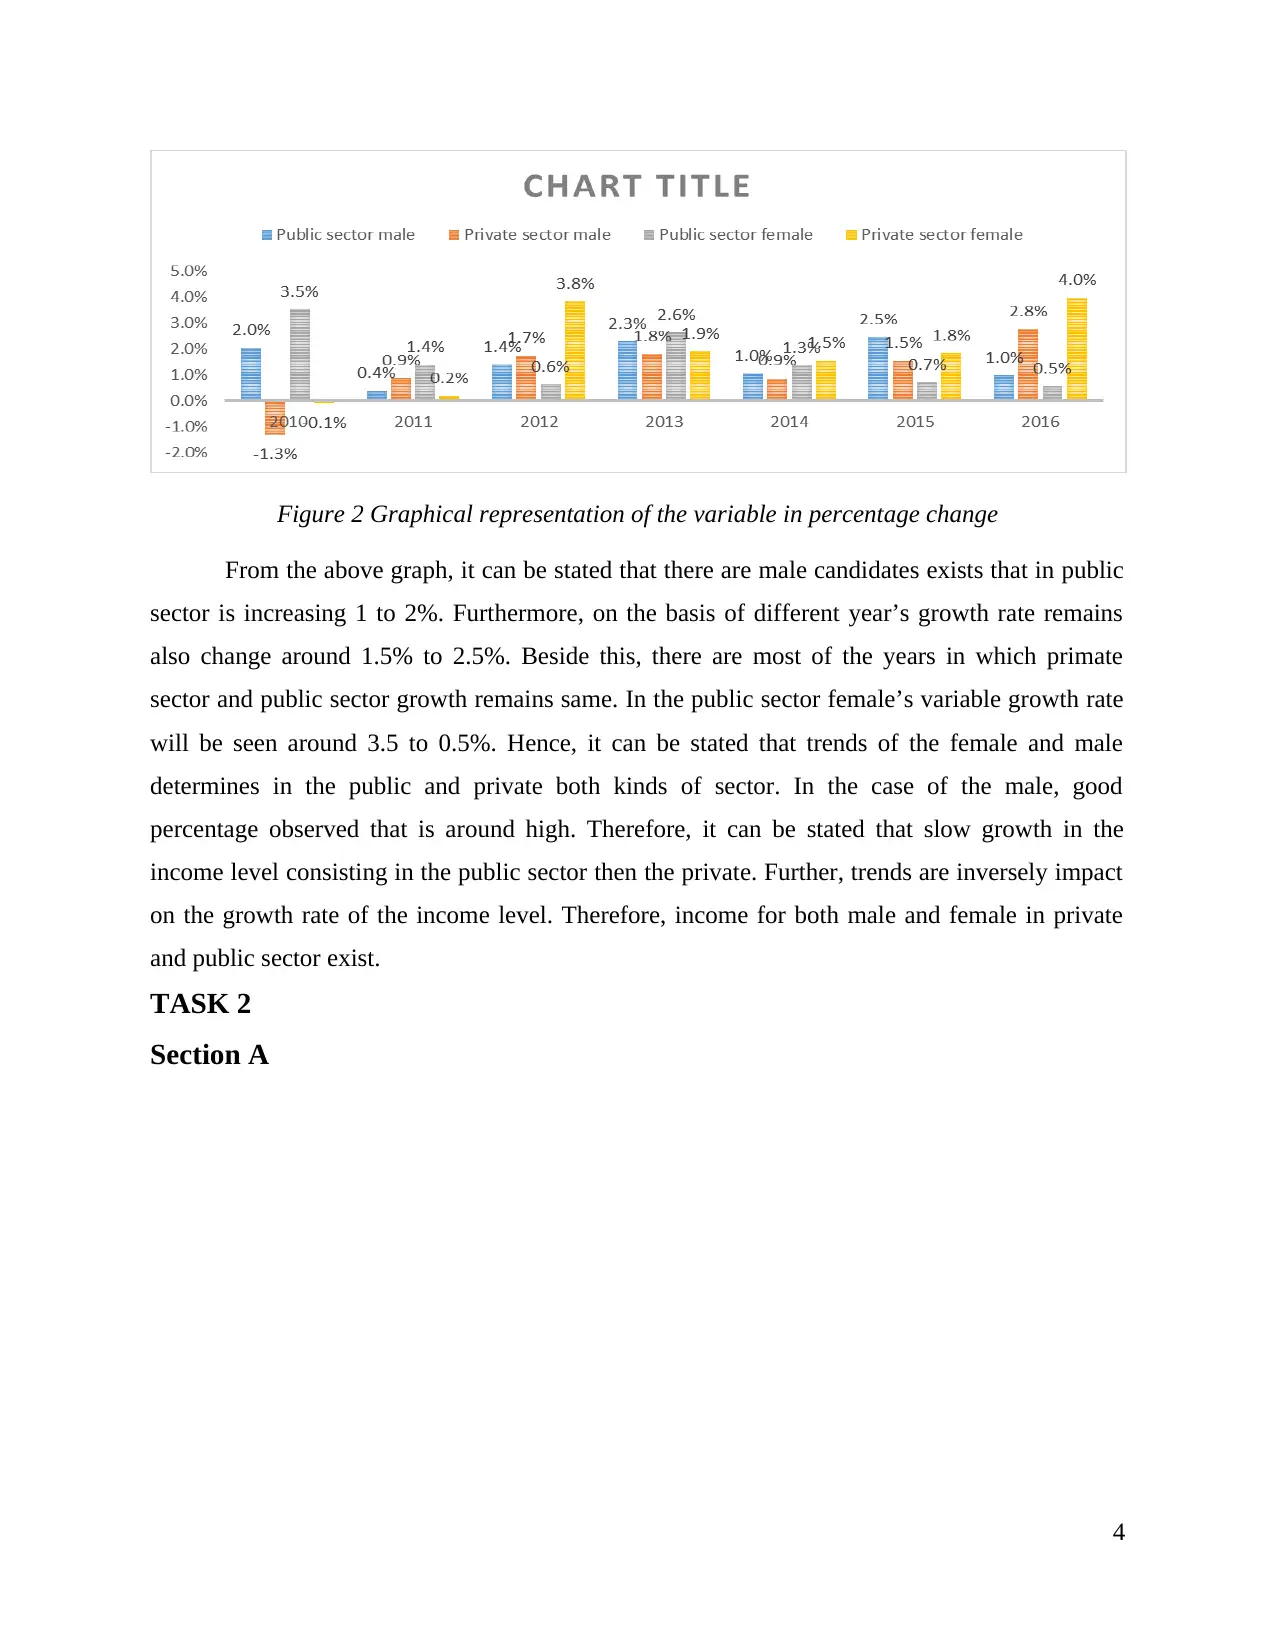
Figure 2 Graphical representation of the variable in percentage change
From the above graph, it can be stated that there are male candidates exists that in public
sector is increasing 1 to 2%. Furthermore, on the basis of different year’s growth rate remains
also change around 1.5% to 2.5%. Beside this, there are most of the years in which primate
sector and public sector growth remains same. In the public sector female’s variable growth rate
will be seen around 3.5 to 0.5%. Hence, it can be stated that trends of the female and male
determines in the public and private both kinds of sector. In the case of the male, good
percentage observed that is around high. Therefore, it can be stated that slow growth in the
income level consisting in the public sector then the private. Further, trends are inversely impact
on the growth rate of the income level. Therefore, income for both male and female in private
and public sector exist.
TASK 2
Section A
4
⊘ This is a preview!⊘
Do you want full access?
Subscribe today to unlock all pages.
Trusted by 1+ million students worldwide
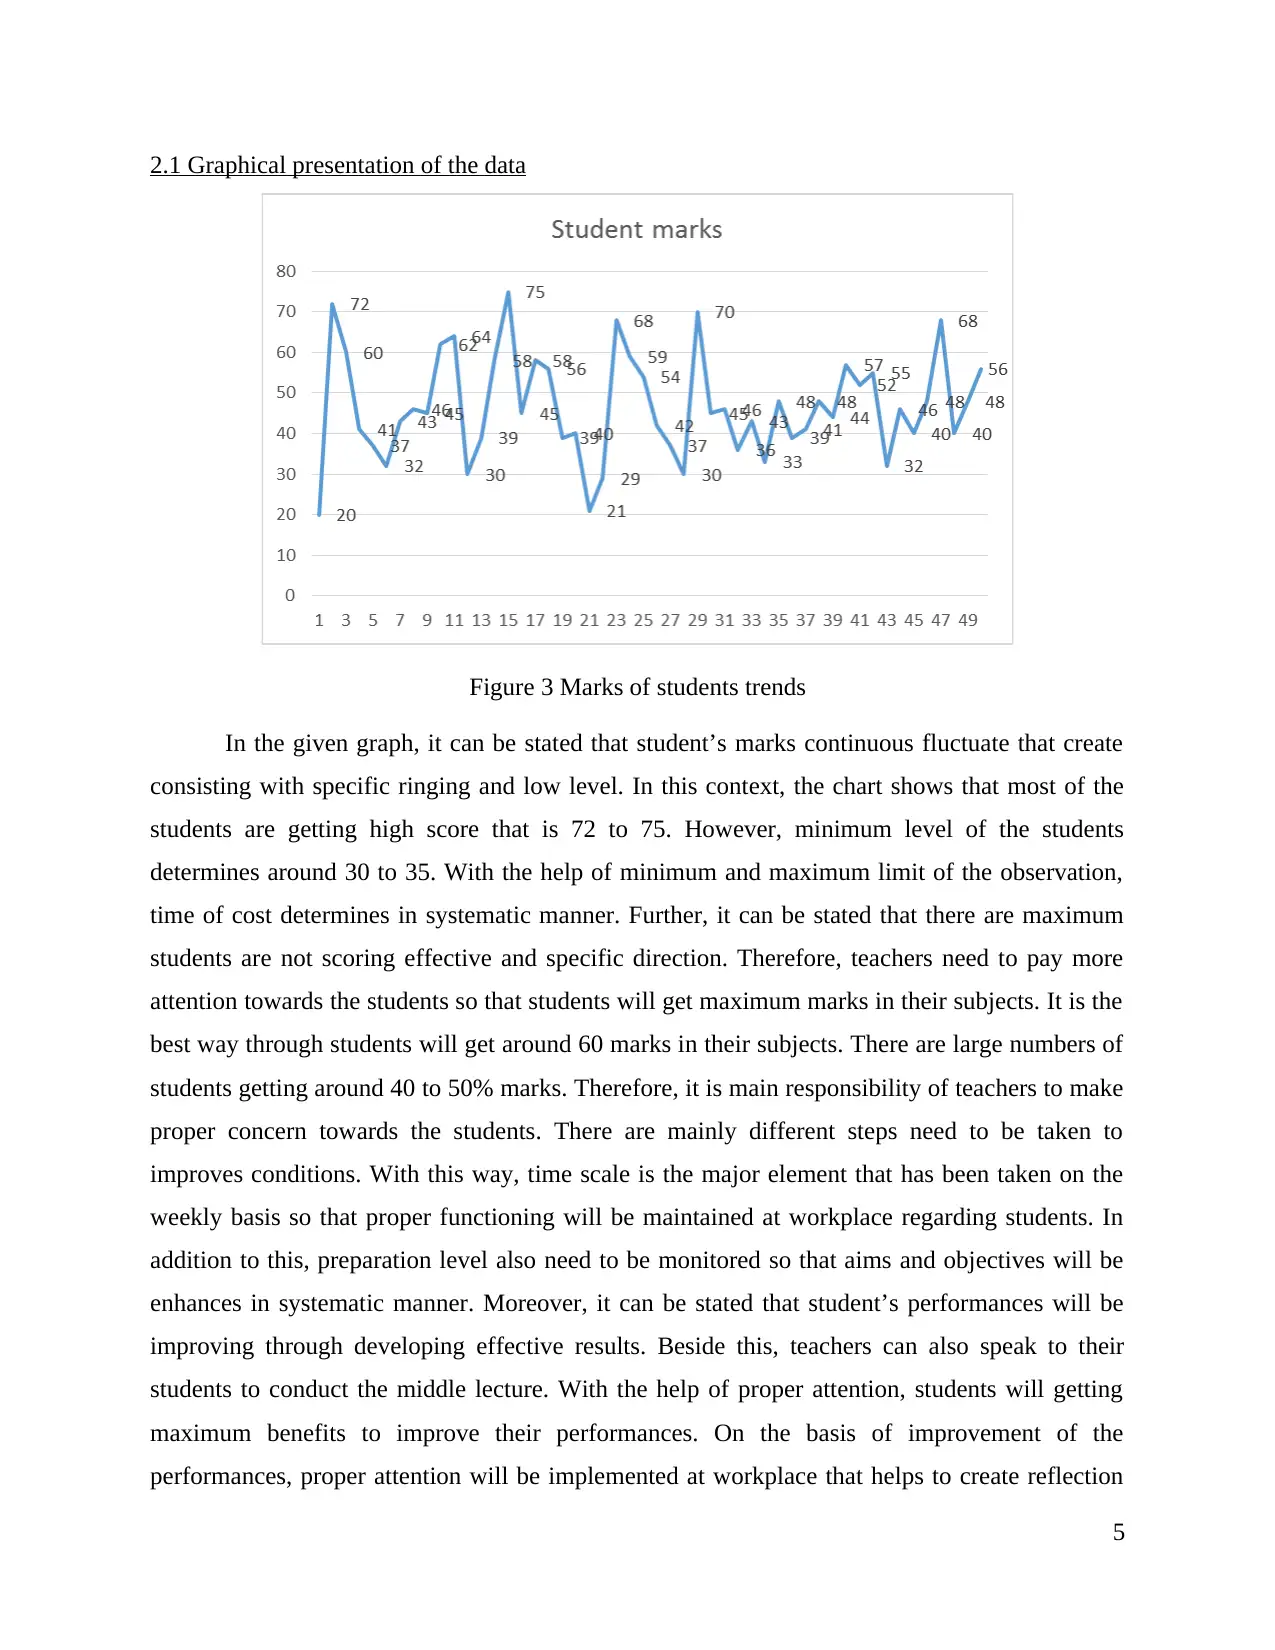
2.1 Graphical presentation of the data
Figure 3 Marks of students trends
In the given graph, it can be stated that student’s marks continuous fluctuate that create
consisting with specific ringing and low level. In this context, the chart shows that most of the
students are getting high score that is 72 to 75. However, minimum level of the students
determines around 30 to 35. With the help of minimum and maximum limit of the observation,
time of cost determines in systematic manner. Further, it can be stated that there are maximum
students are not scoring effective and specific direction. Therefore, teachers need to pay more
attention towards the students so that students will get maximum marks in their subjects. It is the
best way through students will get around 60 marks in their subjects. There are large numbers of
students getting around 40 to 50% marks. Therefore, it is main responsibility of teachers to make
proper concern towards the students. There are mainly different steps need to be taken to
improves conditions. With this way, time scale is the major element that has been taken on the
weekly basis so that proper functioning will be maintained at workplace regarding students. In
addition to this, preparation level also need to be monitored so that aims and objectives will be
enhances in systematic manner. Moreover, it can be stated that student’s performances will be
improving through developing effective results. Beside this, teachers can also speak to their
students to conduct the middle lecture. With the help of proper attention, students will getting
maximum benefits to improve their performances. On the basis of improvement of the
performances, proper attention will be implemented at workplace that helps to create reflection
5
Paraphrase This Document
Need a fresh take? Get an instant paraphrase of this document with our AI Paraphraser
the student’s performances. Along with this, performances will be reflected through the chart
that assists to create effective functioning in the performances improvements. This is because,
maximum number of students helps to create great extent at workplace. When presents are also
pay their proper attention to grow their children, they can easily improve effective performances
in the business. In the school hours and proper attention of the students create effectiveness at
workplace. As results, parents require proper guidance and attention towards the children.
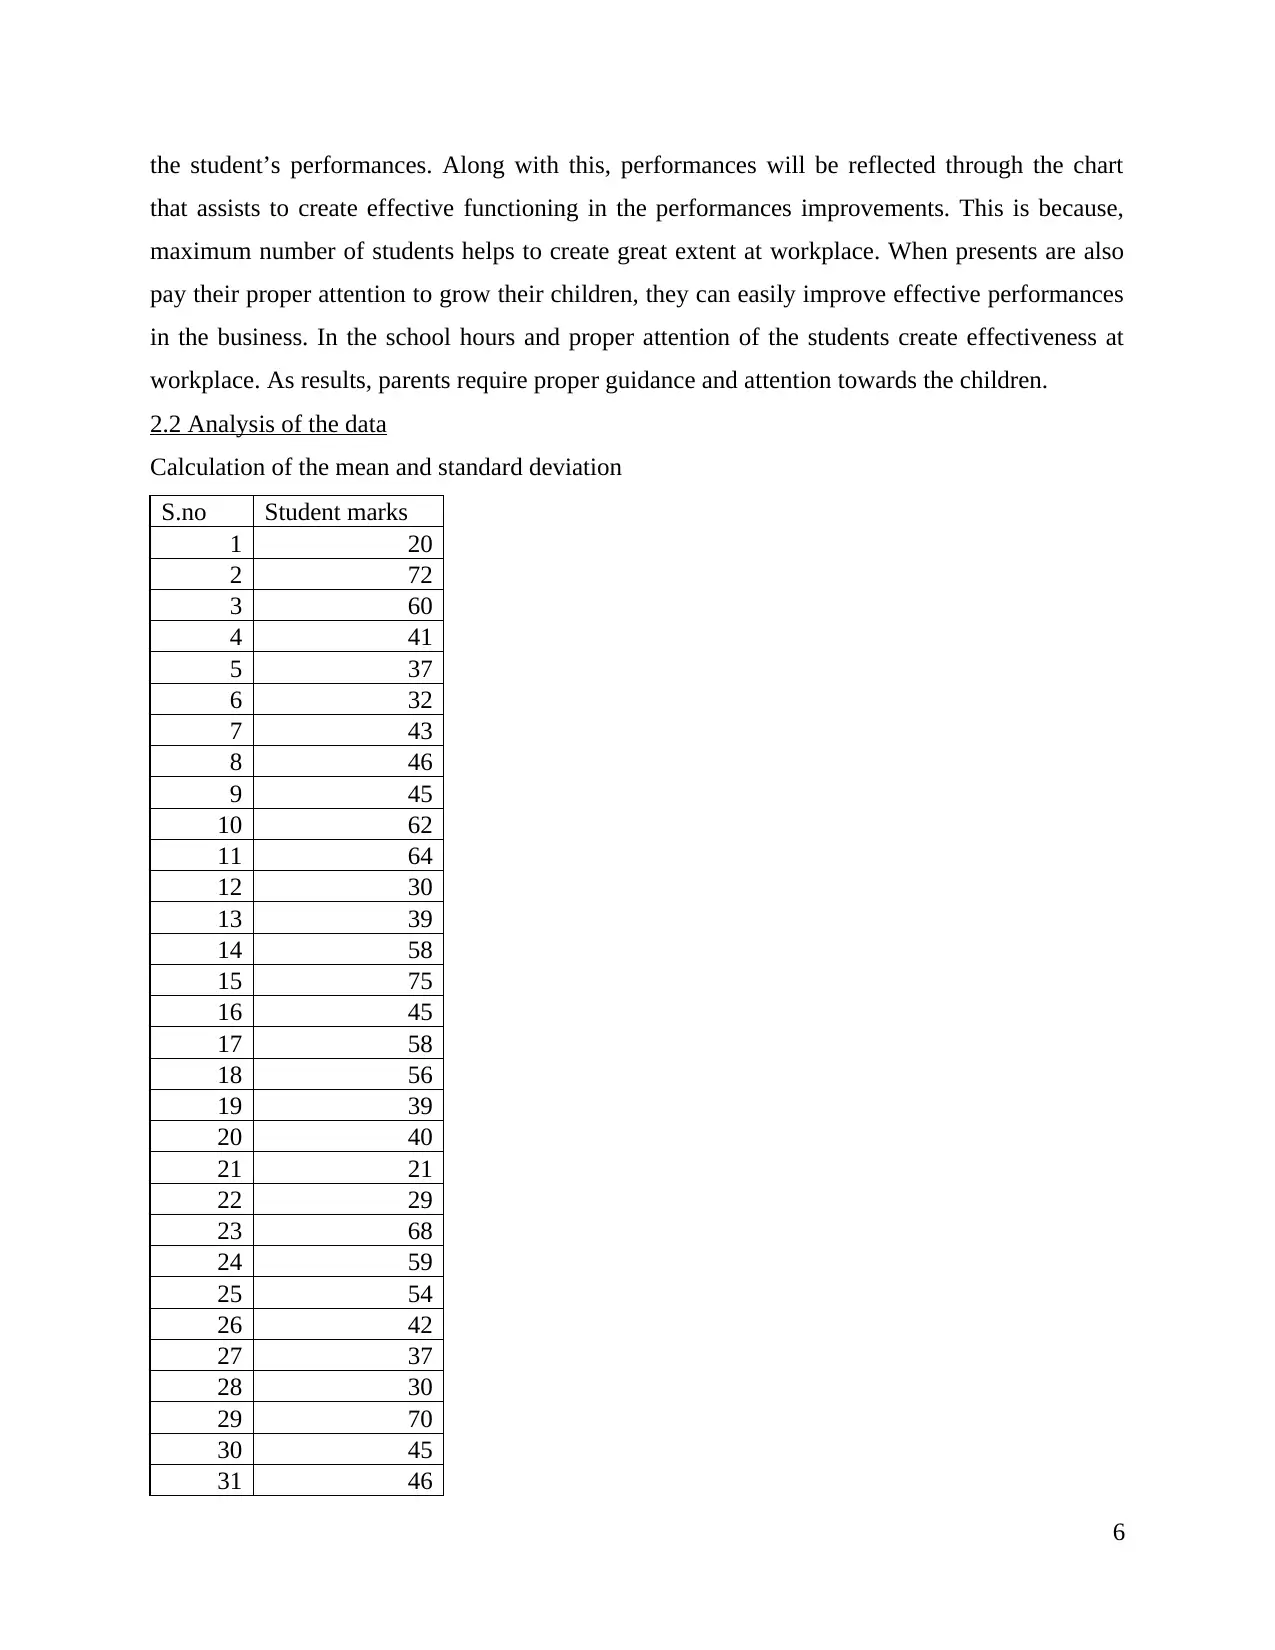
2.2 Analysis of the data
Calculation of the mean and standard deviation
S.no Student marks
1 20
2 72
3 60
4 41
5 37
6 32
7 43
8 46
9 45
10 62
11 64
12 30
13 39
14 58
15 75
16 45
17 58
18 56
19 39
20 40
21 21
22 29
23 68
24 59
25 54
26 42
27 37
28 30
29 70
30 45
31 46
6
that assists to create effective functioning in the performances improvements. This is because,
maximum number of students helps to create great extent at workplace. When presents are also
pay their proper attention to grow their children, they can easily improve effective performances
in the business. In the school hours and proper attention of the students create effectiveness at
workplace. As results, parents require proper guidance and attention towards the children.
2.2 Analysis of the data
Calculation of the mean and standard deviation
S.no Student marks
1 20
2 72
3 60
4 41
5 37
6 32
7 43
8 46
9 45
10 62
11 64
12 30
13 39
14 58
15 75
16 45
17 58
18 56
19 39
20 40
21 21
22 29
23 68
24 59
25 54
26 42
27 37
28 30
29 70
30 45
31 46
6
32 36
33 43
34 33
35 48
36 39
37 41
38 48
39 44
40 57
41 52
42 55
43 32
44 46
45 40
46 48
47 68
48 40
49 48
50 56
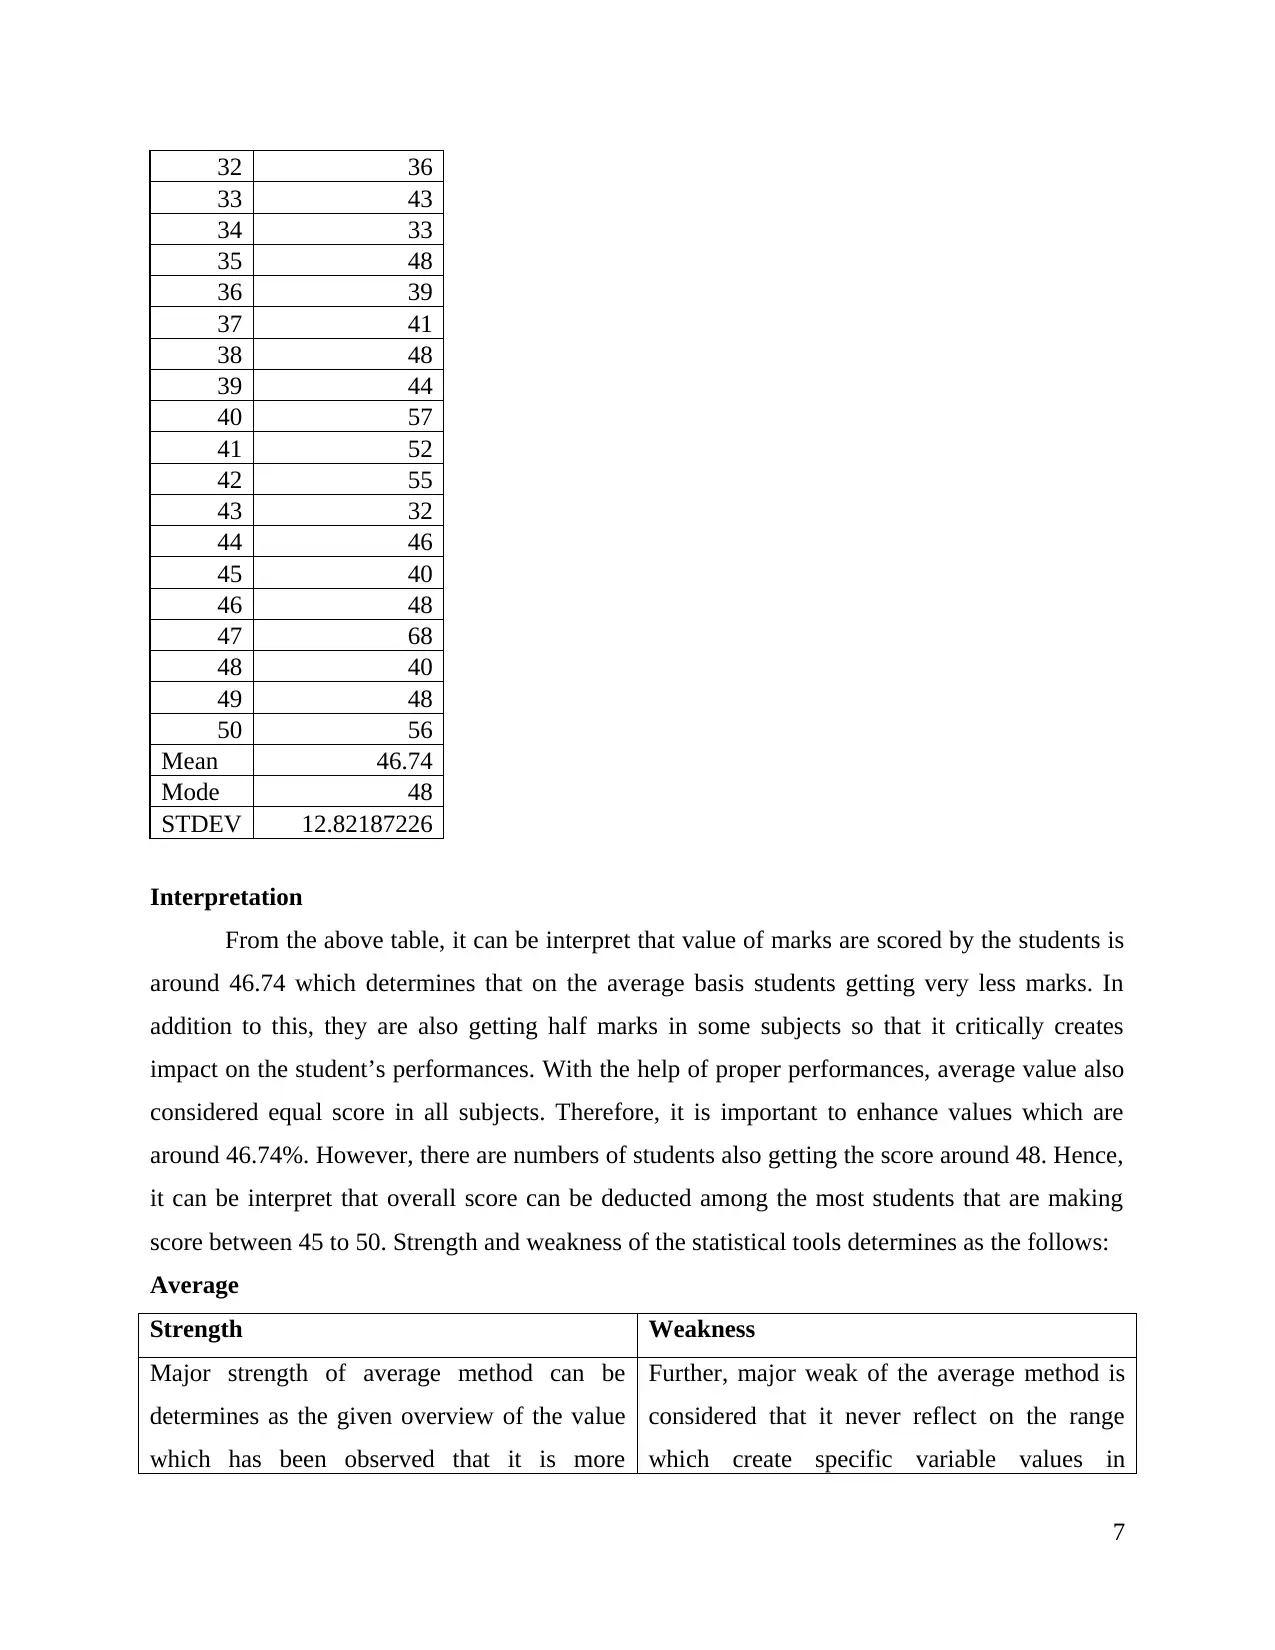
Mean 46.74
Mode 48
STDEV 12.82187226
Interpretation
From the above table, it can be interpret that value of marks are scored by the students is
around 46.74 which determines that on the average basis students getting very less marks. In
addition to this, they are also getting half marks in some subjects so that it critically creates
impact on the student’s performances. With the help of proper performances, average value also
considered equal score in all subjects. Therefore, it is important to enhance values which are
around 46.74%. However, there are numbers of students also getting the score around 48. Hence,
it can be interpret that overall score can be deducted among the most students that are making
score between 45 to 50. Strength and weakness of the statistical tools determines as the follows:
Average
Strength Weakness
Major strength of average method can be
determines as the given overview of the value
which has been observed that it is more
Further, major weak of the average method is
considered that it never reflect on the range
which create specific variable values in
7
33 43
34 33
35 48
36 39
37 41
38 48
39 44
40 57
41 52
42 55
43 32
44 46
45 40
46 48
47 68
48 40
49 48
50 56
Mean 46.74
Mode 48
STDEV 12.82187226
Interpretation
From the above table, it can be interpret that value of marks are scored by the students is
around 46.74 which determines that on the average basis students getting very less marks. In
addition to this, they are also getting half marks in some subjects so that it critically creates
impact on the student’s performances. With the help of proper performances, average value also
considered equal score in all subjects. Therefore, it is important to enhance values which are
around 46.74%. However, there are numbers of students also getting the score around 48. Hence,
it can be interpret that overall score can be deducted among the most students that are making
score between 45 to 50. Strength and weakness of the statistical tools determines as the follows:
Average
Strength Weakness
Major strength of average method can be
determines as the given overview of the value
which has been observed that it is more
Further, major weak of the average method is
considered that it never reflect on the range
which create specific variable values in
7
⊘ This is a preview!⊘
Do you want full access?
Subscribe today to unlock all pages.
Trusted by 1+ million students worldwide
frequently. systematic manner. Further, overview of the
variable determines as the terms of range
which assists to create observation of the
variable (Cressie, 2015).
Mode
Strength Weakness
Major strength of mode in the present
calculation has defines as the identification of
data from the database. In addition to this, it is
also helpful aspects that create attraction of
managers in the specific direction.
Major weakness exist in the mode is reveal
range which take place from the mean value
observation.
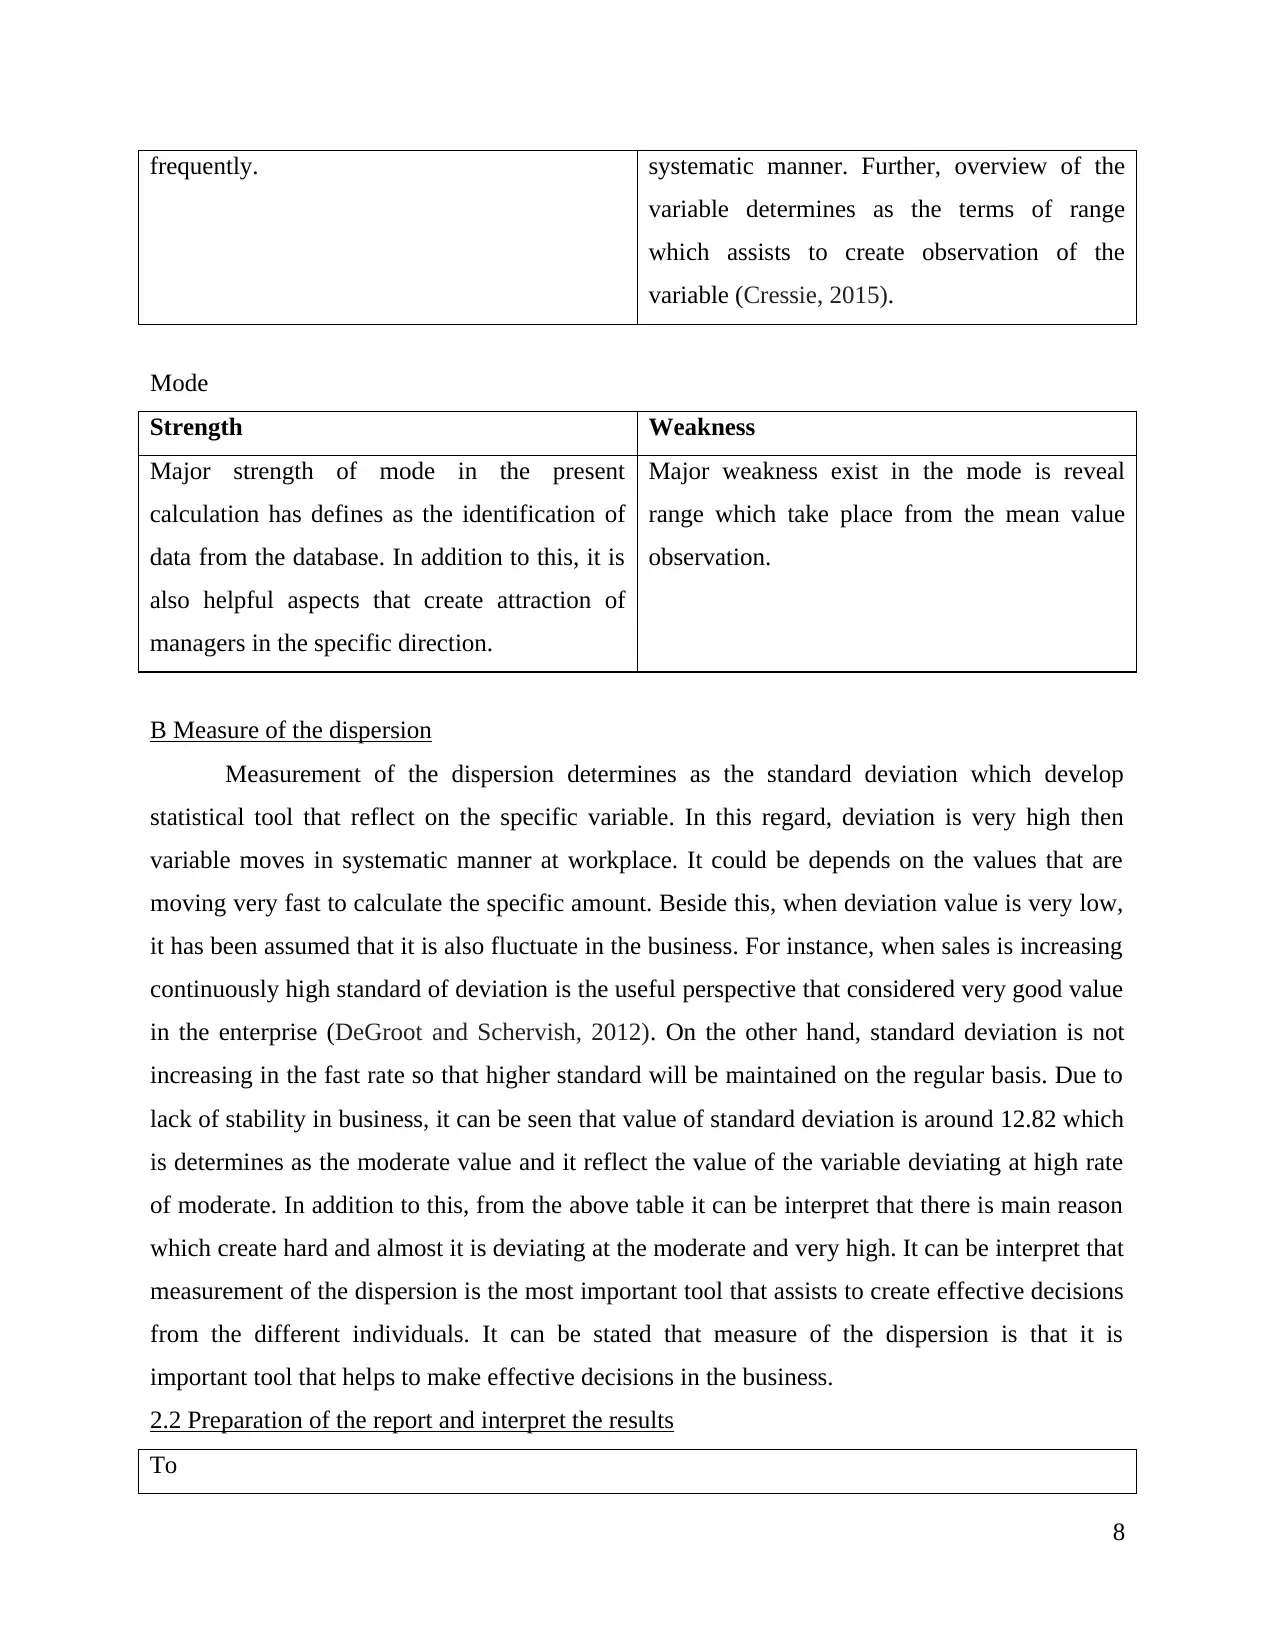
B Measure of the dispersion
Measurement of the dispersion determines as the standard deviation which develop
statistical tool that reflect on the specific variable. In this regard, deviation is very high then
variable moves in systematic manner at workplace. It could be depends on the values that are
moving very fast to calculate the specific amount. Beside this, when deviation value is very low,
it has been assumed that it is also fluctuate in the business. For instance, when sales is increasing
continuously high standard of deviation is the useful perspective that considered very good value
in the enterprise (DeGroot and Schervish, 2012). On the other hand, standard deviation is not
increasing in the fast rate so that higher standard will be maintained on the regular basis. Due to
lack of stability in business, it can be seen that value of standard deviation is around 12.82 which
is determines as the moderate value and it reflect the value of the variable deviating at high rate
of moderate. In addition to this, from the above table it can be interpret that there is main reason
which create hard and almost it is deviating at the moderate and very high. It can be interpret that
measurement of the dispersion is the most important tool that assists to create effective decisions
from the different individuals. It can be stated that measure of the dispersion is that it is
important tool that helps to make effective decisions in the business.
2.2 Preparation of the report and interpret the results
To
8
variable determines as the terms of range
which assists to create observation of the
variable (Cressie, 2015).
Mode
Strength Weakness
Major strength of mode in the present
calculation has defines as the identification of
data from the database. In addition to this, it is
also helpful aspects that create attraction of
managers in the specific direction.
Major weakness exist in the mode is reveal
range which take place from the mean value
observation.
B Measure of the dispersion
Measurement of the dispersion determines as the standard deviation which develop
statistical tool that reflect on the specific variable. In this regard, deviation is very high then
variable moves in systematic manner at workplace. It could be depends on the values that are
moving very fast to calculate the specific amount. Beside this, when deviation value is very low,
it has been assumed that it is also fluctuate in the business. For instance, when sales is increasing
continuously high standard of deviation is the useful perspective that considered very good value
in the enterprise (DeGroot and Schervish, 2012). On the other hand, standard deviation is not
increasing in the fast rate so that higher standard will be maintained on the regular basis. Due to
lack of stability in business, it can be seen that value of standard deviation is around 12.82 which
is determines as the moderate value and it reflect the value of the variable deviating at high rate
of moderate. In addition to this, from the above table it can be interpret that there is main reason
which create hard and almost it is deviating at the moderate and very high. It can be interpret that
measurement of the dispersion is the most important tool that assists to create effective decisions
from the different individuals. It can be stated that measure of the dispersion is that it is
important tool that helps to make effective decisions in the business.
2.2 Preparation of the report and interpret the results
To
8
Paraphrase This Document
Need a fresh take? Get an instant paraphrase of this document with our AI Paraphraser
The Director of business Date: 17 January 2018
Subject: Measurement of the students performances
Interpretation of the mean and mode
In the given case, it can be stated that value of mean and mode classified 46.74 and 48
respectively. Therefore, it means that majority of students determines their performances is
around nearly 46.74. There are several numbers of students that score around 48 in exams.
Interpretation of the standard deviation
Value of the standard deviation is the around 12.82 which is considered as the important
perspective in the market. It inducting that there is high fluctuating in the markets which is
deviating at the fast rate due to difficult. It makes estimation of the direction to students to make
high score in the future.
Ways that adopted to create comparison among the different subjects
In respect to make comparison, it can be determines that t test will be used by the analyst to find
useful information. This is because, with the help of t test it can be assessed that it assists to find
useful information which create significance results in systematic manner. Beside this, ANOVA
and the analysis of the variance also used by the firms (Huber, 2011). This is because, in the
exams results will be compared with the each other on the basis of different parameter. Hence, it
can be stated that ANOVA and t test both have importance in the business to develop effective
results at workplace. With the help of identifying scored marks, it can be stated that firms can
easily identified that marks can be scored by the students in both exams are same or distinctive
from the each other.
Ways to measures association between the two different subjects
In order to measures association between the two subjects correlation analysis will be used. This
is because, mentioned tool also helps to identify that extent of the above variable also considered
relations with each other that assist to create effective functioning. Beside this, chi squire tool
also used for the analysis purposes. This is because, same correlation identify major extension.
9
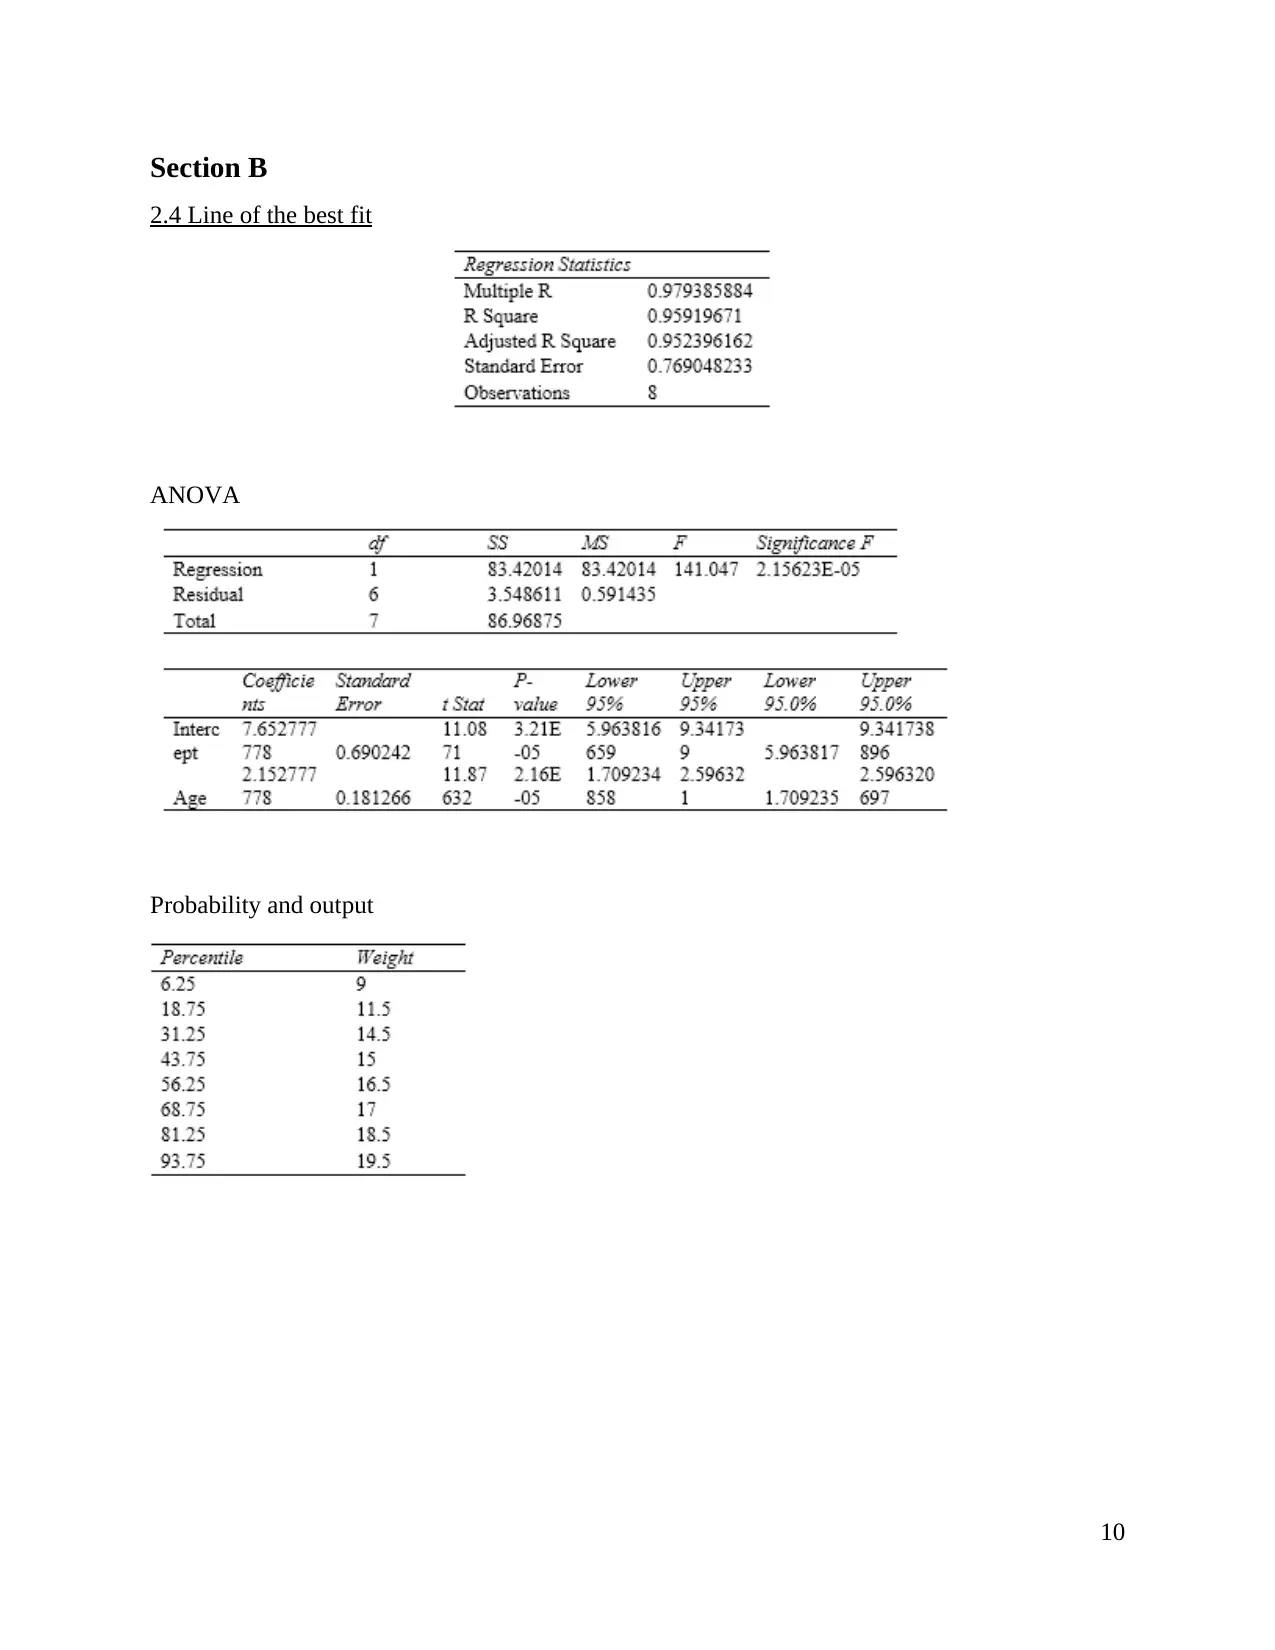
Section B
2.4 Line of the best fit
ANOVA
Probability and output
10
2.4 Line of the best fit
ANOVA
Probability and output
10
⊘ This is a preview!⊘
Do you want full access?
Subscribe today to unlock all pages.
Trusted by 1+ million students worldwide
1 out of 22
Related Documents


Your All-in-One AI-Powered Toolkit for Academic Success.
+13062052269
info@desklib.com
Available 24*7 on WhatsApp / Email
![[object Object]](/_next/static/media/star-bottom.7253800d.svg)
Unlock your academic potential
Copyright © 2020–2026 A2Z Services. All Rights Reserved. Developed and managed by ZUCOL.