Analysis of Hippotherapy Data using R: Assignment Solution
VerifiedAdded on 2022/09/11
|5
|1444
|23
Homework Assignment
AI Summary
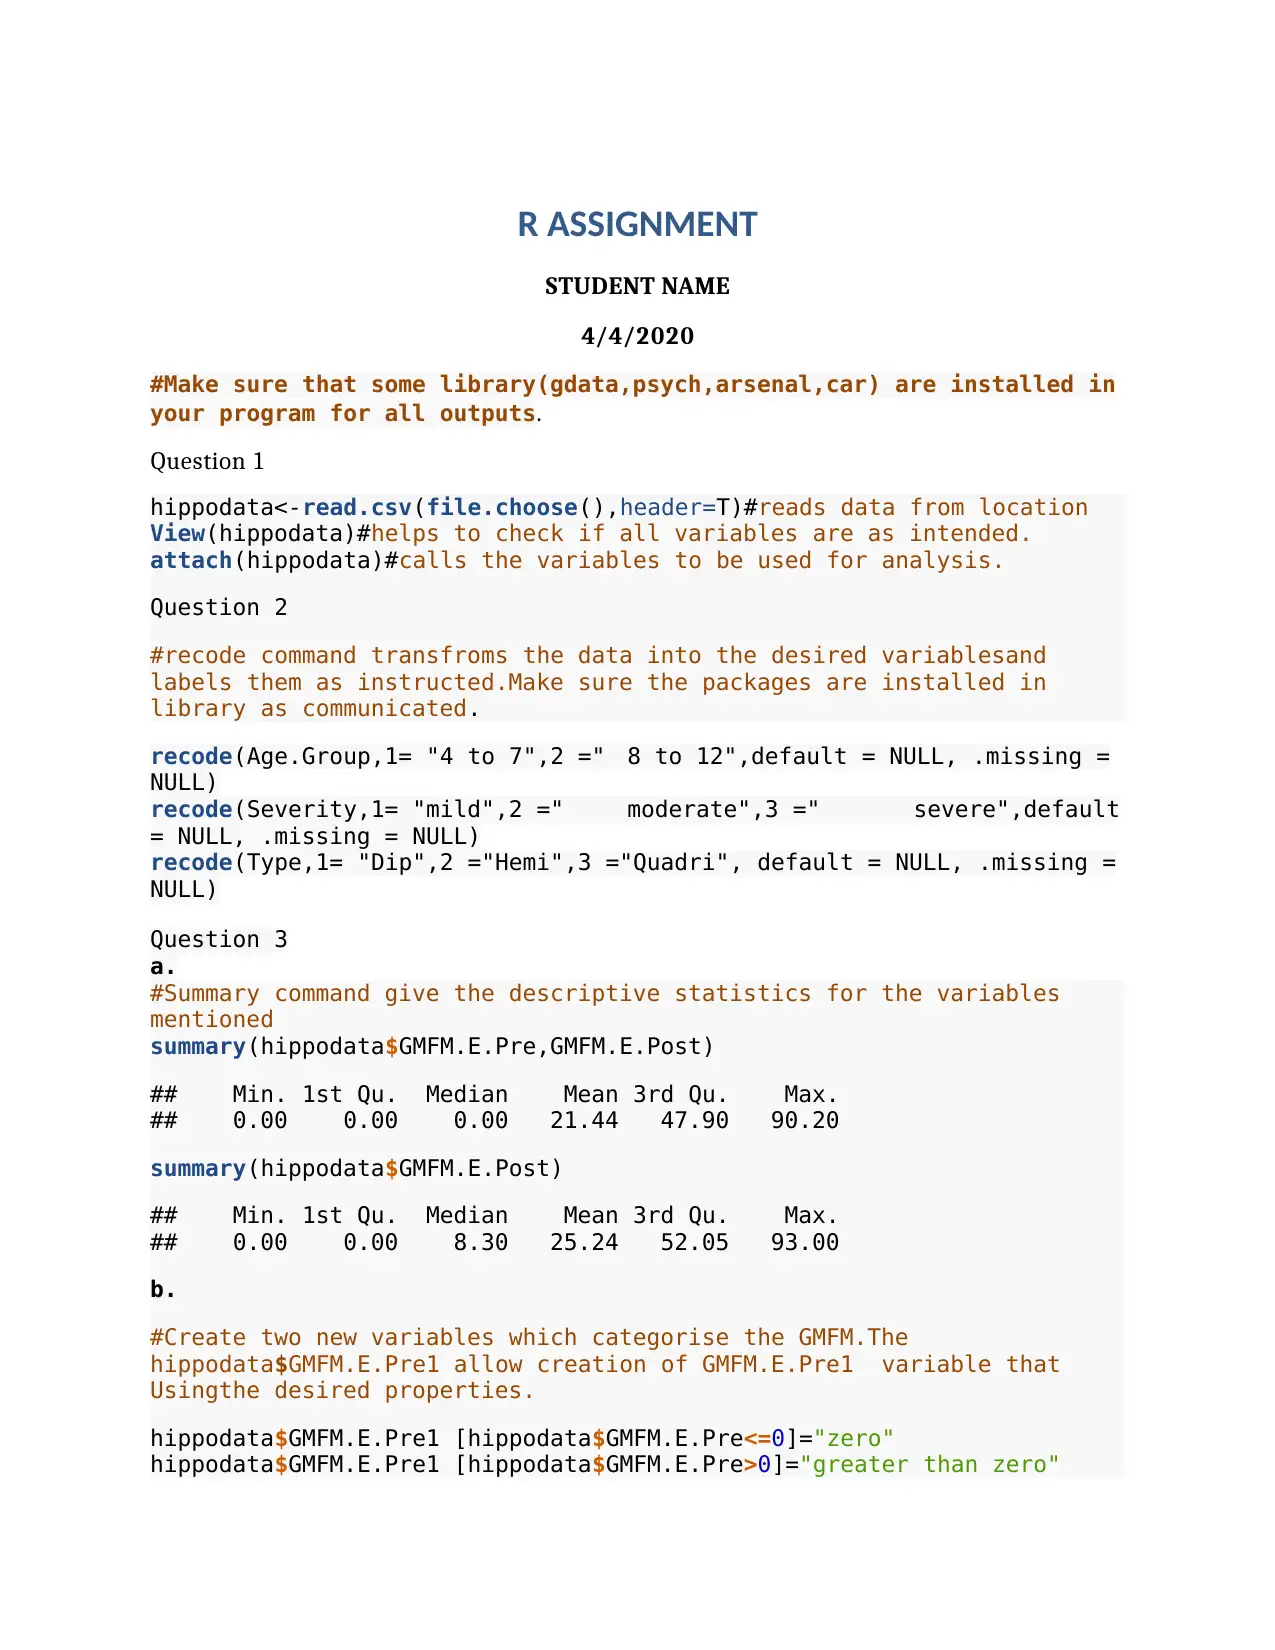
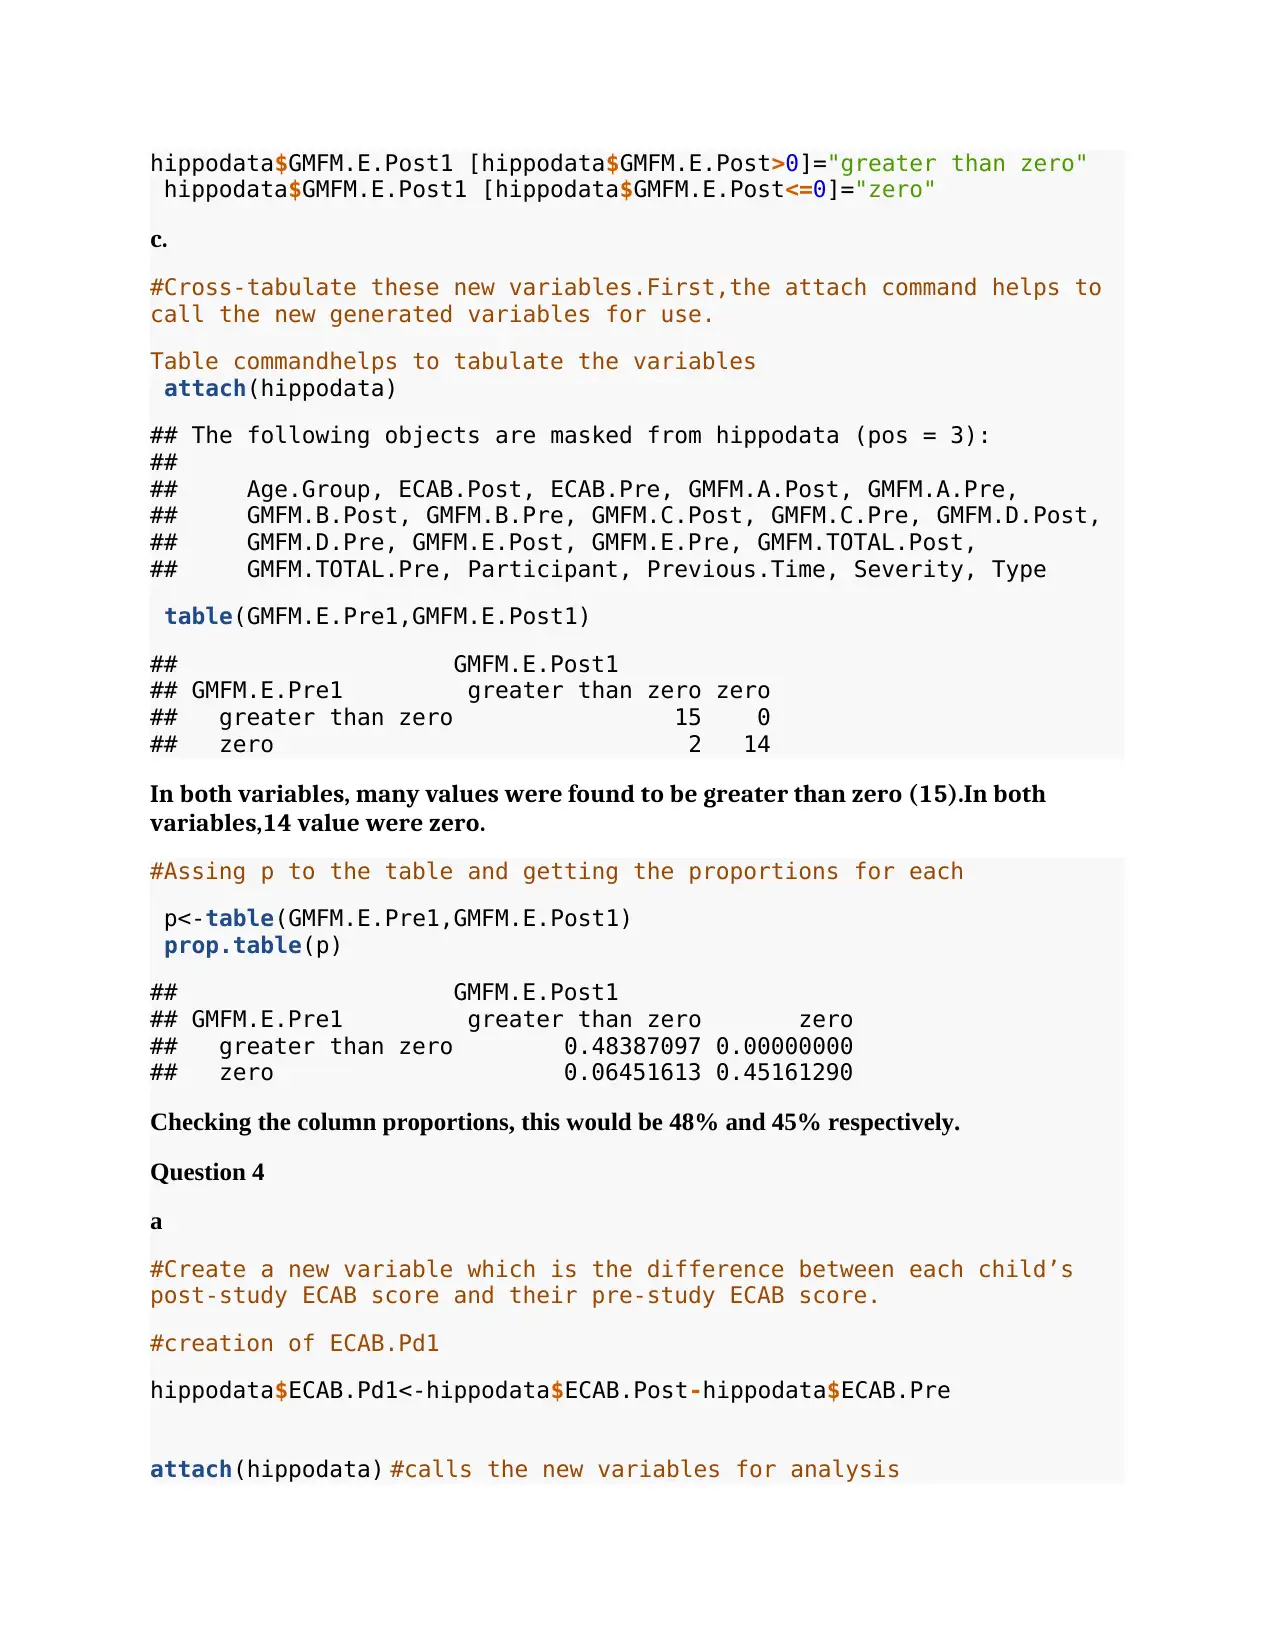
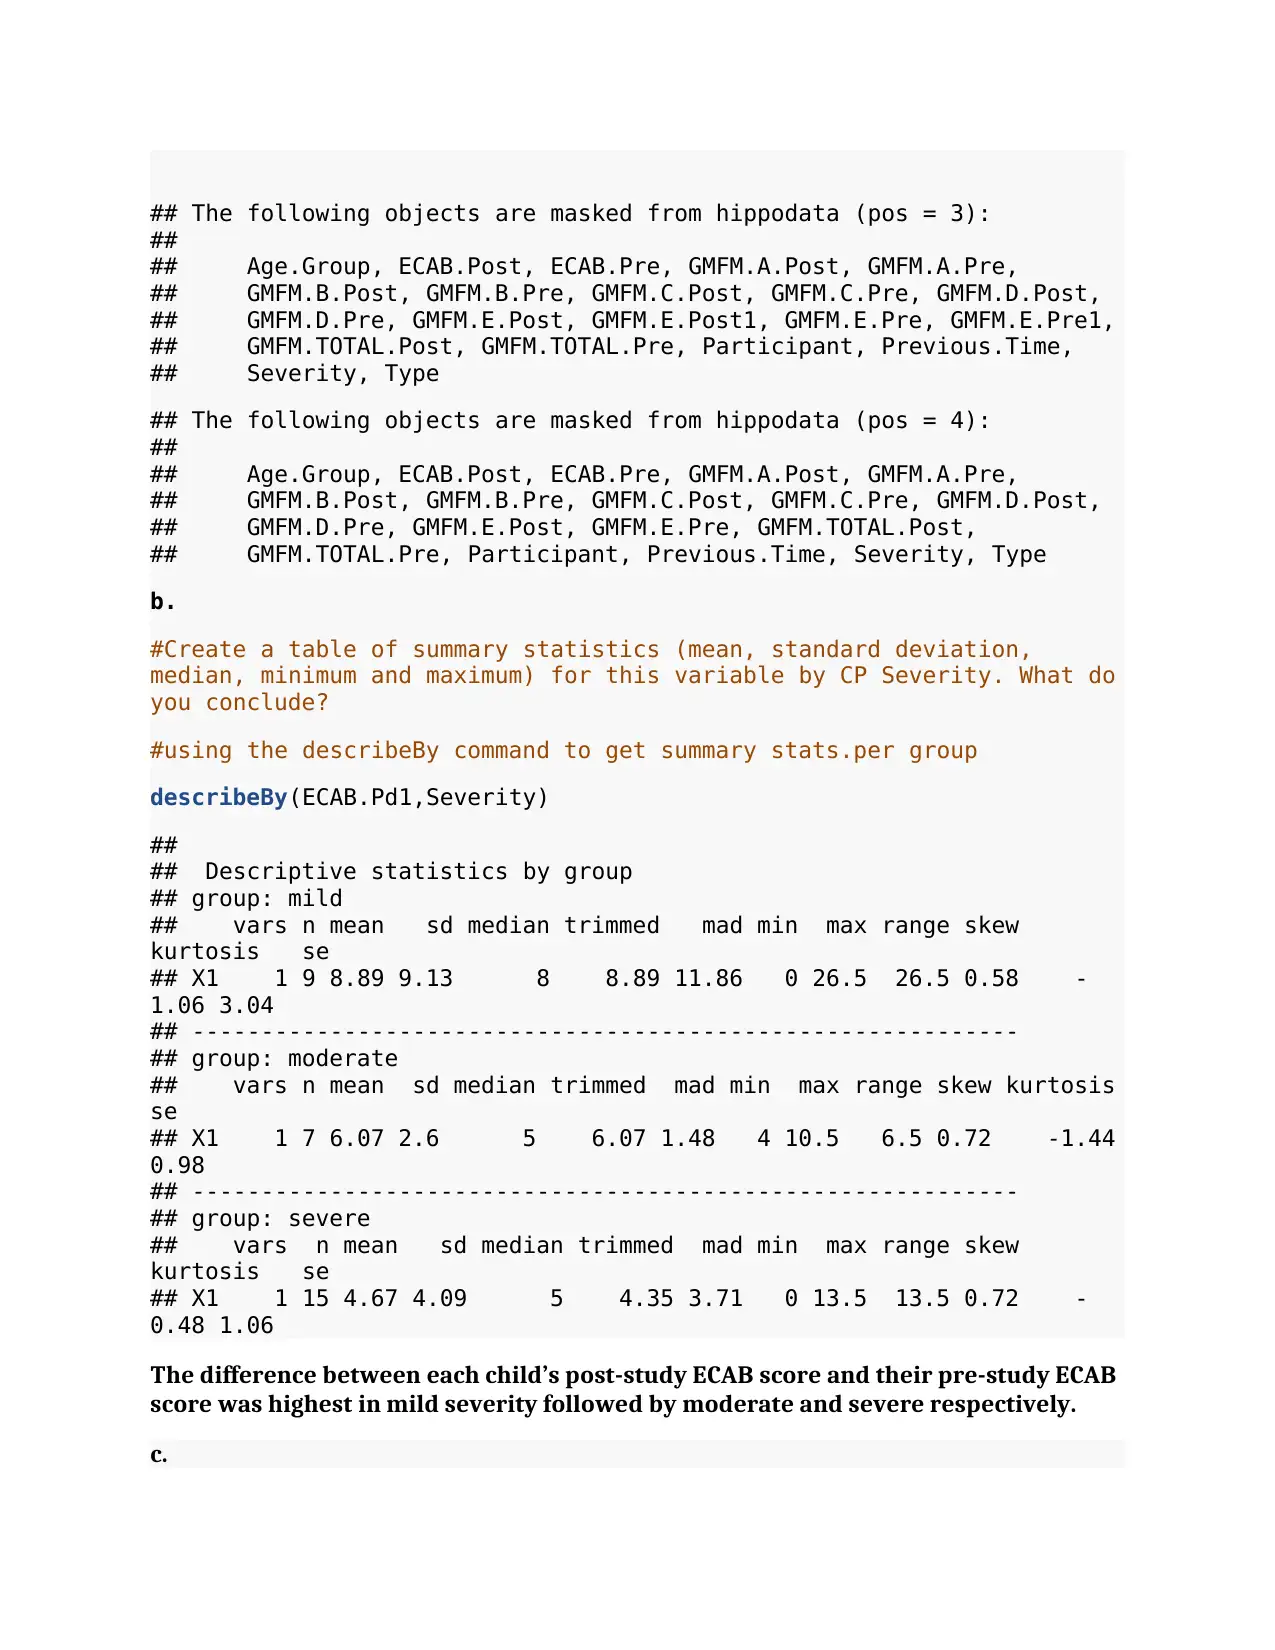
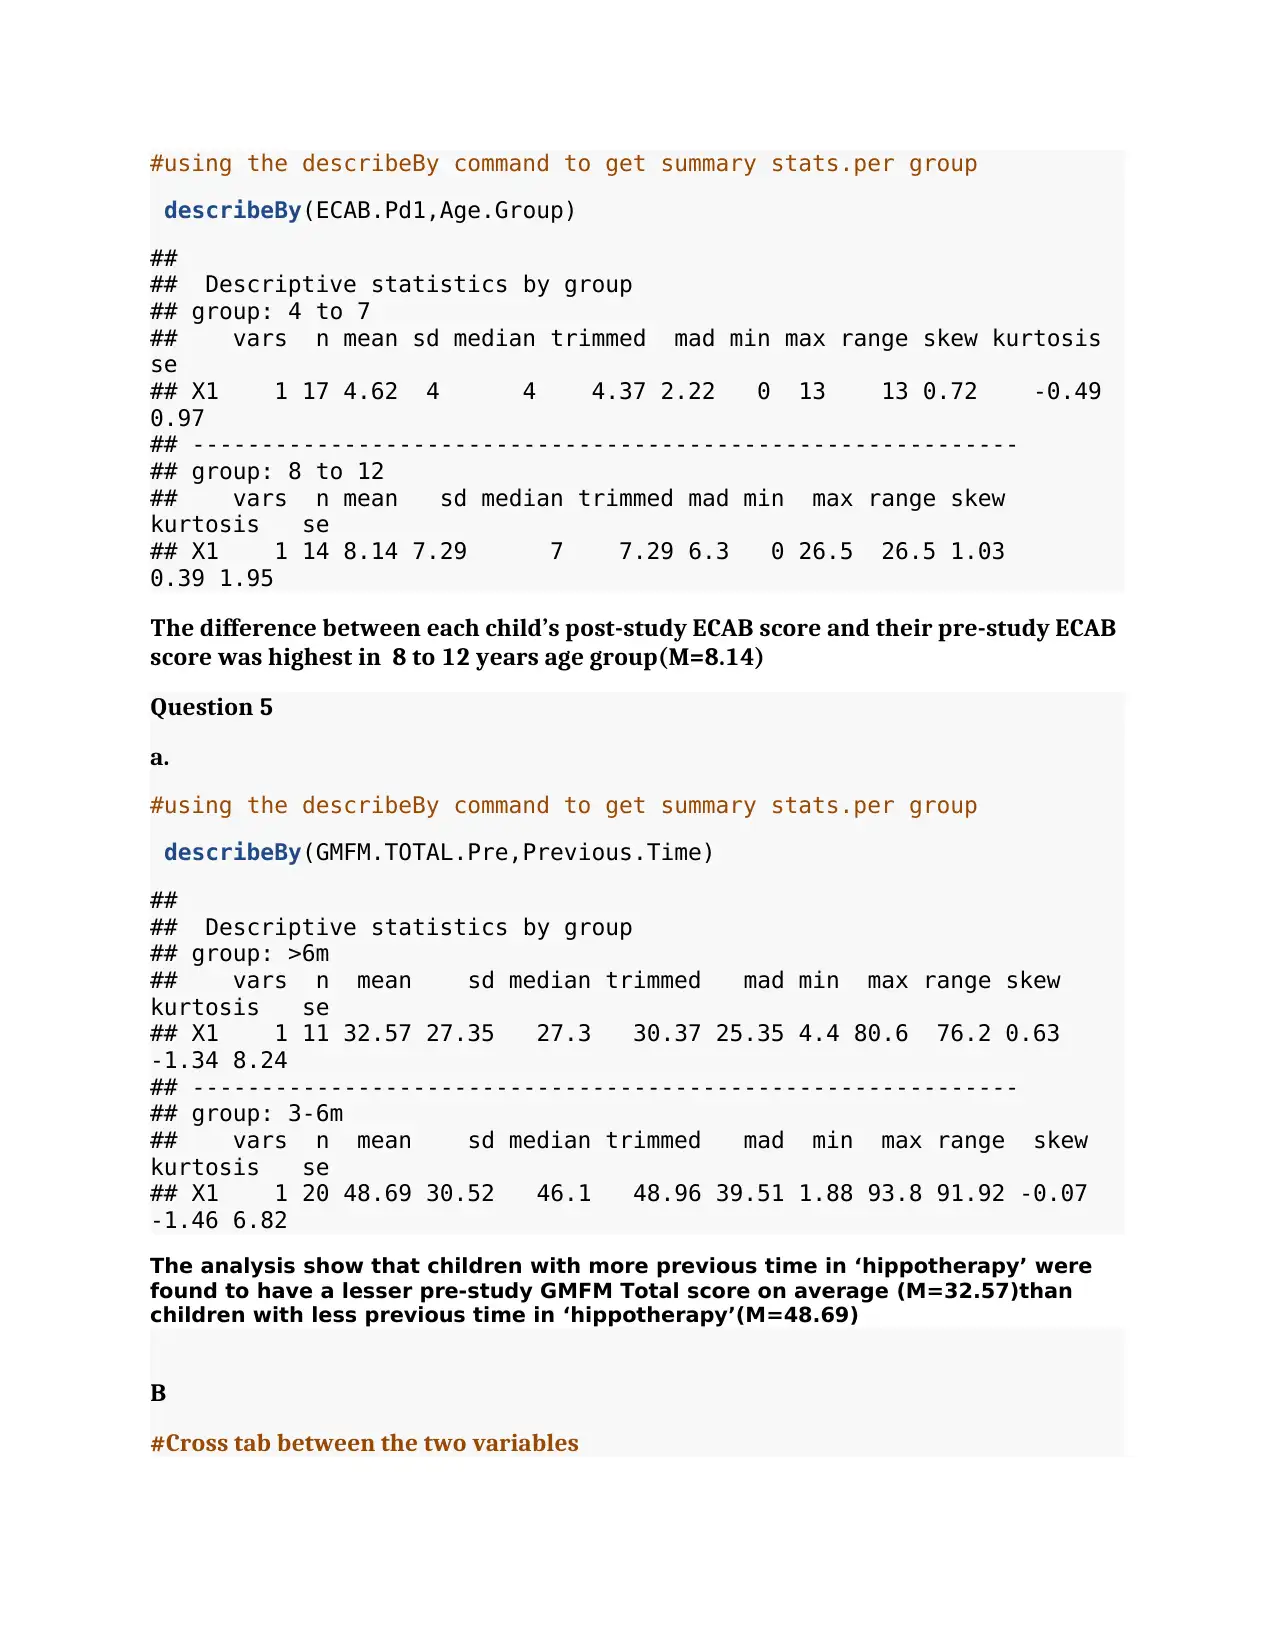
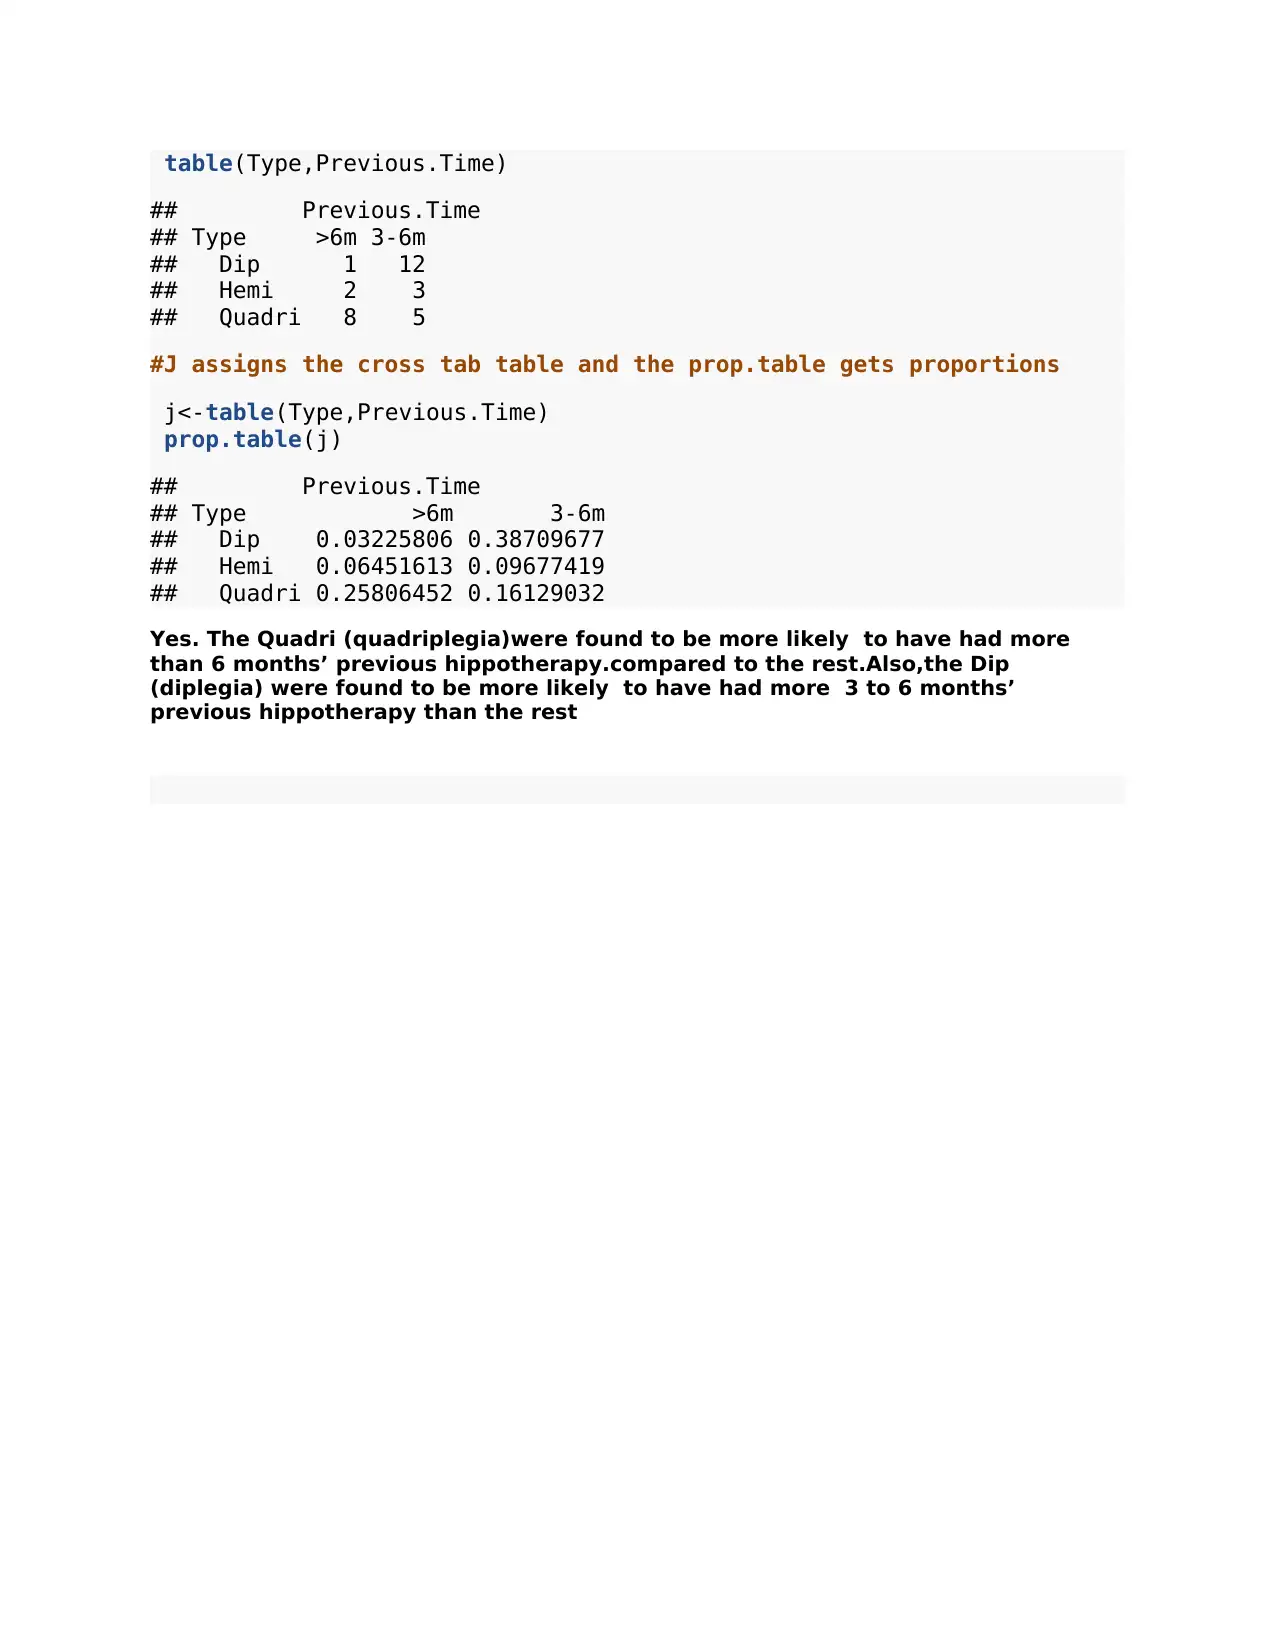
This R assignment analyzes data from a study on hippotherapy for children with Cerebral Palsy. The solution involves reading and manipulating data, recoding variables, and generating descriptive statistics. The assignment covers creating new variables, cross-tabulating data, and calculating di...

R ASSIGNMENT
STUDENT NAME
4/4/2020
#Make sure that some library(gdata,psych,arsenal,car) are installed in
your program for all outputs.
Question 1
hippodata<-read.csv(file.choose(),header=T)#reads data from location
View(hippodata)#helps to check if all variables are as intended.
attach(hippodata)#calls the variables to be used for analysis.
Question 2
#recode command transfroms the data into the desired variablesand
labels them as instructed.Make sure the packages are installed in
library as communicated.
recode(Age.Group,1= "4 to 7",2 =" 8 to 12",default = NULL, .missing =
NULL)
recode(Severity,1= "mild",2 =" moderate",3 =" severe",default
= NULL, .missing = NULL)
recode(Type,1= "Dip",2 ="Hemi",3 ="Quadri", default = NULL, .missing =
NULL)
Question 3
a.
#Summary command give the descriptive statistics for the variables
mentioned
summary(hippodata$GMFM.E.Pre,GMFM.E.Post)
## Min. 1st Qu. Median Mean 3rd Qu. Max.
## 0.00 0.00 0.00 21.44 47.90 90.20
summary(hippodata$GMFM.E.Post)
## Min. 1st Qu. Median Mean 3rd Qu. Max.
## 0.00 0.00 8.30 25.24 52.05 93.00
b.
#Create two new variables which categorise the GMFM.The
hippodata$GMFM.E.Pre1 allow creation of GMFM.E.Pre1 variable that
Usingthe desired properties.
hippodata$GMFM.E.Pre1 [hippodata$GMFM.E.Pre<=0]="zero"
hippodata$GMFM.E.Pre1 [hippodata$GMFM.E.Pre>0]="greater than zero"
Paraphrase This Document
Need a fresh take? Get an instant paraphrase of this document with our AI Paraphraser

hippodata$GMFM.E.Post1 [hippodata$GMFM.E.Post>0]="greater than zero"
hippodata$GMFM.E.Post1 [hippodata$GMFM.E.Post<=0]="zero"
c.
#Cross-tabulate these new variables.First,the attach command helps to
call the new generated variables for use.
Table commandhelps to tabulate the variables
attach(hippodata)
## The following objects are masked from hippodata (pos = 3):
##
## Age.Group, ECAB.Post, ECAB.Pre, GMFM.A.Post, GMFM.A.Pre,
## GMFM.B.Post, GMFM.B.Pre, GMFM.C.Post, GMFM.C.Pre, GMFM.D.Post,
## GMFM.D.Pre, GMFM.E.Post, GMFM.E.Pre, GMFM.TOTAL.Post,
## GMFM.TOTAL.Pre, Participant, Previous.Time, Severity, Type
table(GMFM.E.Pre1,GMFM.E.Post1)
## GMFM.E.Post1
## GMFM.E.Pre1 greater than zero zero
## greater than zero 15 0
## zero 2 14
In both variables, many values were found to be greater than zero (15).In both
variables,14 value were zero.
#Assing p to the table and getting the proportions for each
p<-table(GMFM.E.Pre1,GMFM.E.Post1)
prop.table(p)
## GMFM.E.Post1
## GMFM.E.Pre1 greater than zero zero
## greater than zero 0.48387097 0.00000000
## zero 0.06451613 0.45161290
Checking the column proportions, this would be 48% and 45% respectively.
Question 4
a
#Create a new variable which is the difference between each child’s
post-study ECAB score and their pre-study ECAB score.
#creation of ECAB.Pd1
hippodata$ECAB.Pd1<-hippodata$ECAB.Post-hippodata$ECAB.Pre
attach(hippodata) #calls the new variables for analysis

## The following objects are masked from hippodata (pos = 3):
##
## Age.Group, ECAB.Post, ECAB.Pre, GMFM.A.Post, GMFM.A.Pre,
## GMFM.B.Post, GMFM.B.Pre, GMFM.C.Post, GMFM.C.Pre, GMFM.D.Post,
## GMFM.D.Pre, GMFM.E.Post, GMFM.E.Post1, GMFM.E.Pre, GMFM.E.Pre1,
## GMFM.TOTAL.Post, GMFM.TOTAL.Pre, Participant, Previous.Time,
## Severity, Type
## The following objects are masked from hippodata (pos = 4):
##
## Age.Group, ECAB.Post, ECAB.Pre, GMFM.A.Post, GMFM.A.Pre,
## GMFM.B.Post, GMFM.B.Pre, GMFM.C.Post, GMFM.C.Pre, GMFM.D.Post,
## GMFM.D.Pre, GMFM.E.Post, GMFM.E.Pre, GMFM.TOTAL.Post,
## GMFM.TOTAL.Pre, Participant, Previous.Time, Severity, Type
b.
#Create a table of summary statistics (mean, standard deviation,
median, minimum and maximum) for this variable by CP Severity. What do
you conclude?
#using the describeBy command to get summary stats.per group
describeBy(ECAB.Pd1,Severity)
##
## Descriptive statistics by group
## group: mild
## vars n mean sd median trimmed mad min max range skew
kurtosis se
## X1 1 9 8.89 9.13 8 8.89 11.86 0 26.5 26.5 0.58 -
1.06 3.04
## ------------------------------------------------------------
## group: moderate
## vars n mean sd median trimmed mad min max range skew kurtosis
se
## X1 1 7 6.07 2.6 5 6.07 1.48 4 10.5 6.5 0.72 -1.44
0.98
## ------------------------------------------------------------
## group: severe
## vars n mean sd median trimmed mad min max range skew
kurtosis se
## X1 1 15 4.67 4.09 5 4.35 3.71 0 13.5 13.5 0.72 -
0.48 1.06
The difference between each child’s post-study ECAB score and their pre-study ECAB
score was highest in mild severity followed by moderate and severe respectively.
c.
##
## Age.Group, ECAB.Post, ECAB.Pre, GMFM.A.Post, GMFM.A.Pre,
## GMFM.B.Post, GMFM.B.Pre, GMFM.C.Post, GMFM.C.Pre, GMFM.D.Post,
## GMFM.D.Pre, GMFM.E.Post, GMFM.E.Post1, GMFM.E.Pre, GMFM.E.Pre1,
## GMFM.TOTAL.Post, GMFM.TOTAL.Pre, Participant, Previous.Time,
## Severity, Type
## The following objects are masked from hippodata (pos = 4):
##
## Age.Group, ECAB.Post, ECAB.Pre, GMFM.A.Post, GMFM.A.Pre,
## GMFM.B.Post, GMFM.B.Pre, GMFM.C.Post, GMFM.C.Pre, GMFM.D.Post,
## GMFM.D.Pre, GMFM.E.Post, GMFM.E.Pre, GMFM.TOTAL.Post,
## GMFM.TOTAL.Pre, Participant, Previous.Time, Severity, Type
b.
#Create a table of summary statistics (mean, standard deviation,
median, minimum and maximum) for this variable by CP Severity. What do
you conclude?
#using the describeBy command to get summary stats.per group
describeBy(ECAB.Pd1,Severity)
##
## Descriptive statistics by group
## group: mild
## vars n mean sd median trimmed mad min max range skew
kurtosis se
## X1 1 9 8.89 9.13 8 8.89 11.86 0 26.5 26.5 0.58 -
1.06 3.04
## ------------------------------------------------------------
## group: moderate
## vars n mean sd median trimmed mad min max range skew kurtosis
se
## X1 1 7 6.07 2.6 5 6.07 1.48 4 10.5 6.5 0.72 -1.44
0.98
## ------------------------------------------------------------
## group: severe
## vars n mean sd median trimmed mad min max range skew
kurtosis se
## X1 1 15 4.67 4.09 5 4.35 3.71 0 13.5 13.5 0.72 -
0.48 1.06
The difference between each child’s post-study ECAB score and their pre-study ECAB
score was highest in mild severity followed by moderate and severe respectively.
c.
⊘ This is a preview!⊘
Do you want full access?
Subscribe today to unlock all pages.

Trusted by 1+ million students worldwide

#using the describeBy command to get summary stats.per group
describeBy(ECAB.Pd1,Age.Group)
##
## Descriptive statistics by group
## group: 4 to 7
## vars n mean sd median trimmed mad min max range skew kurtosis
se
## X1 1 17 4.62 4 4 4.37 2.22 0 13 13 0.72 -0.49
0.97
## ------------------------------------------------------------
## group: 8 to 12
## vars n mean sd median trimmed mad min max range skew
kurtosis se
## X1 1 14 8.14 7.29 7 7.29 6.3 0 26.5 26.5 1.03
0.39 1.95
The difference between each child’s post-study ECAB score and their pre-study ECAB
score was highest in 8 to 12 years age group(M=8.14)
Question 5
a.
#using the describeBy command to get summary stats.per group
describeBy(GMFM.TOTAL.Pre,Previous.Time)
##
## Descriptive statistics by group
## group: >6m
## vars n mean sd median trimmed mad min max range skew
kurtosis se
## X1 1 11 32.57 27.35 27.3 30.37 25.35 4.4 80.6 76.2 0.63
-1.34 8.24
## ------------------------------------------------------------
## group: 3-6m
## vars n mean sd median trimmed mad min max range skew
kurtosis se
## X1 1 20 48.69 30.52 46.1 48.96 39.51 1.88 93.8 91.92 -0.07
-1.46 6.82
The analysis show that children with more previous time in ‘hippotherapy’ were
found to have a lesser pre-study GMFM Total score on average (M=32.57)than
children with less previous time in ‘hippotherapy’(M=48.69)
B
#Cross tab between the two variables
Paraphrase This Document
Need a fresh take? Get an instant paraphrase of this document with our AI Paraphraser

table(Type,Previous.Time)
## Previous.Time
## Type >6m 3-6m
## Dip 1 12
## Hemi 2 3
## Quadri 8 5
#J assigns the cross tab table and the prop.table gets proportions
j<-table(Type,Previous.Time)
prop.table(j)
## Previous.Time
## Type >6m 3-6m
## Dip 0.03225806 0.38709677
## Hemi 0.06451613 0.09677419
## Quadri 0.25806452 0.16129032
Yes. The Quadri (quadriplegia)were found to be more likely to have had more
than 6 months’ previous hippotherapy.compared to the rest.Also,the Dip
(diplegia) were found to be more likely to have had more 3 to 6 months’
previous hippotherapy than the rest
## Previous.Time
## Type >6m 3-6m
## Dip 1 12
## Hemi 2 3
## Quadri 8 5
#J assigns the cross tab table and the prop.table gets proportions
j<-table(Type,Previous.Time)
prop.table(j)
## Previous.Time
## Type >6m 3-6m
## Dip 0.03225806 0.38709677
## Hemi 0.06451613 0.09677419
## Quadri 0.25806452 0.16129032
Yes. The Quadri (quadriplegia)were found to be more likely to have had more
than 6 months’ previous hippotherapy.compared to the rest.Also,the Dip
(diplegia) were found to be more likely to have had more 3 to 6 months’
previous hippotherapy than the rest
1 out of 5

Your All-in-One AI-Powered Toolkit for Academic Success.
+13062052269
info@desklib.com
Available 24*7 on WhatsApp / Email
Unlock your academic potential
© 2024 | Zucol Services PVT LTD | All rights reserved.