Supply Chain Analytics Report: Analysis of Complaints and Solutions
VerifiedAdded on 2022/09/27
|11
|2612
|21
Report
AI Summary
This report, focusing on supply chain analytics, analyzes data from an electronic company's ERP system to identify and address key issues. The report begins by calculating optimal order quantities to minimize inventory costs. It then delves into complaint analysis, categorizing issues by type (delivery, wrong quantity, lost in transit), product family, customer, and CSR staff, providing detailed counts and highlighting the most problematic areas. The analysis further explores the root causes of these complaints, attributing them to poor information flow and inadequate inventory management. The report concludes by proposing solutions centered on improved warehouse management, including demand prediction, warehouse layout optimization, and quality control, supported by relevant research and best practices in supply chain management.
Supply Chain Analytics 1
Supply Chain Analytics
Student Name
Professor Name
Course Name
Date
Supply Chain Analytics
Student Name
Professor Name
Course Name
Date
Paraphrase This Document
Need a fresh take? Get an instant paraphrase of this document with our AI Paraphraser
Supply Chain Analytics 2
Table of Contents
Introduction....................................................................................................................................3
Task 2..............................................................................................................................................3
Task 3..............................................................................................................................................3
Complaint analysis.....................................................................................................................3
By complaint type.....................................................................................................................3
By product family.....................................................................................................................3
By customer..............................................................................................................................4
By CRS staff..............................................................................................................................4
Root causes..................................................................................................................................5
Task 4: Solution to problem..........................................................................................................6
Conclusion......................................................................................................................................8
References.......................................................................................................................................9
Supply Chain Analytics 3
Introduction
The report consists of three sections. The first section entails a calculation designed to
determine an order size that will minimize the inventory costs. The second section involves
analyses of the three top complaints by the complaint type, product family, customer, and CSR
staff. The part will also hypothesize the root causes of such claims. The last section gives the
recommended solutions for the problems.
Task 2
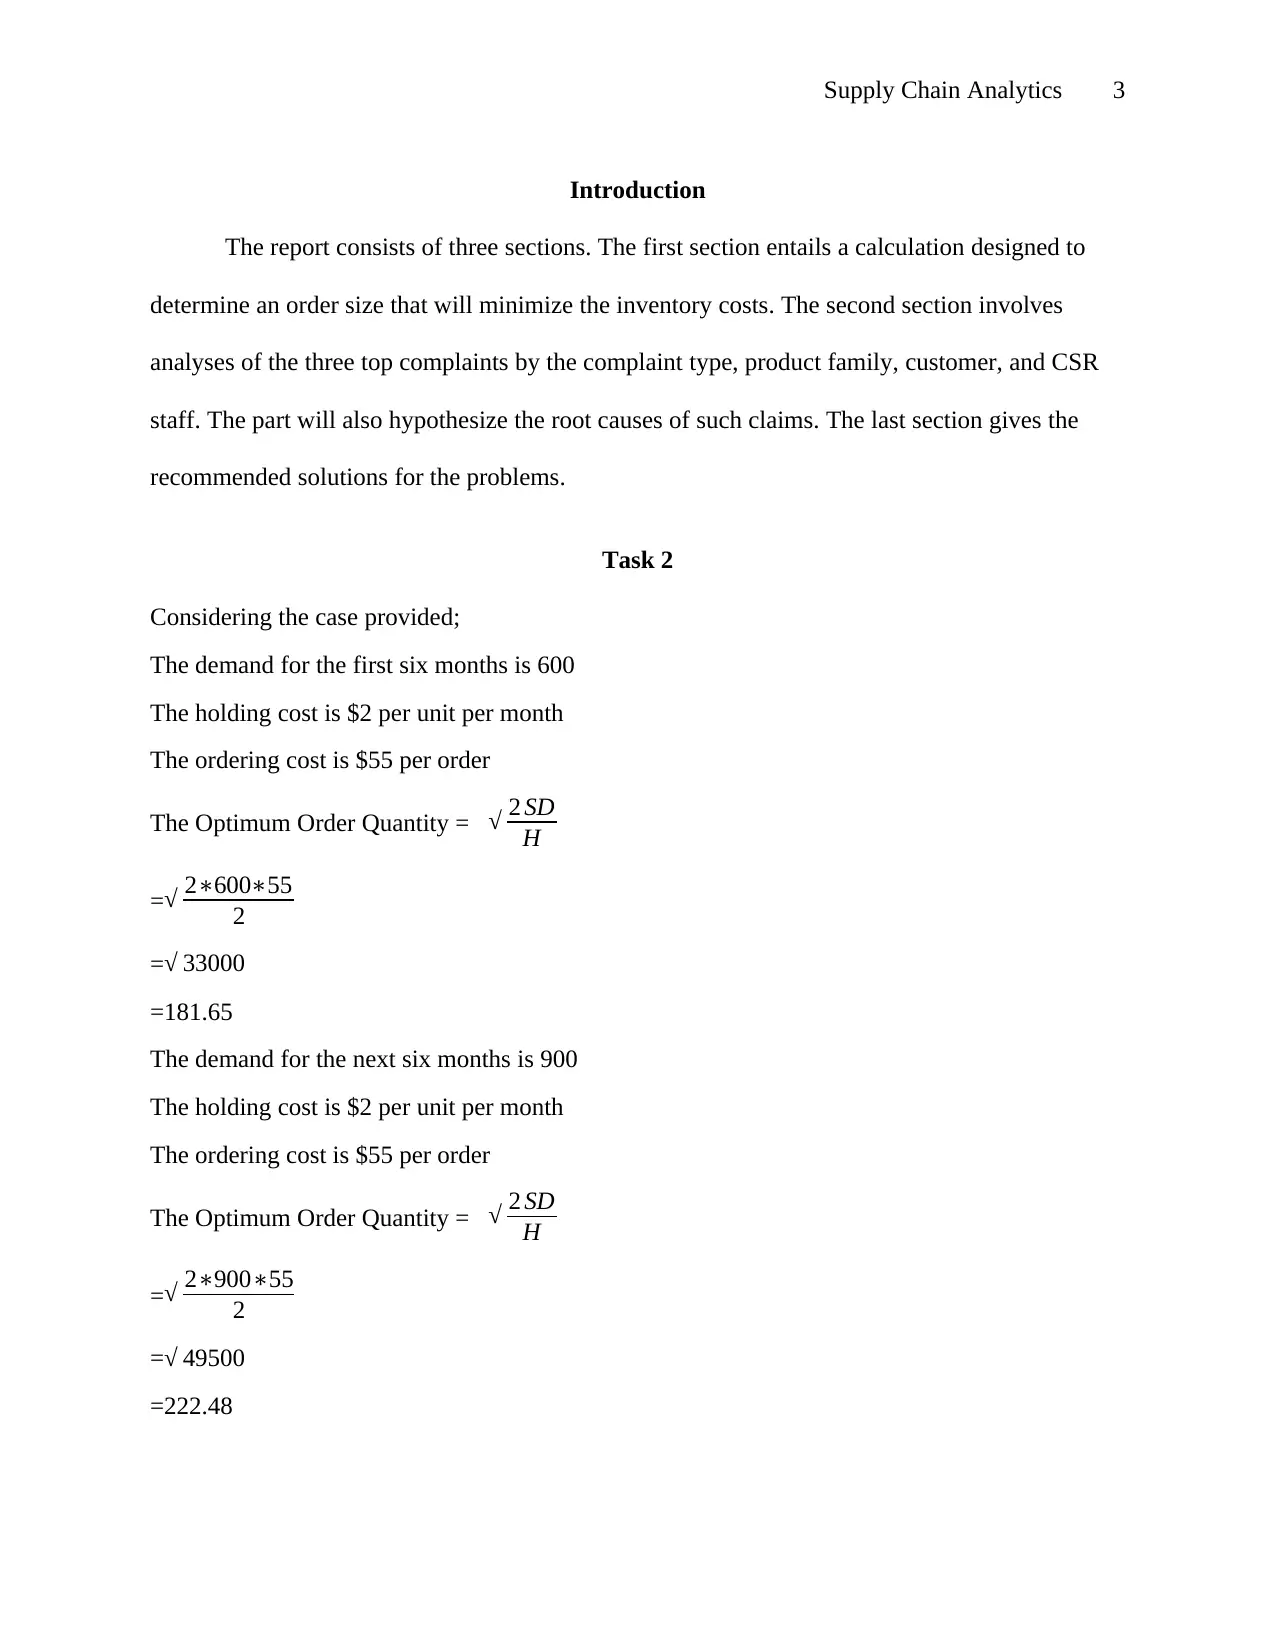
Considering the case provided;
The demand for the first six months is 600
The holding cost is $2 per unit per month
The ordering cost is $55 per order
The Optimum Order Quantity = √ 2 SD
H
=√ 2∗600∗55
2
=√ 33000
=181.65
The demand for the next six months is 900
The holding cost is $2 per unit per month
The ordering cost is $55 per order
The Optimum Order Quantity = √ 2 SD
H
=√ 2∗900∗55
2
=√ 49500
=222.48
Introduction
The report consists of three sections. The first section entails a calculation designed to
determine an order size that will minimize the inventory costs. The second section involves
analyses of the three top complaints by the complaint type, product family, customer, and CSR
staff. The part will also hypothesize the root causes of such claims. The last section gives the
recommended solutions for the problems.
Task 2
Considering the case provided;
The demand for the first six months is 600
The holding cost is $2 per unit per month
The ordering cost is $55 per order
The Optimum Order Quantity = √ 2 SD
H
=√ 2∗600∗55
2
=√ 33000
=181.65
The demand for the next six months is 900
The holding cost is $2 per unit per month
The ordering cost is $55 per order
The Optimum Order Quantity = √ 2 SD
H
=√ 2∗900∗55
2
=√ 49500
=222.48
⊘ This is a preview!⊘
Do you want full access?
Subscribe today to unlock all pages.
Trusted by 1+ million students worldwide
Supply Chain Analytics 4
Task 3
Complaint analysis
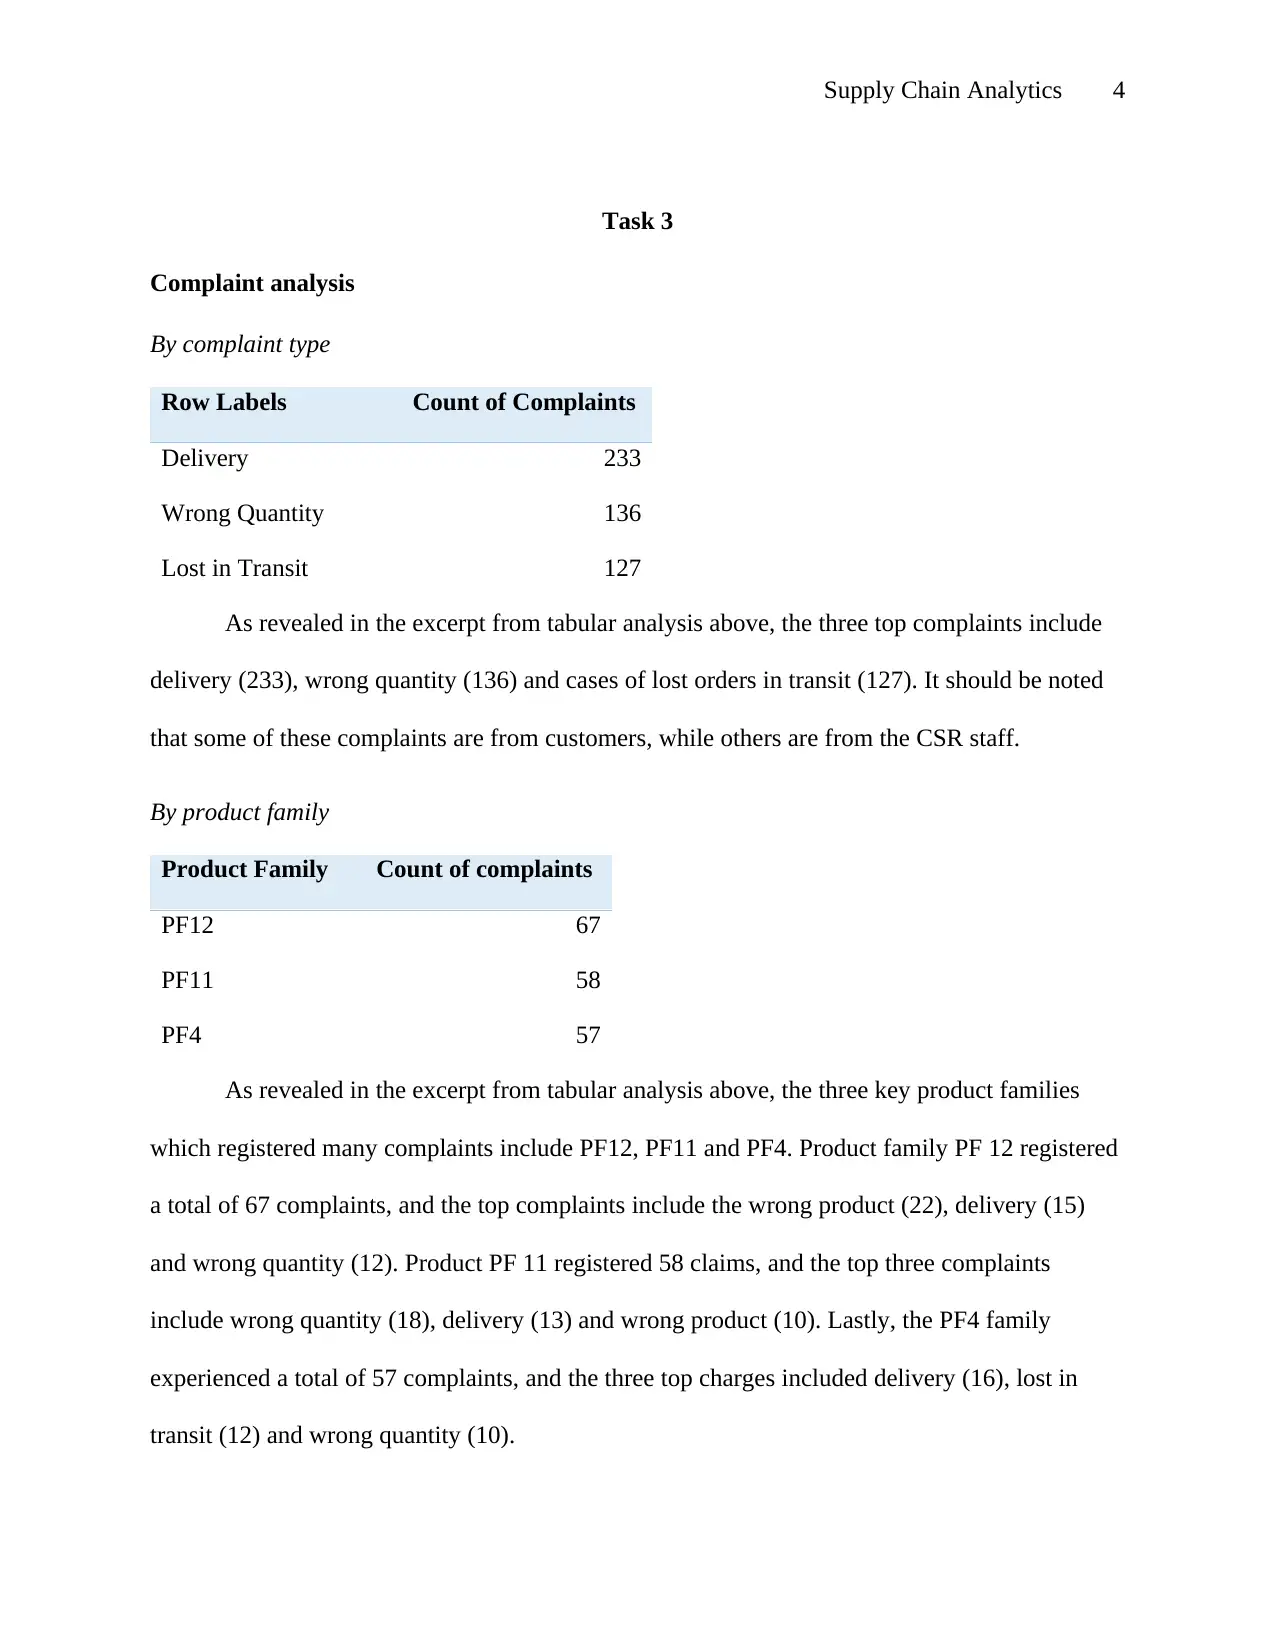
By complaint type
Row Labels Count of Complaints
Delivery 233
Wrong Quantity 136
Lost in Transit 127
As revealed in the excerpt from tabular analysis above, the three top complaints include
delivery (233), wrong quantity (136) and cases of lost orders in transit (127). It should be noted
that some of these complaints are from customers, while others are from the CSR staff.
By product family
Product Family Count of complaints
PF12 67
PF11 58
PF4 57
As revealed in the excerpt from tabular analysis above, the three key product families
which registered many complaints include PF12, PF11 and PF4. Product family PF 12 registered
a total of 67 complaints, and the top complaints include the wrong product (22), delivery (15)
and wrong quantity (12). Product PF 11 registered 58 claims, and the top three complaints
include wrong quantity (18), delivery (13) and wrong product (10). Lastly, the PF4 family
experienced a total of 57 complaints, and the three top charges included delivery (16), lost in
transit (12) and wrong quantity (10).
Task 3
Complaint analysis
By complaint type
Row Labels Count of Complaints
Delivery 233
Wrong Quantity 136
Lost in Transit 127
As revealed in the excerpt from tabular analysis above, the three top complaints include
delivery (233), wrong quantity (136) and cases of lost orders in transit (127). It should be noted
that some of these complaints are from customers, while others are from the CSR staff.
By product family
Product Family Count of complaints
PF12 67
PF11 58
PF4 57
As revealed in the excerpt from tabular analysis above, the three key product families
which registered many complaints include PF12, PF11 and PF4. Product family PF 12 registered
a total of 67 complaints, and the top complaints include the wrong product (22), delivery (15)
and wrong quantity (12). Product PF 11 registered 58 claims, and the top three complaints
include wrong quantity (18), delivery (13) and wrong product (10). Lastly, the PF4 family
experienced a total of 57 complaints, and the three top charges included delivery (16), lost in
transit (12) and wrong quantity (10).
Paraphrase This Document
Need a fresh take? Get an instant paraphrase of this document with our AI Paraphraser
Supply Chain Analytics 5
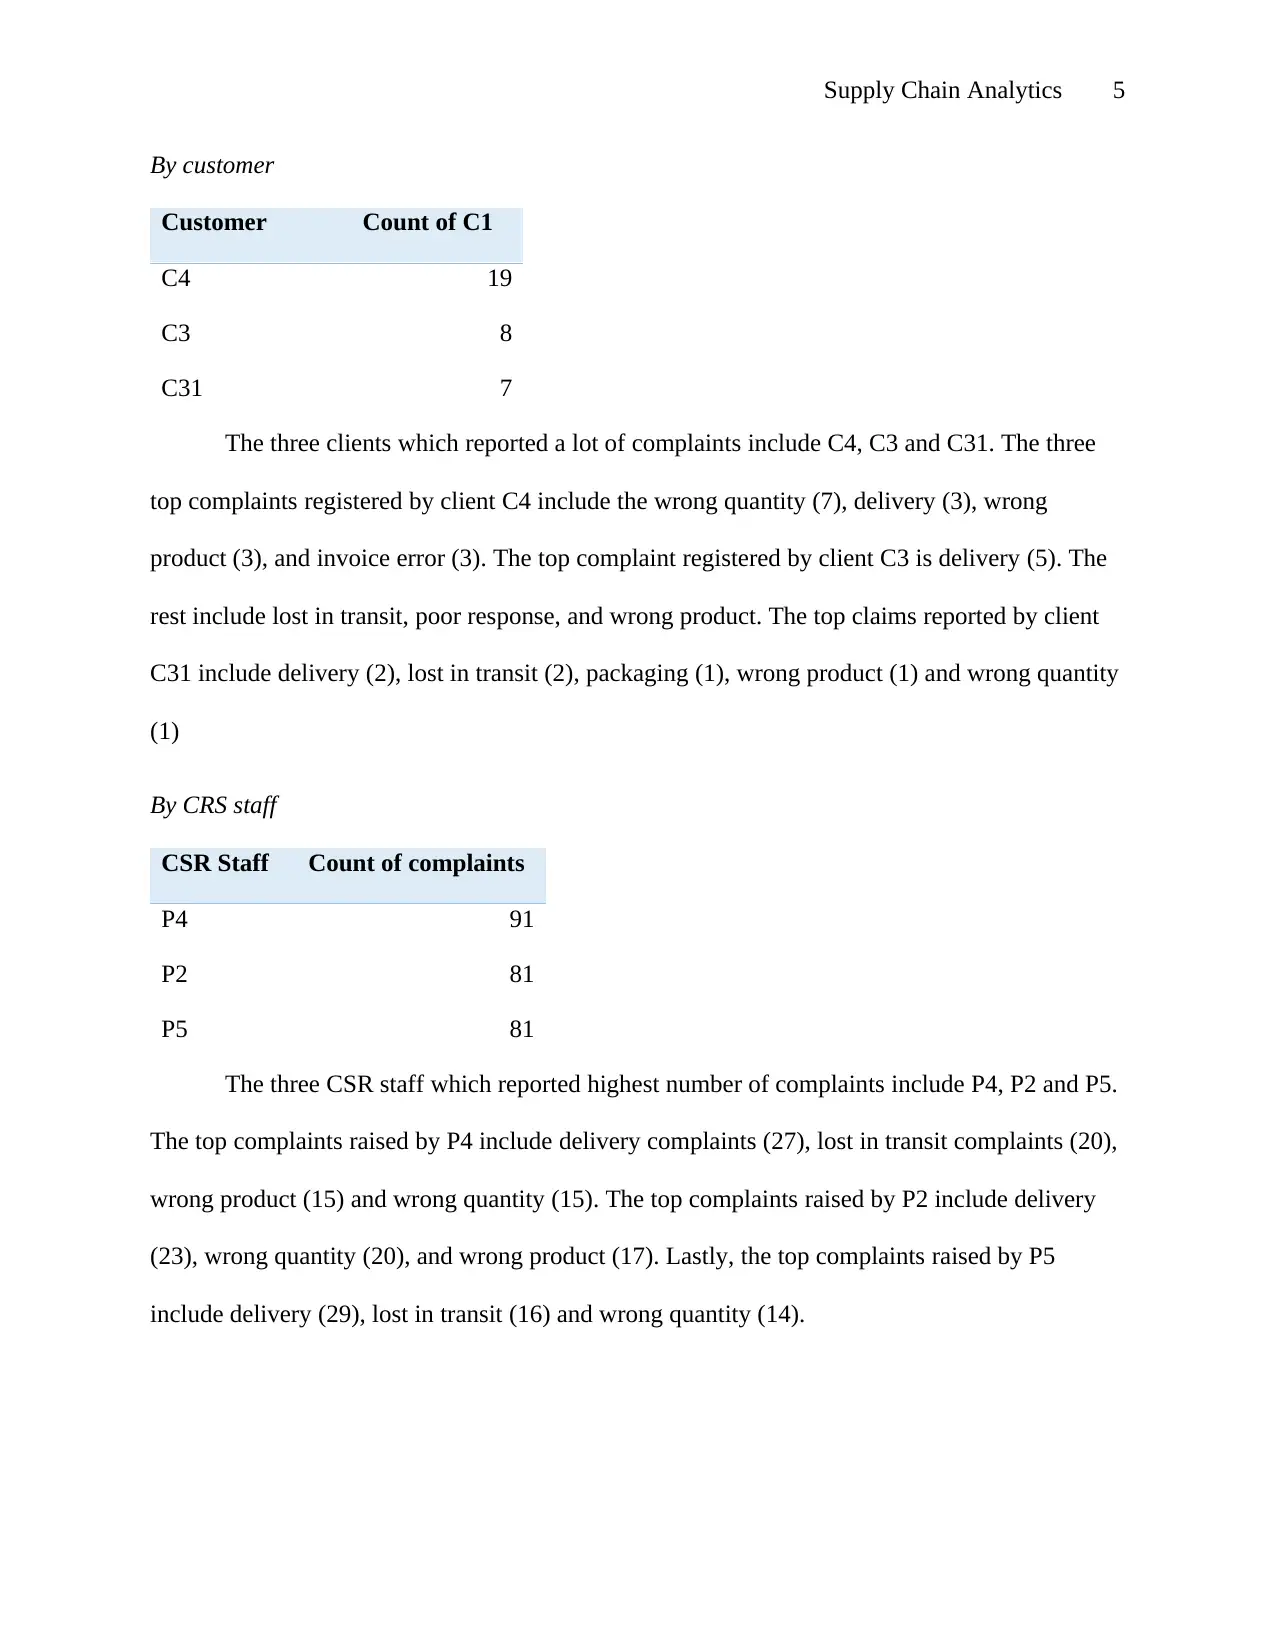
By customer
Customer Count of C1
C4 19
C3 8
C31 7
The three clients which reported a lot of complaints include C4, C3 and C31. The three
top complaints registered by client C4 include the wrong quantity (7), delivery (3), wrong
product (3), and invoice error (3). The top complaint registered by client C3 is delivery (5). The
rest include lost in transit, poor response, and wrong product. The top claims reported by client
C31 include delivery (2), lost in transit (2), packaging (1), wrong product (1) and wrong quantity
(1)
By CRS staff
CSR Staff Count of complaints
P4 91
P2 81
P5 81
The three CSR staff which reported highest number of complaints include P4, P2 and P5.
The top complaints raised by P4 include delivery complaints (27), lost in transit complaints (20),
wrong product (15) and wrong quantity (15). The top complaints raised by P2 include delivery
(23), wrong quantity (20), and wrong product (17). Lastly, the top complaints raised by P5
include delivery (29), lost in transit (16) and wrong quantity (14).
Supply Chain Analytics 6
Root causes
There are a number of possible causes of such complaints. First, there could be poor
information flow among the suppliers, customers, and the company. The only information that
flows between the client-suppliers is the specific needs and purchase orders issued from the
purchasing area. There is inadequate information system that supports the flow of information
and simultaneity between sales and product needs at points of sale (Stopka and L’upták, 2018).
Delivery and wrong quantity is attributable to poor inventory management. Anyone who works
in logistics runs a cold sweat from behind when they hear the expression 'stock break'. Managing
inventories is an art, which once again becomes exponentially more complex as the supply chain
increases. As they are getting longer, the amount of stock that companies have to manage
increases. It is the responsibility of warehouse managers to know how much inventory needed in
each place and at every moment. Also, they should correctly forecast the demand and establish
safety margins for the stock. Lastly, the warehouse managers ought to keep track of the
inventory in real-time.
Task 4: Solution to the problem
The fundamental solution to the complaints registered lies in proper warehouse
management. Optimizing warehouse management is entirely part of a company's growth strategy
and directly contributes to improving productivity. A first aspect to consider to improve the
management of warehouses and inventories is that of predicting effective and reliable demands.
It is important to note that the sales budget is the starting point of the entire customer service
process. It compromises not only the results of the commercial area but also those of production,
logistics, and finance, among others (Bhardwaj and Prakash, 2016). After studying the behavior
of the demand, the characteristics of the products should be analyzed to determine the level of
⊘ This is a preview!⊘
Do you want full access?
Subscribe today to unlock all pages.
Trusted by 1+ million students worldwide
Supply Chain Analytics 7
stock that will be required, and that will be necessary to have available. Both aspects are decisive
to establish the most suitable techniques for the design and organization of the warehouse;
otherwise, the warehouse will continue to be discussed between excesses and missing
inventories. One way of ensuring that the demand prediction is appropriate is by adopting
innovative technologies. According to Choudhary et al (2018), innovative technologies forms the
basis for modern supply chain management.
To improve the productivity of the warehouse, the administration must take full
advantage of the resources it has and among these its facilities. To do this, the administrator must
calculate the storage capacity required. This is achieved by estimating the rotation that the
products will have, which will depend on the greater or lesser flexibility of the supply process
and the production process. In the first process, reliable suppliers will be required and willing to
collaborate in the delivery of the orders that will be adjusted according to the real demand. In the
second, to apply for example flexible production systems with the production of small batches,
with which will achieve a reduction in the coverage index of the products and therefore a greater
rotation of them. Flexibility, according to Pourjavad & Mayorga (2018) is very crucial in fuzzy
context like the one facing DC. In addition, the administrator should ensure that the warehouse
layout is appropriate. The administrator should locate high turnover items at the end of the
supply chain. According to the Pareto principle, those items that move fast should be located
near the entry. Doing this will reduce shipping time and increase customer satisfaction.
The physical storage units measure the capacity of a warehouse it can accommodate. The
physical storage unit can be a product or a set of products gathered in a single package such as
boxes of ten units etc. The next step is to determine the number of boxes, packages, pallets,
containers that will be needed to store the products (Luo, Chen, and Chen, 2015). It should be
Paraphrase This Document
Need a fresh take? Get an instant paraphrase of this document with our AI Paraphraser
Supply Chain Analytics 8
taken into account that the calculation of the required storage capacity must not exceed 90% of
the available size of the storage area. The administrator should plan the appropriate processes in
case of out of stock. Out of stock, especially in the case of high turnover products, can have a
severe impact on delivery (Muter and Öncan, 2015). One solution to this is to create a minimum
inventory level below which an alert is sent to the Purchasing department to speed up
replenishment.
For the warehouse to achieve a fast, timely, and reliable service, that is, competitive, the
administration must have an adequate location of the products in the warehouse. A technique
known and used to determine the location of products in the warehouse is to apply the ABC
classification criteria by movement (Wang, Xu and Zhu, 2018). At this point, it is necessary to
specify that many stores use the product turnover rate for this classification. Such an approach
can lead to an error since a product with a lot of commands can have a low turnover rate or vice
versa (Zupan, Debevec, and Herakovic 2017). Rotation is an indicator of the average number of
times a product is renewed in the warehouse (Accorsi et al. 2017). In order to facilitate rotation,
ABC classification is recommended to consider the picking frequency (number of times a
product is dispatched in a period of time). As a result, it is possible to obtain three groups. The
first group is products with a high movement index (A). The second category is products with a
medium movement index (B). The last group is products with a slow or low movement index
(C). Such classification can be used to locate products in the store.
Lastly, the administration should guarantee effective and impeccable quality control. The
goal is to improve the productivity of your supply chain without increasing the amount of
product preparation and shipping errors. Strict and effective quality control must be carried out at
each stage of the supply chain. Above all, it guarantees the content and destination of parcels.
Supply Chain Analytics 9
The management should also ensure that such there is good compliance to the established model
(Berry & Ramirez, 2019)
Conclusion
It is apparent from the analysis that the root causes of the complaints are internal. They
are mainly related to warehouse management. Indeed, a warehouse should be considered as a
profit center where a series of related processes are developed. It covers activities ranging from
planning, reception, storage, completion of certain production processes, product delivery, and
control. In a warehouse, in addition to inventories, investments are made in facilities, human
resources, technology, and those used to carry out maintenance and handling of materials in the
most effective way possible. It is in this context that in order to properly manage the stores, the
treatment and use of the information, which guides the flow and storage of the materials, is vital.
Therefore, the administration must evaluate the alternative of automating its operations with
technological systems and solutions or outsource them. The administrator should also continually
seek to improve productivity and achieve a fast, timely, flexible and reliable service, that is,
competitive.
⊘ This is a preview!⊘
Do you want full access?
Subscribe today to unlock all pages.
Trusted by 1+ million students worldwide
Supply Chain Analytics 10
References
Accorsi, R, Bortolini, M, Gamberi, M, Manzini, R & Pilati, F 2017, ‘Multi-objective warehouse
building design to optimize the cycle time, total cost, and carbon footprint’, International
Journal of Advanced Manufacturing Technology, vol. 92, no. 1–4, pp. 839–854, viewed 19
August 2019, <http://search.ebscohost.com/login.aspx?
direct=true&db=a9h&AN=124620546&site=ehost-live>
Berry, D & Ramirez, F 2019, ‘Good compliance is good logistics’, ISE: Industrial & Systems
Engineering at Work, vol. 51, no. 5, pp. 35–39, viewed 21 August 2019,
<http://search.ebscohost.com/login.aspx?direct=true&db=aph&AN=135905654&site=ehost-
live>.
Bhardwaj, H & Prakash, N 2016, ‘Eliciting and structuring business indicators in data warehouse
requirements engineering’, Expert Systems, vol. 33, no. 4, pp. 405–413, viewed 19 August 2019,
<http://search.ebscohost.com/login.aspx?direct=true&db=a9h&AN=118170781&site=ehost-
live>.
Choudhary, S, Nayak, SK, Malik, A & Singh, DK 2018, ‘Important Issues in Supply Chain
Management and Development’, International Journal of Recent Research Aspects, vol. 5, no. 1,
pp. 45–54, viewed 21 August 2019, <http://search.ebscohost.com/login.aspx?
direct=true&db=aph&AN=129311330&site=ehost-live>.
Luo, Y, Chen, ZY & Chen, CX 2015, ‘Robust optimization in warehouse space allocation of
pledges in supply chain financing’, Advances in Transportation Studies, pp. 99–110, viewed 19
August 2019, <http://search.ebscohost.com/login.aspx?
direct=true&db=a9h&AN=114060223&site=ehost-live>.
Muter, İ & Öncan, T 2015, ‘An exact solution approach for the order batching problem’, IIE
Transactions, vol. 47, no. 7, pp. 728–738, viewed 19 August 2019,
<http://search.ebscohost.com/login.aspx?direct=true&db=a9h&AN=102274330&site=ehost-
live>.
Pourjavad, E & Mayorga, RV 2018, ‘A fuzzy rule-based approach to prioritize third-party
reverse logistics based on sustainable development pillars’, Journal of Intelligent & Fuzzy
Systems, vol. 35, no. 3, pp. 3125–3138, viewed 21 August 2019,
<http://search.ebscohost.com/login.aspx?direct=true&db=aph&AN=132098591&site=ehost-
live>.
Stopka, O & L’upták, V 2018, ‘Optimization of Warehouse Management in the Specific
Assembly and Distribution Company: a Case Study’, Nase More, vol. 64, pp. 266–269, viewed
19 August 2019, <http://search.ebscohost.com/login.aspx?
direct=true&db=a9h&AN=132917321&site=ehost-live>.
Paraphrase This Document
Need a fresh take? Get an instant paraphrase of this document with our AI Paraphraser
Supply Chain Analytics 11
Wang, L, Xu, T & Zhu, S 2018, ‘Supply Chain Decision-Making Based on Warehouse Receipt
Pledge and Risk Consideration under Twice Ordering Mode’, Mathematical Problems in
Engineering, pp. 1–15, viewed 19 August 2019, <http://search.ebscohost.com/login.aspx?
direct=true&db=a9h&AN=131000066&site=ehost-live>.
Zupan, H, Debevec, M & Herakovic, N 2017, ‘Inventories in the Warehouse - Monitoring,
Analyses and Optimization with Simulation’, Acta Technica Corvininesis - Bulletin of
Engineering, vol. 10, no. 2, pp. 73–77, viewed 19 August 2019,
<http://search.ebscohost.com/login.aspx?direct=true&db=a9h&AN=122599966&site=ehost-
live>.
1 out of 11
Related Documents


Your All-in-One AI-Powered Toolkit for Academic Success.
+13062052269
info@desklib.com
Available 24*7 on WhatsApp / Email
![[object Object]](/_next/static/media/star-bottom.7253800d.svg)
Unlock your academic potential
Copyright © 2020–2026 A2Z Services. All Rights Reserved. Developed and managed by ZUCOL.