Statistics Assignment - Data Analysis and Statistical Interpretation
VerifiedAdded on 2020/02/24
|14
|1812
|156
Homework Assignment
AI Summary
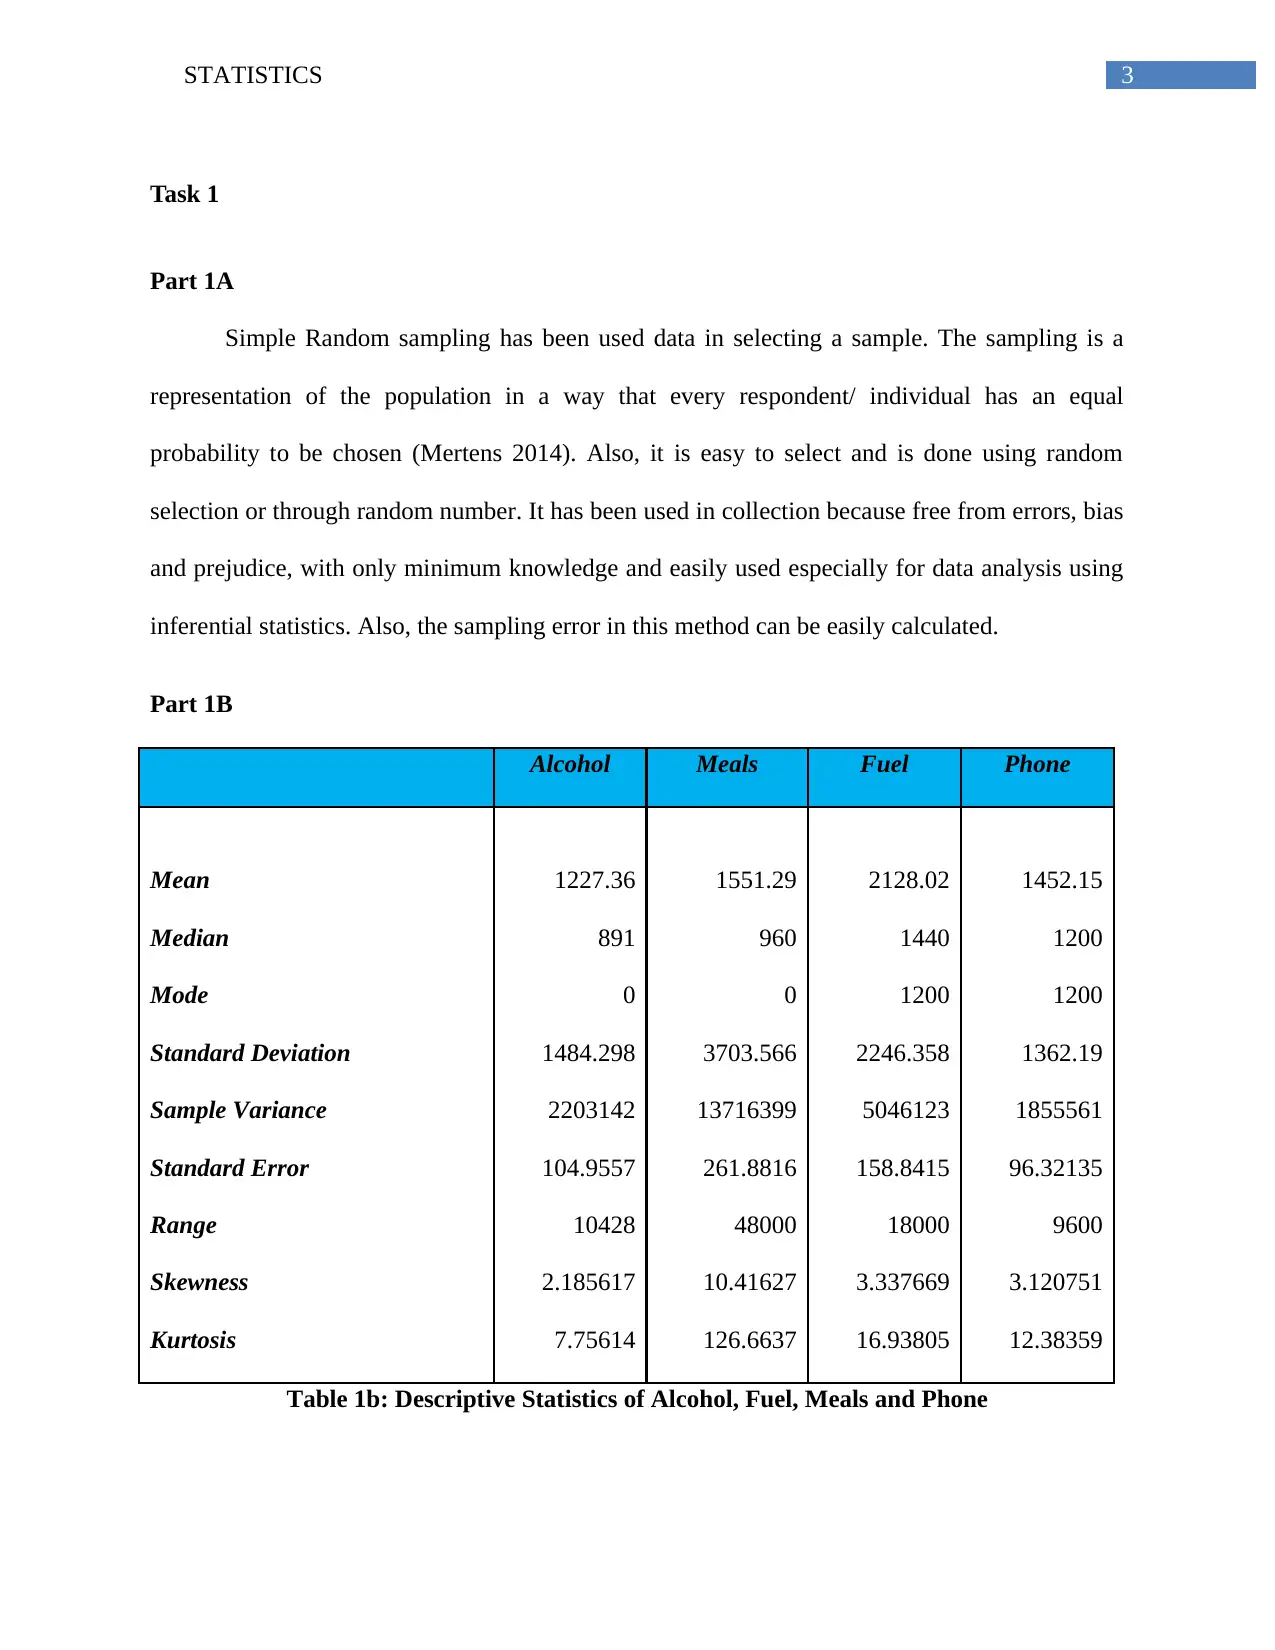
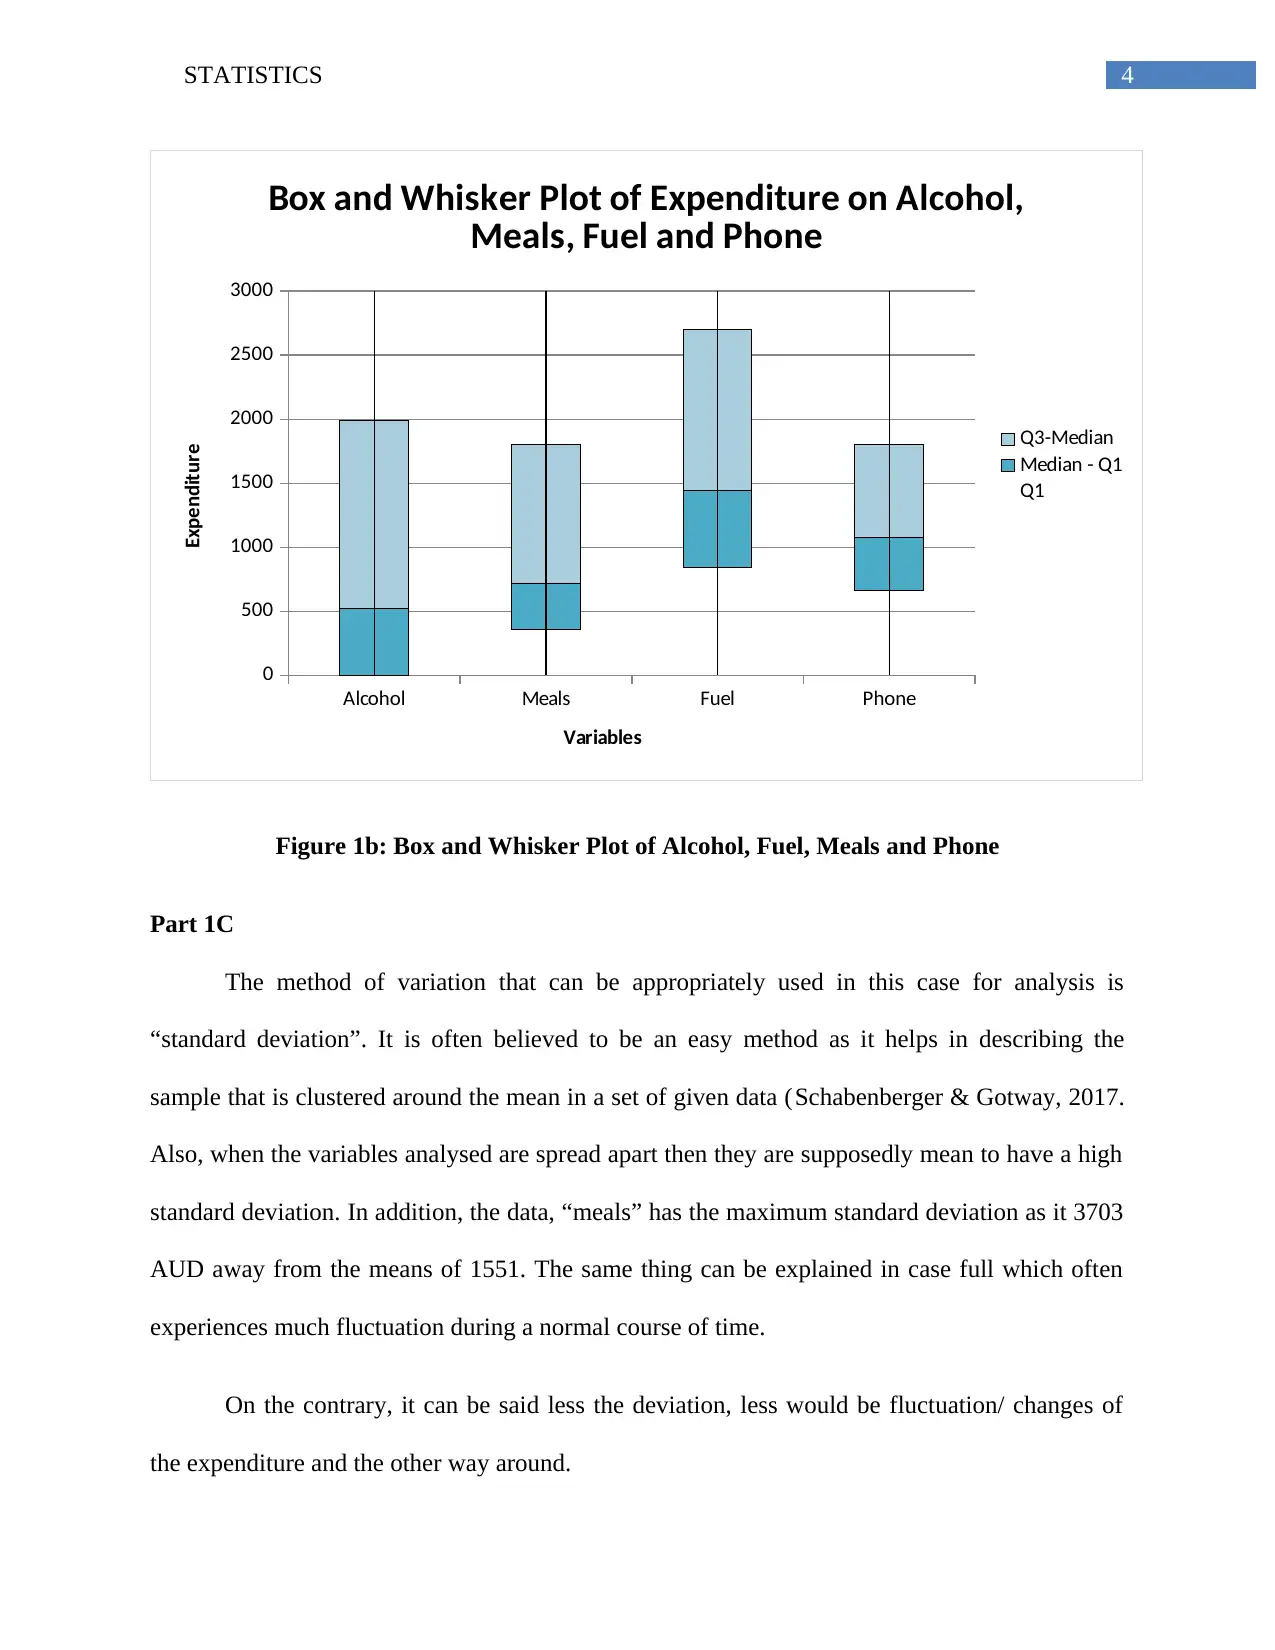
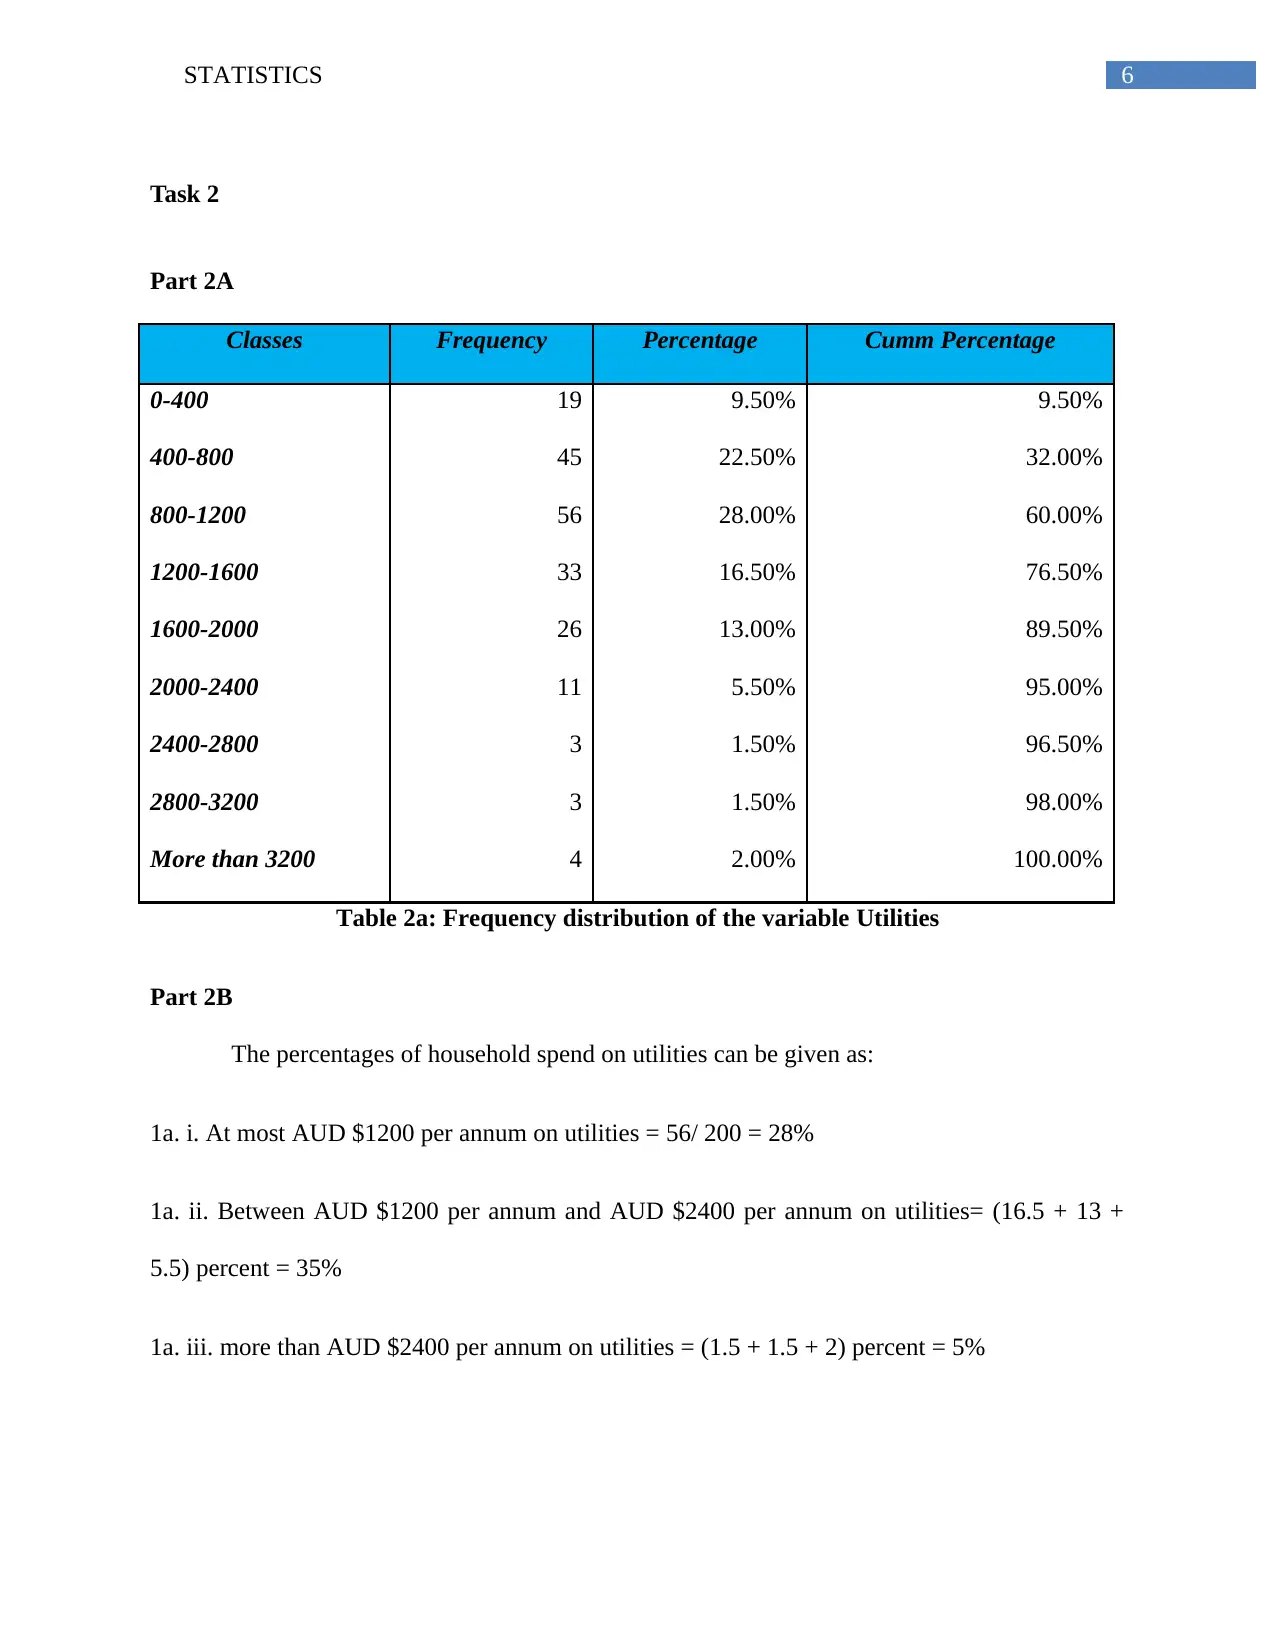
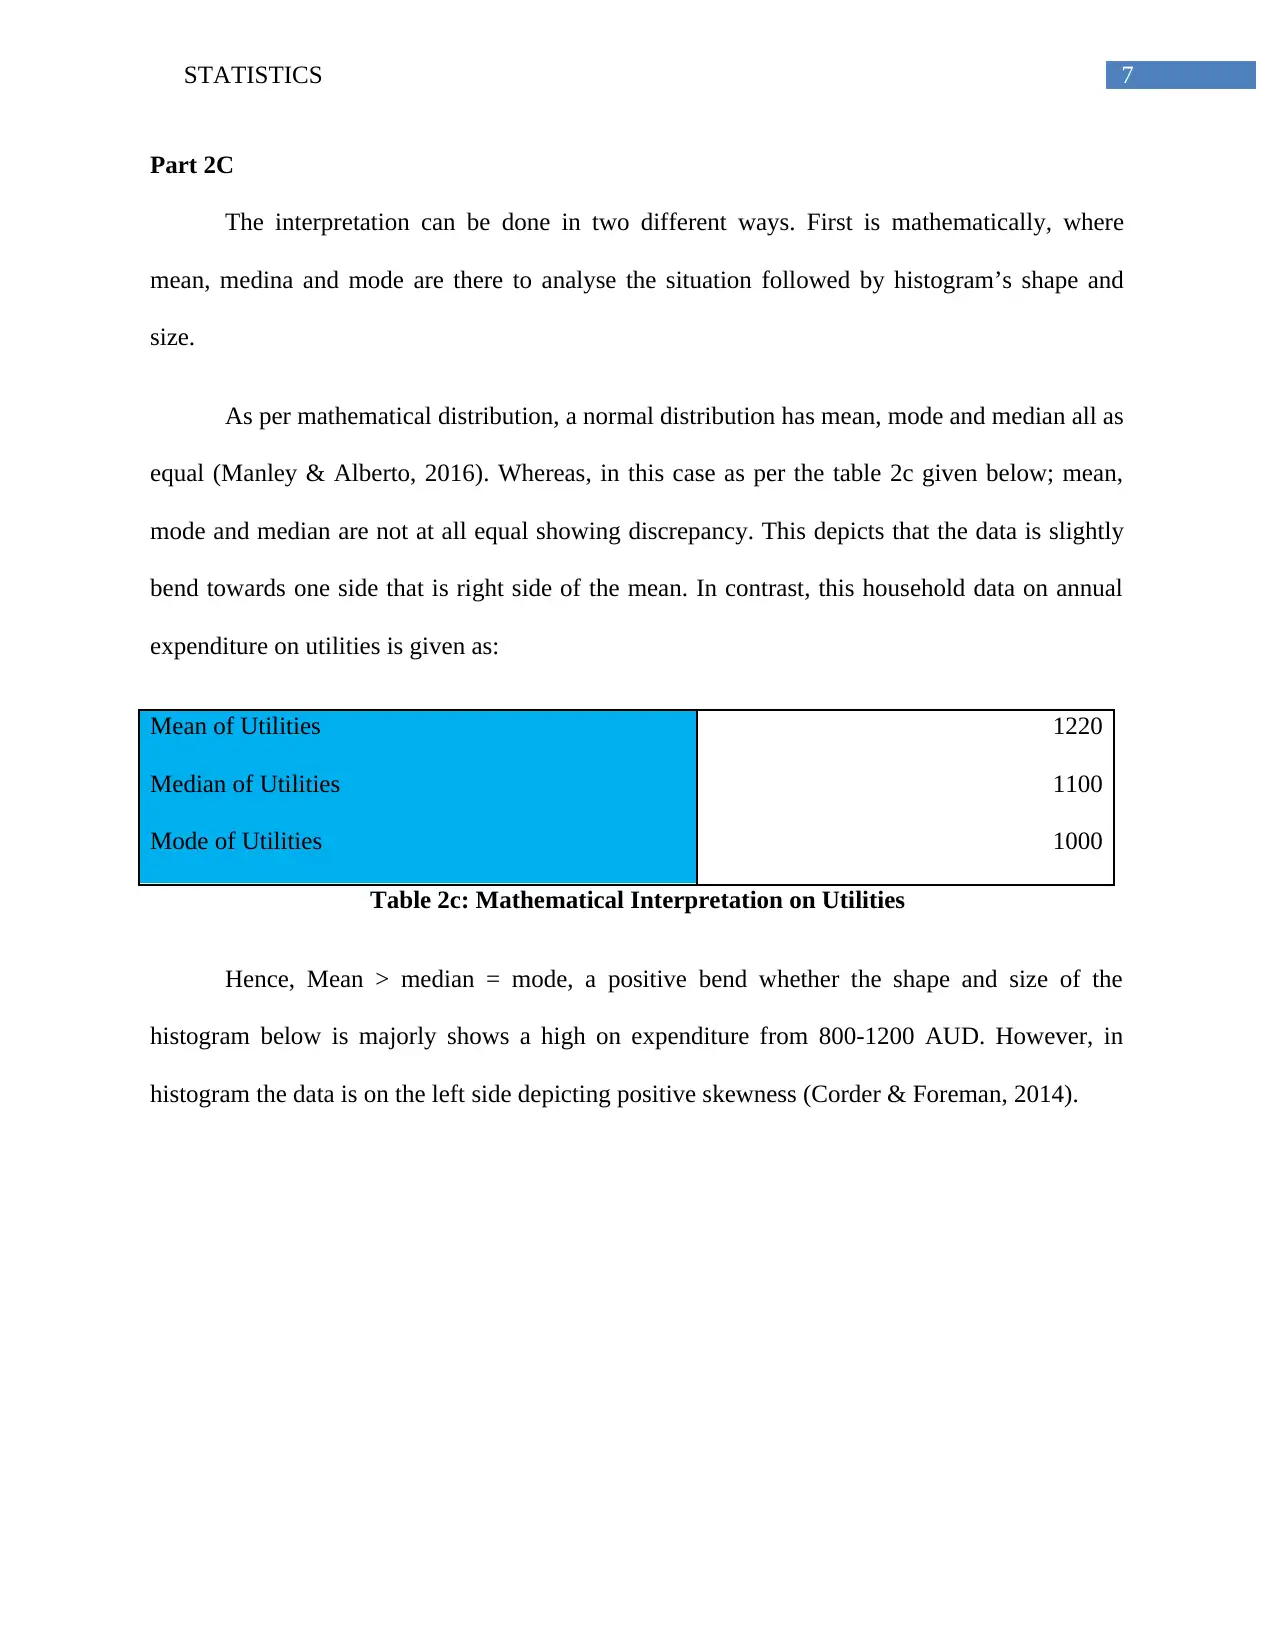
This statistics assignment analyzes data using various statistical methods. It begins with an overview of simple random sampling and descriptive statistics, including measures of central tendency and dispersion for different variables like alcohol, meals, fuel, and phone expenditures. The assignment then explores frequency distributions, percentages, and interpretations of household spending on utilities, followed by an analysis of percentiles, the 'ownhouse' variable, and family size. Scatter plots are used to examine the relationship between after-tax income and annual expenditure. Finally, the assignment includes a contingency table analysis to determine the probabilities and independence of gender and level of education. The document provides detailed calculations, interpretations, and graphical representations to support the statistical analysis.
1 out of 14
Related Documents


Your All-in-One AI-Powered Toolkit for Academic Success.
+13062052269
info@desklib.com
Available 24*7 on WhatsApp / Email
![[object Object]](/_next/static/media/star-bottom.7253800d.svg)
Copyright © 2020–2026 A2Z Services. All Rights Reserved. Developed and managed by ZUCOL.