HI6026 | Audit and Assurance
Added on 2020-03-04
11 Pages2655 Words53 Views
Running head: AUDIT AND ASSURANCE Audit and Assurance Name of Student:Name of University:Author’s Note:
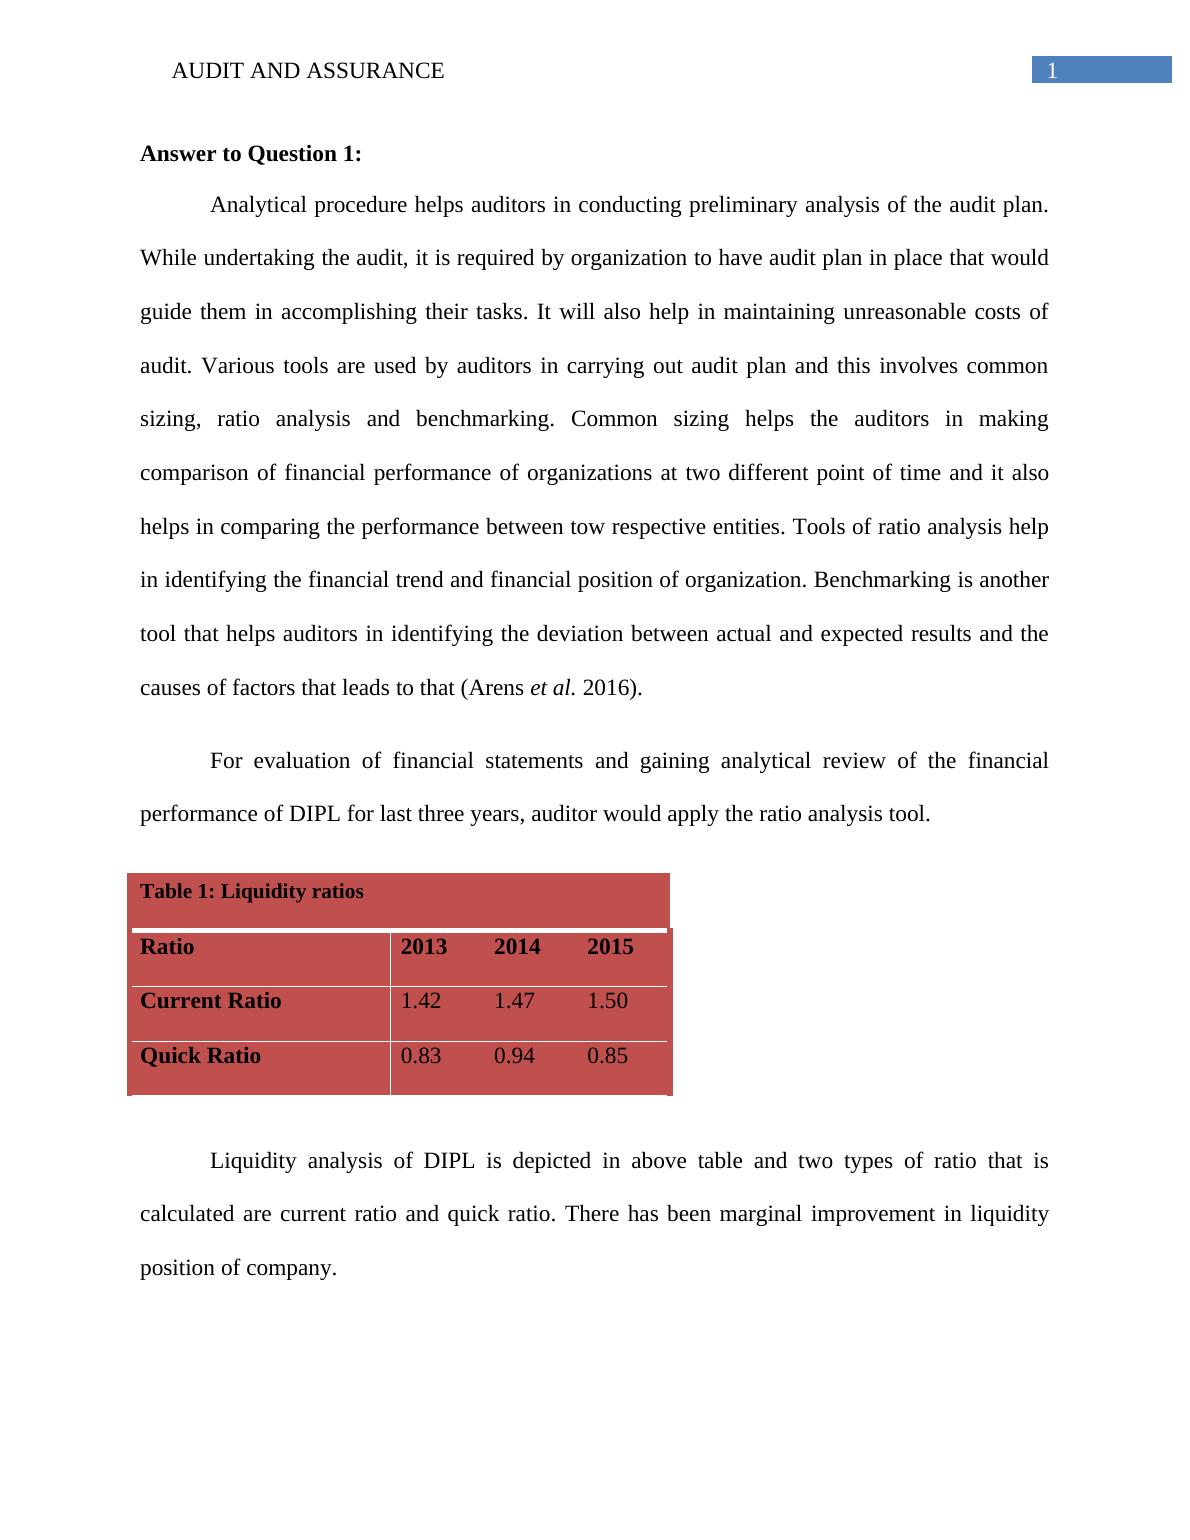
1AUDIT AND ASSURANCEAnswer to Question 1:Analytical procedure helps auditors in conducting preliminary analysis of the audit plan.While undertaking the audit, it is required by organization to have audit plan in place that wouldguide them in accomplishing their tasks. It will also help in maintaining unreasonable costs ofaudit. Various tools are used by auditors in carrying out audit plan and this involves commonsizing, ratio analysis and benchmarking. Common sizing helps the auditors in makingcomparison of financial performance of organizations at two different point of time and it alsohelps in comparing the performance between tow respective entities. Tools of ratio analysis helpin identifying the financial trend and financial position of organization. Benchmarking is anothertool that helps auditors in identifying the deviation between actual and expected results and thecauses of factors that leads to that (Arens et al. 2016).For evaluation of financial statements and gaining analytical review of the financialperformance of DIPL for last three years, auditor would apply the ratio analysis tool.Table 1: Liquidity ratiosRatio201320142015Current Ratio1.421.471.50Quick Ratio 0.830.940.85Liquidity analysis of DIPL is depicted in above table and two types of ratio that iscalculated are current ratio and quick ratio. There has been marginal improvement in liquidityposition of company.Current ratio increased from 1.42 in year 2013 to 1.47 in year 2014 and 1.5 in year 2015year respectively. From figure, it is depicted that liquid assets of DIPL have not improved as theratio stood at 0.94 in year 2014 that reduced to 1.5 in 2015 year.
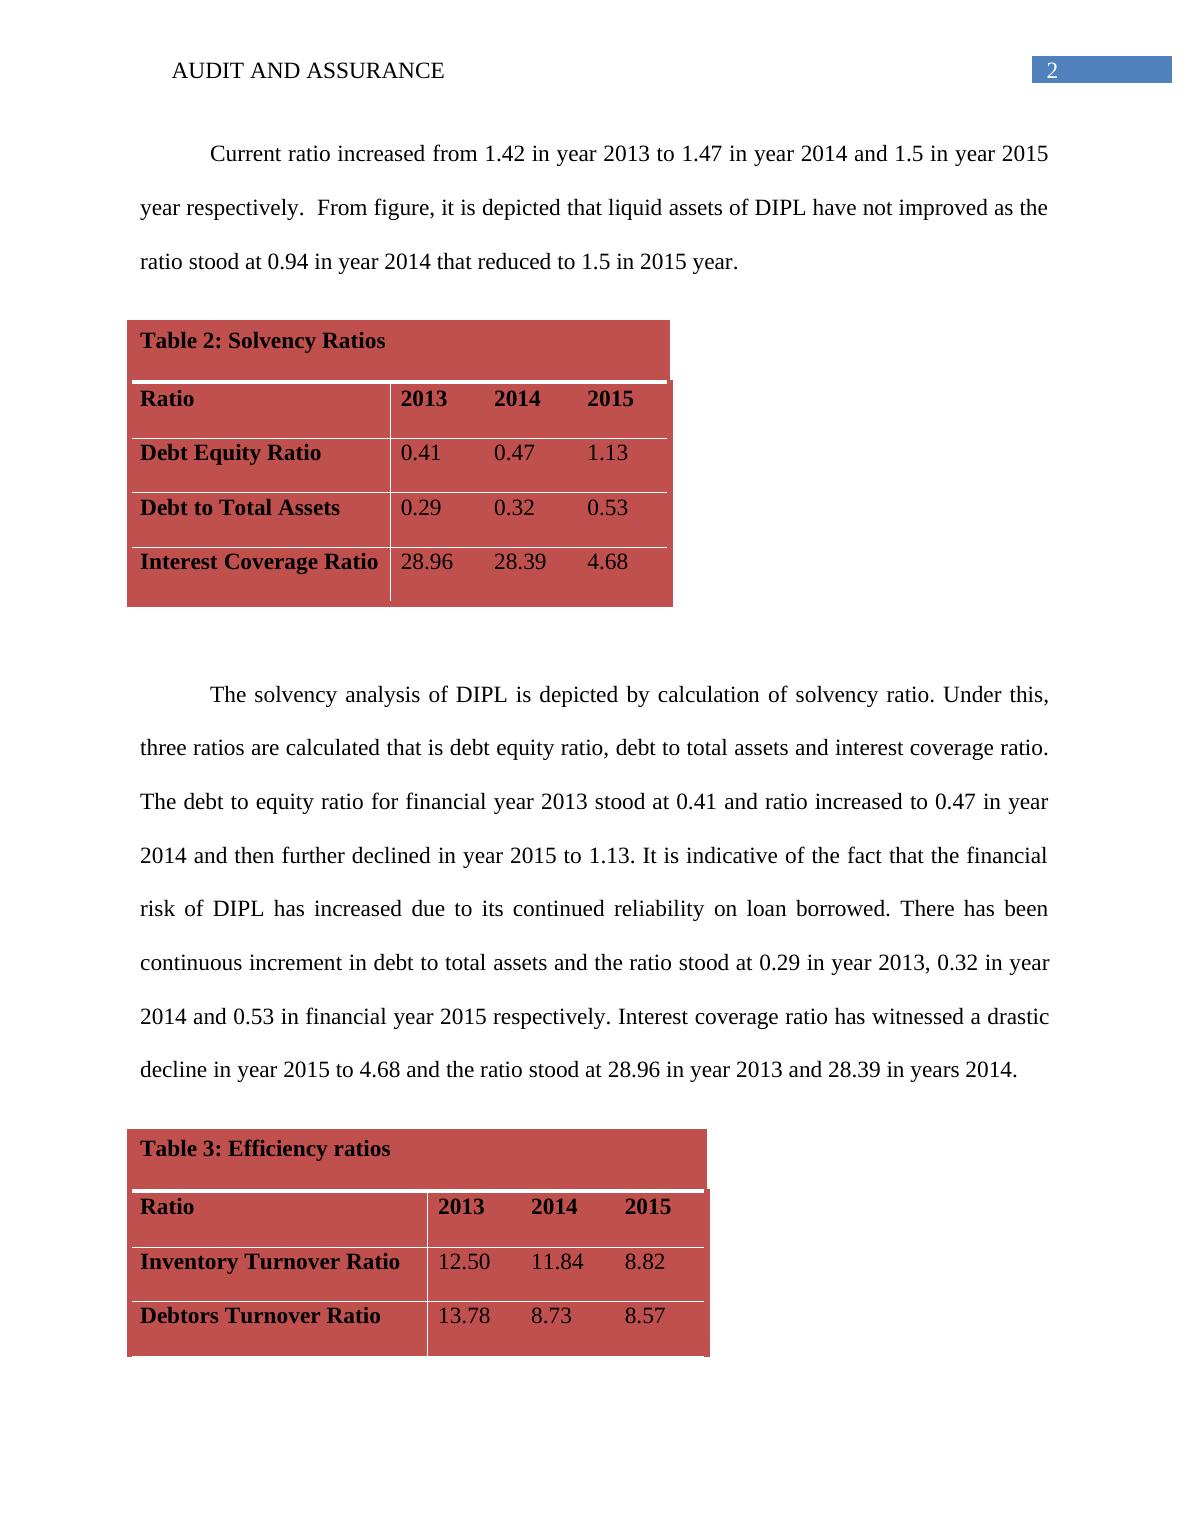
2AUDIT AND ASSURANCETable 2: Solvency RatiosRatio201320142015Debt Equity Ratio 0.410.471.13Debt to Total Assets0.290.320.53Interest Coverage Ratio28.9628.394.68The solvency analysis of DIPL is depicted by calculation of solvency ratio. Under this,three ratios are calculated that is debt equity ratio, debt to total assets and interest coverage ratio.The debt to equity ratio for financial year 2013 stood at 0.41 and ratio increased to 0.47 in year2014 and then further declined in year 2015 to 1.13. It is indicative of the fact that the financialrisk of DIPL has increased due to its continued reliability on loan borrowed. There has beencontinuous increment in debt to total assets and the ratio stood at 0.29 in year 2013, 0.32 in year2014 and 0.53 in financial year 2015 respectively. Interest coverage ratio has witnessed a drasticdecline in year 2015 to 4.68 and the ratio stood at 28.96 in year 2013 and 28.39 in years 2014. Table 3: Efficiency ratiosRatio201320142015Inventory Turnover Ratio 12.5011.848.82Debtors Turnover Ratio 13.788.738.57Efficiency analysis of DIPL is analysing using the calculation of efficiency ratio. Underthis, two ratios are calculated that is inventory turnover ratio and debtors’ turnover ratio.Inventory turnover ratio of DIPL has continuous declined over the period of three years. Ratiostood at 12.50 in year 2013 and it declined further to 11.84 in year 2014 and further to 8.82 inyear 2015 respectively. Debtor turnover ratio of DIPL has also witnessed decline over the period
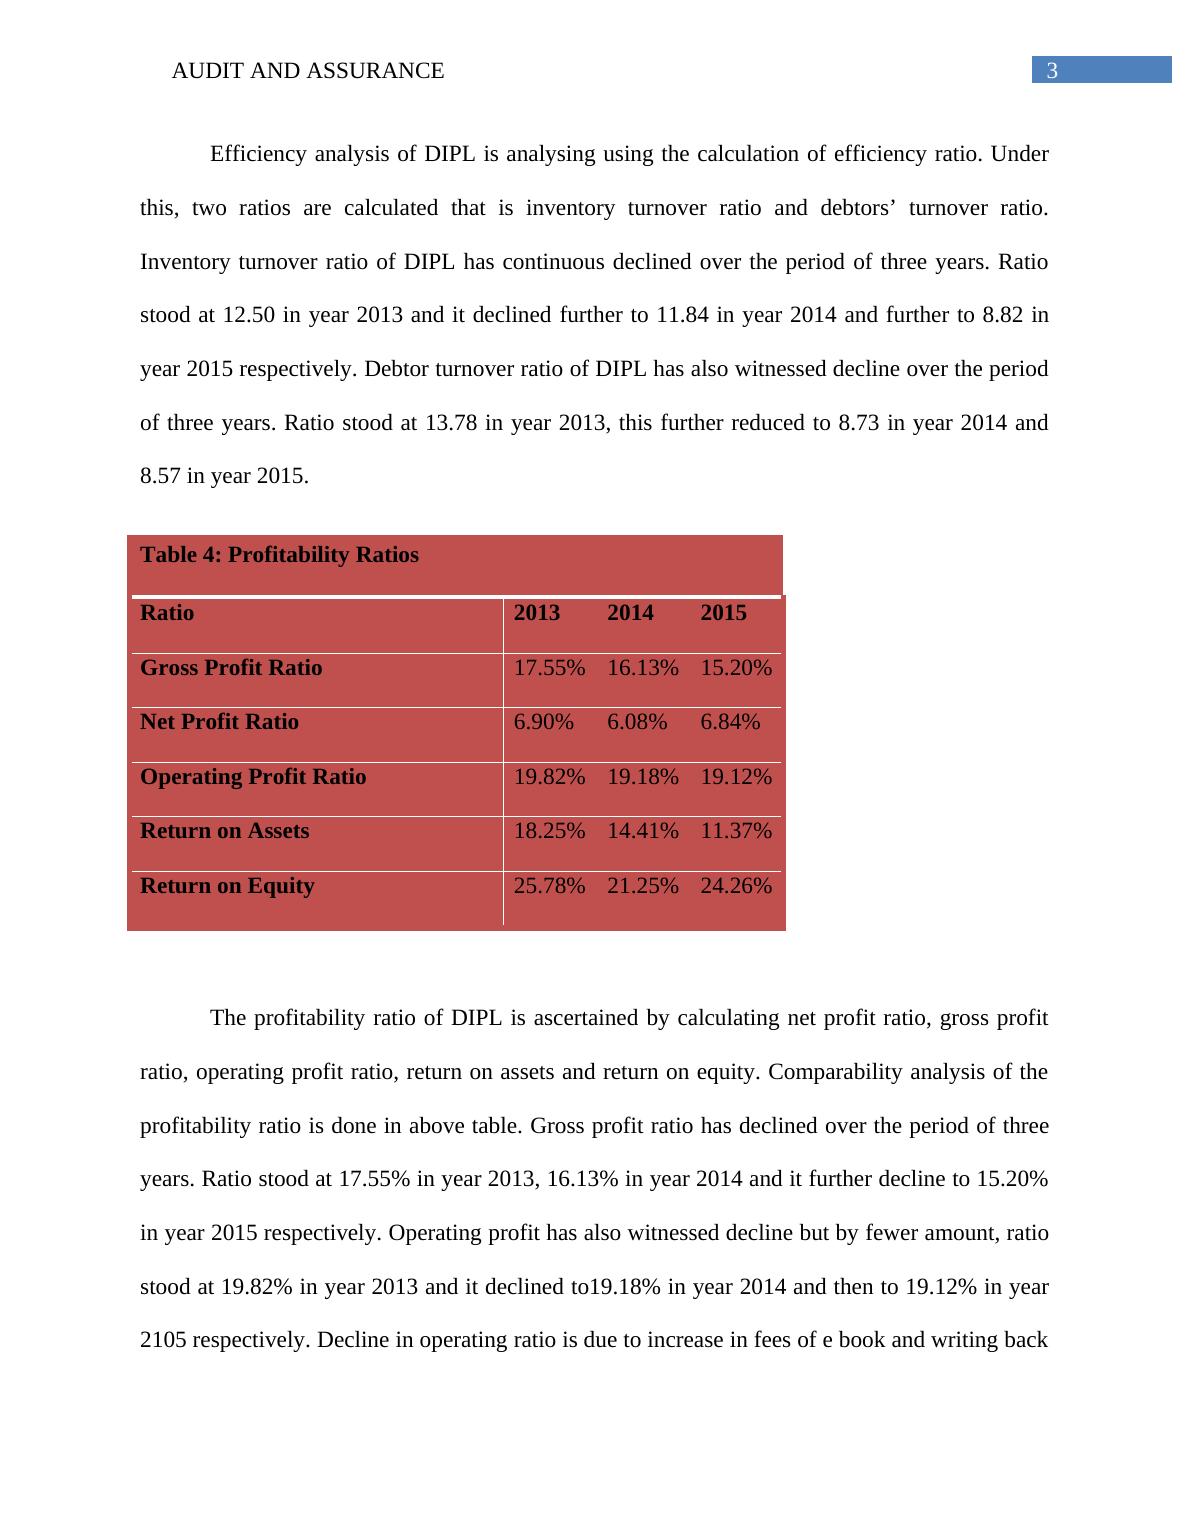
3AUDIT AND ASSURANCEof three years. Ratio stood at 13.78 in year 2013, this further reduced to 8.73 in year 2014 and8.57 in year 2015.Table 4: Profitability RatiosRatio201320142015Gross Profit Ratio 17.55%16.13%15.20%Net Profit Ratio 6.90%6.08%6.84%Operating Profit Ratio 19.82%19.18%19.12%Return on Assets 18.25%14.41%11.37%Return on Equity 25.78%21.25%24.26%The profitability ratio of DIPL is ascertained by calculating net profit ratio, gross profitratio, operating profit ratio, return on assets and return on equity. Comparability analysis of theprofitability ratio is done in above table. Gross profit ratio has declined over the period of threeyears. Ratio stood at 17.55% in year 2013, 16.13% in year 2014 and it further decline to 15.20%in year 2015 respectively. Operating profit has also witnessed decline but by fewer amount, ratiostood at 19.82% in year 2013 and it declined to19.18% in year 2014 and then to 19.12% in year2105 respectively. Decline in operating ratio is due to increase in fees of e book and writing backof allowance in year 2015 for inventory obsolescence. There has been decline in return of equityto shareholders from year 2013 to year 2015. ROE declined from 25.75% in year 2013 to 21.25in year 2014 and ratio further improved to 24.26% in year 2015 respectively. There has also beendecline in return on assets. ROA stood at 28.25% in year 2013 that reduced to 21.25% in year2014 and further reduced to 11.37% in year 2015 respectively. Net profit has remained constantand there was fluctuation only by fewer amounts. Net profit for year 2015 stood at 6.84% asagainst 6.08% in year 2014.
End of preview
Want to access all the pages? Upload your documents or become a member.
Related Documents
Auditing Theory and Practice : Assignmentlg...
|9
|1974
|201
HI6026 Audit, Assurance and Compliance | Studylg...
|12
|2632
|58
HI6026 - Assignment on Audit Assurance and Compliances PDFlg...
|11
|2662
|206
HI6026 Audit, Assurance and Compliancelg...
|11
|2704
|27
HI6026 - Report on Audit, Assurance and Compliancelg...
|8
|2074
|55
Audit, Assurance and Compliance - Question Answerslg...
|9
|2763
|51