Australia Economic Progress Report: COVID-19 Analysis
VerifiedAdded on 2022/08/29
|5
|1364
|16
Report
AI Summary
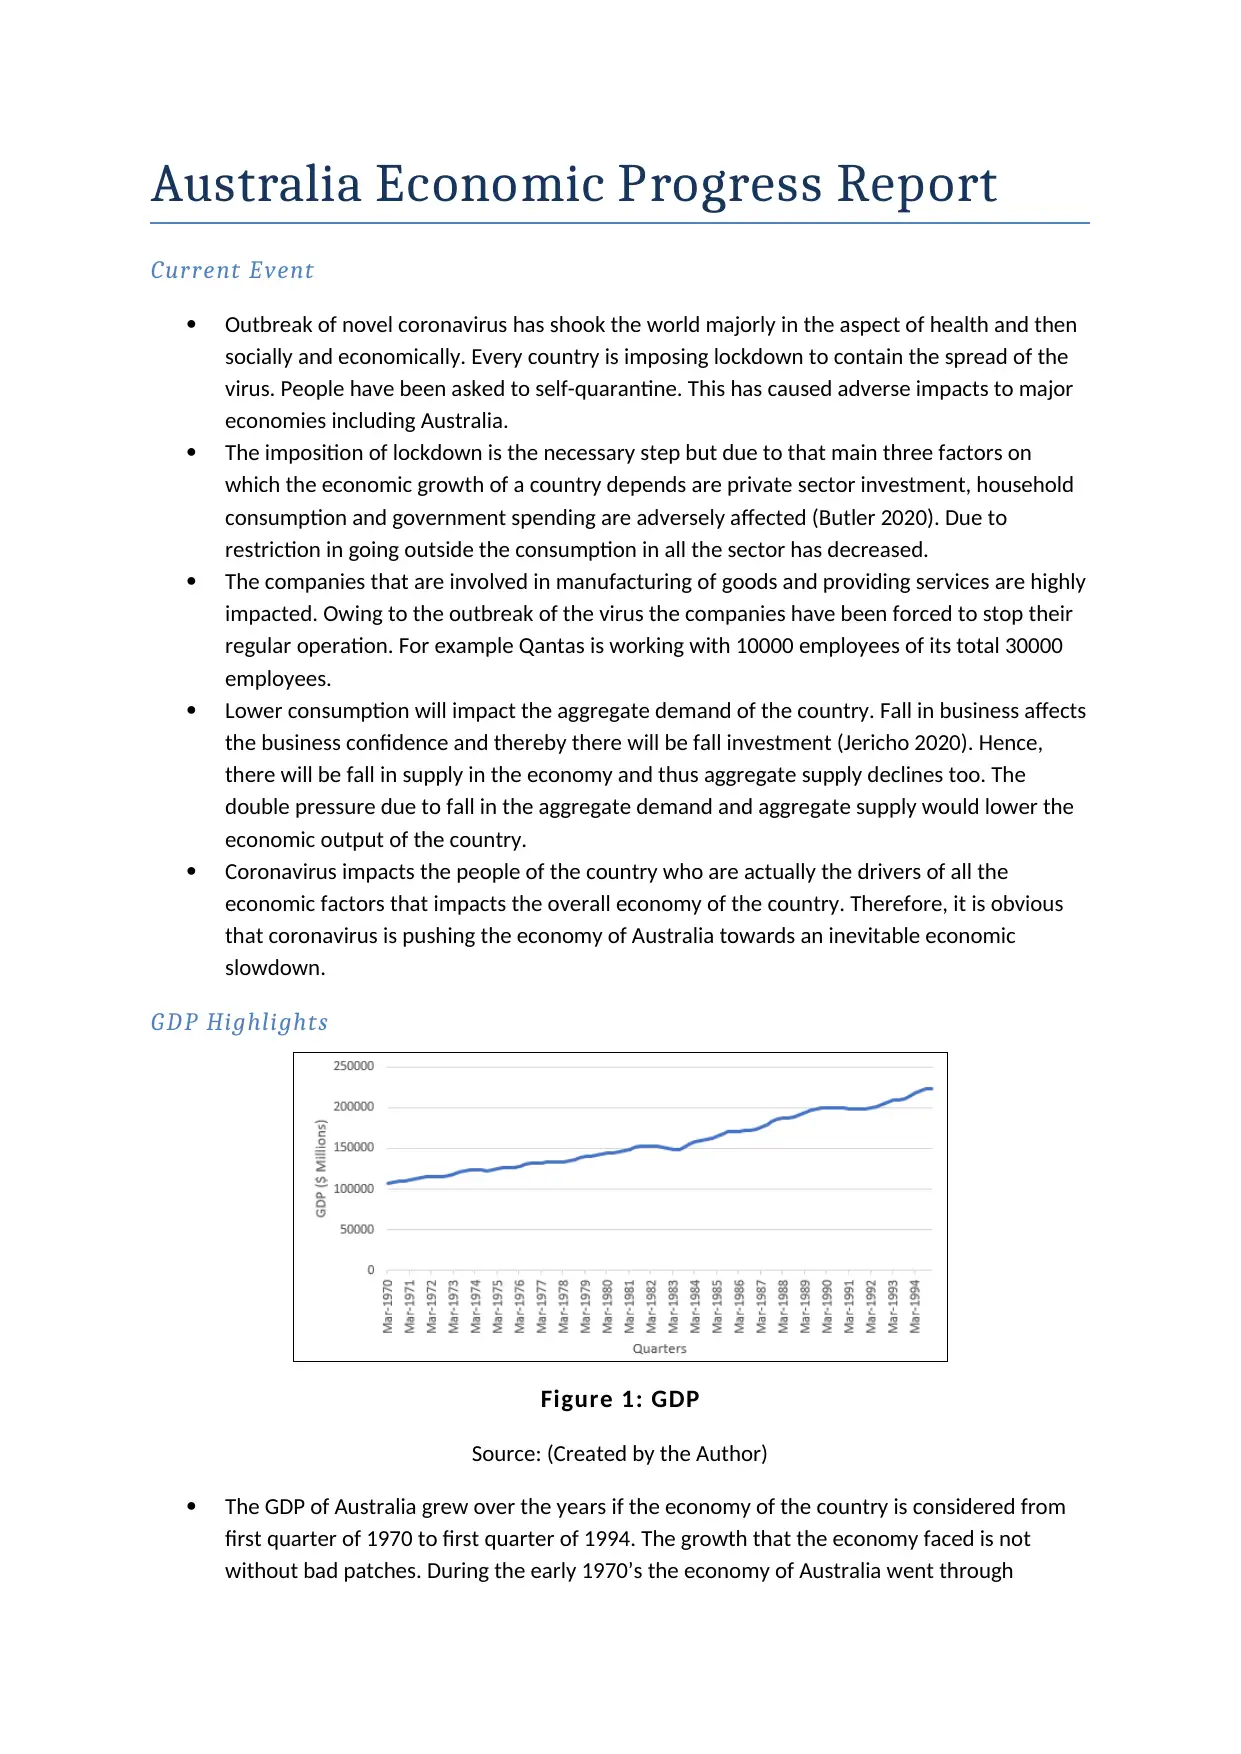
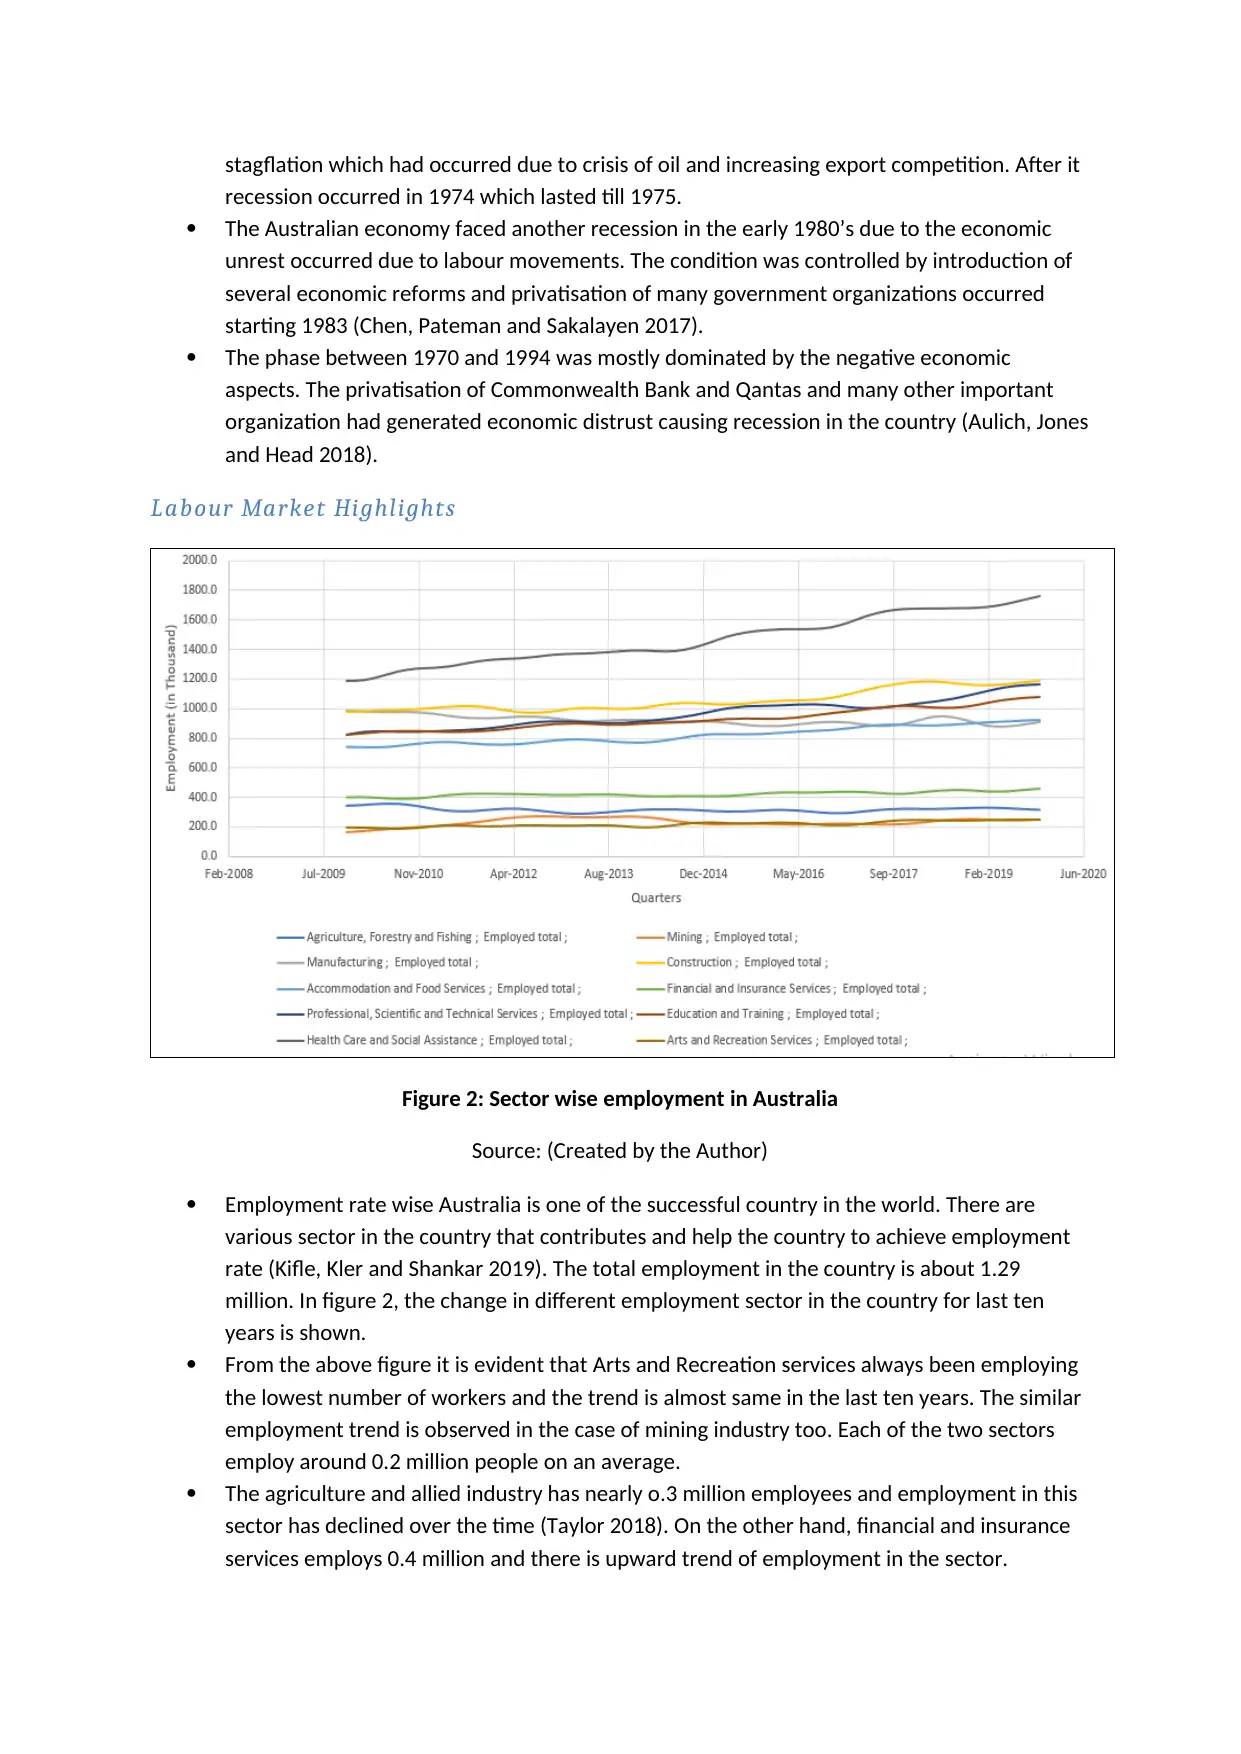
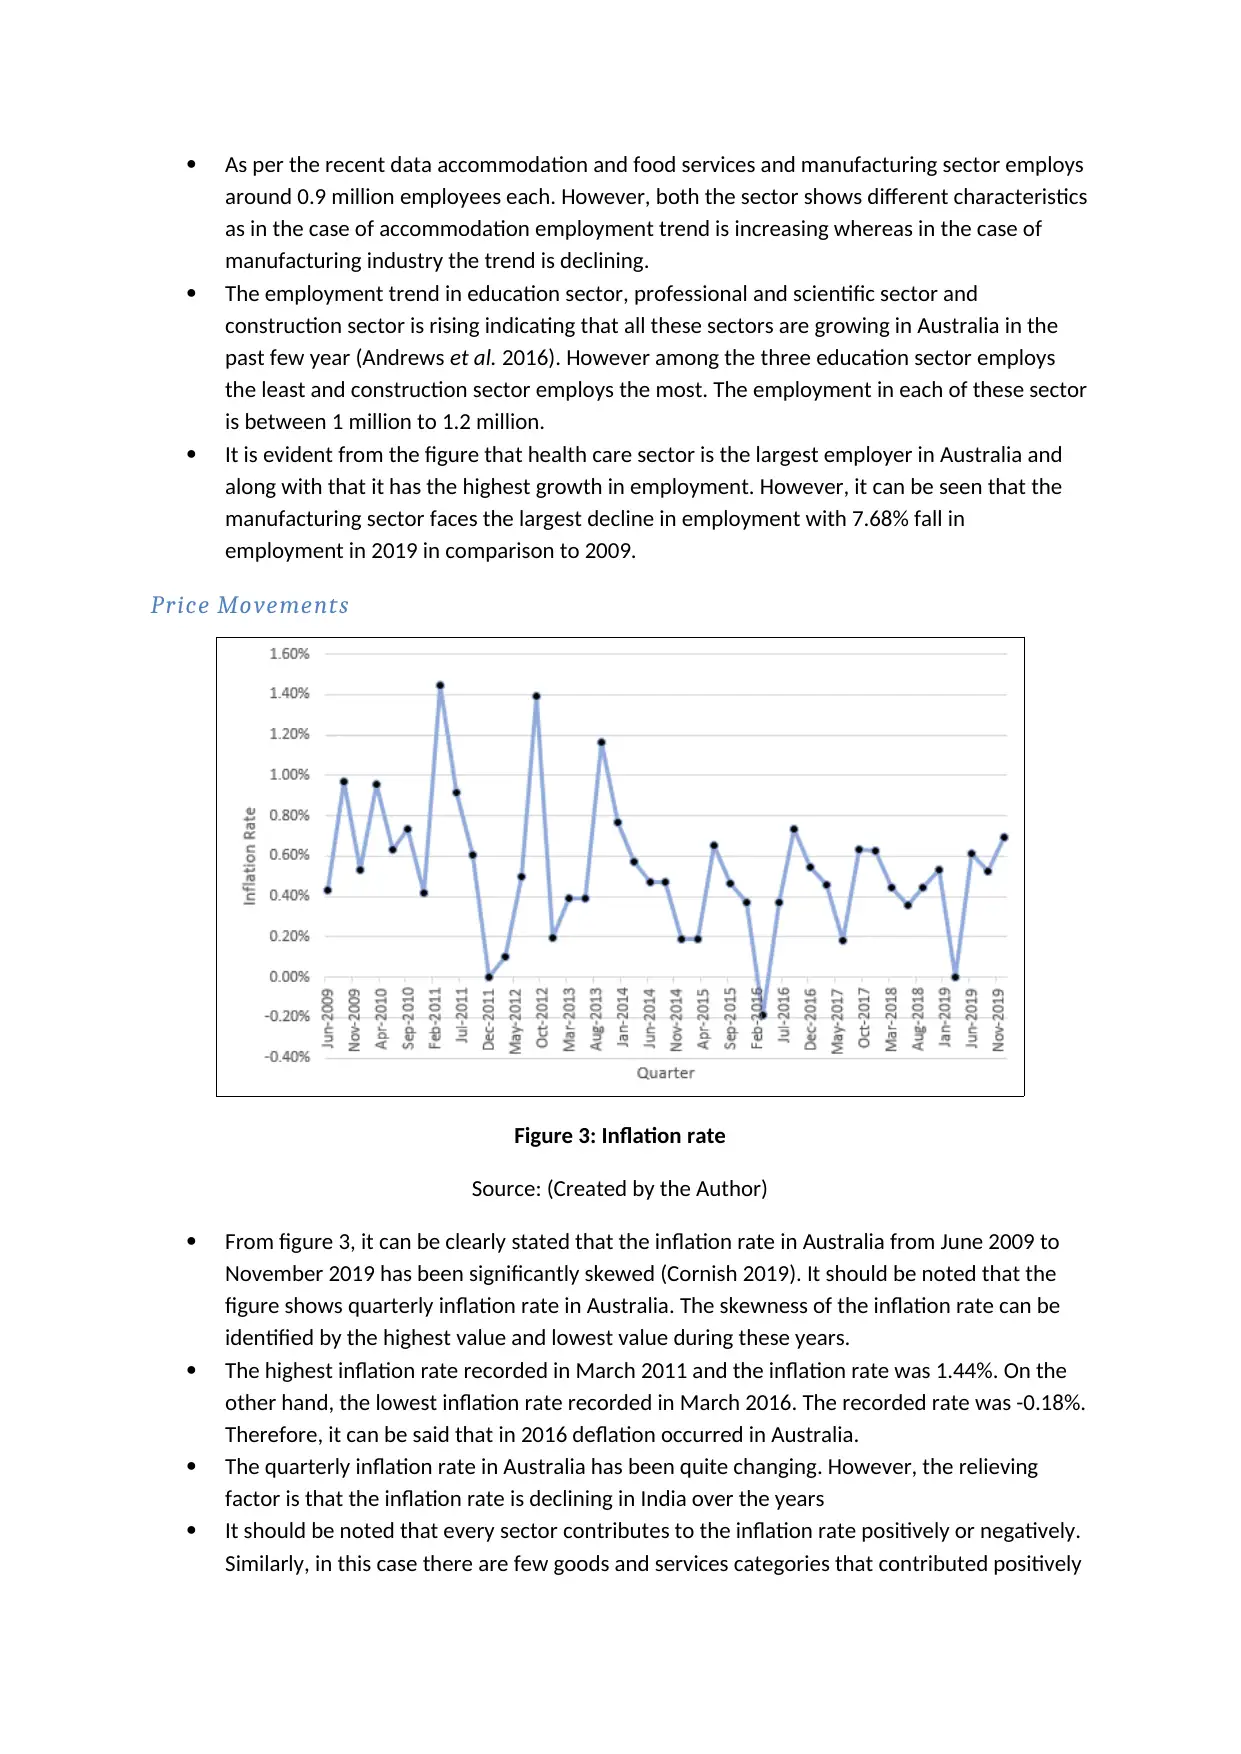
This report provides an analysis of Australia's economic progress, focusing on the impact of the COVID-19 pandemic. It examines key economic indicators, including GDP trends from 1970 to 1994, highlighting periods of growth and recession. The report also details the labour market, analyzing sector-wise employment changes over the past decade, with specific attention to the healthcare, manufacturing, and other sectors. Furthermore, it investigates price movements, particularly the inflation rate from June 2009 to November 2019, identifying periods of deflation and the goods and services categories that most influenced inflation. The analysis reveals the significant economic challenges posed by the coronavirus, including decreased consumption, business confidence, and aggregate supply, ultimately pushing the Australian economy towards a slowdown. The report references multiple sources to support its findings.

1 out of 5
Related Documents


Your All-in-One AI-Powered Toolkit for Academic Success.
+13062052269
info@desklib.com
Available 24*7 on WhatsApp / Email
![[object Object]](/_next/static/media/star-bottom.7253800d.svg)
Copyright © 2020–2026 A2Z Services. All Rights Reserved. Developed and managed by ZUCOL.