ARBE2307 Economics of Construction Industry: Performance Analysis
VerifiedAdded on 2023/06/08
|19
|4484
|260
Report
AI Summary
This report provides a comprehensive analysis of the performance of Australia's construction industry. It begins with an overview of key economic indicators, including real GDP, GDP growth rate, and inflation, examining their trends over a five-year period. The report then delves into the fiscal and monetary policies that have shaped the industry's performance, highlighting their impact on economic stability and growth. A significant portion of the report is dedicated to a detailed examination of the construction industry itself, breaking it down into its major sectors: engineering construction, non-residential buildings, and residential buildings. Each sector's performance, growth drivers, and future prospects are analyzed, supported by data and forecasts. The report concludes with a summary of the key findings and insights into the current state and future outlook of the Australian construction industry, offering a valuable resource for students studying economics and related fields.
Running head: PERFORMANCE OF AUSTRALIA’S CONSTRUCTION INDUSTRY
Performance of Australia’s Construction Industry
Name of the Student
Name of the University
Author Note
Performance of Australia’s Construction Industry
Name of the Student
Name of the University
Author Note
Paraphrase This Document
Need a fresh take? Get an instant paraphrase of this document with our AI Paraphraser
1PERFORMANCE OF AUSTRALIA’S CONSTRUCTION INDUSTRY
Table of Contents
Table of Contents.............................................................................................................................1
Introduction..................................................................................................................................2
Discussion....................................................................................................................................2
Production Analysis.................................................................................................................2
Price Level Analysis................................................................................................................4
Fiscal Policy.............................................................................................................................6
Monetary Policy.......................................................................................................................6
Construction Industry Analysis...............................................................................................6
Conclusion.................................................................................................................................11
Part 2..............................................................................................................................................12
Introduction................................................................................................................................12
Analysis of the Engineering Construction Sector......................................................................12
Government Measures...............................................................................................................14
Conclusion.................................................................................................................................14
2PERFORMANCE OF AUSTRALIA’S CONSTRUCTION INDUSTRY
Part 1
Introduction
The economy of Australia has been growing over the years and has been performing well
consistently in comparison to the other OECD countries. In 2017, as per the IMF (International
Monetary Fund) data, the rate of inflation in Australia had been around 1.9% in 2017. The
unemployment rate as on 2017 was low at 5.6% and is expected to further fall as predicted by the
ABS or Australian Bureau of Statistics. This part of the report analyses a few of the economic
indicators of Australia and checks its economic performance for the last five years and the
performance of the different sectors of the construction industry. The indicators selected are the
real GDP, the growth rate of real GDP and the inflation rate. Further analysis of the construction
industry and its different sectors is carried out in details. The monetary and fiscal policies
undertaken over the past five years have also been studied in the following sections of this
report.
Discussion
Production Analysis
Real GDP
Real GDP or real gross domestic product takes into account the final value of goods and
services that is produced by a given country, in a given year, within its geographical territory of
that country. Real GDP is an inflation-adjusted measure, which is expressed with respect to a
given year which is kept constant and is called a base year. By keeping the base year constant,
the changes that take place in the price level of the economy can be traced and this will help in
providing a more accurate reflection of a country’s economic growth. To analyze the purchasing
power and level of growth of an economy governments often use this measure. The graph shows
⊘ This is a preview!⊘
Do you want full access?
Subscribe today to unlock all pages.
Trusted by 1+ million students worldwide
3PERFORMANCE OF AUSTRALIA’S CONSTRUCTION INDUSTRY
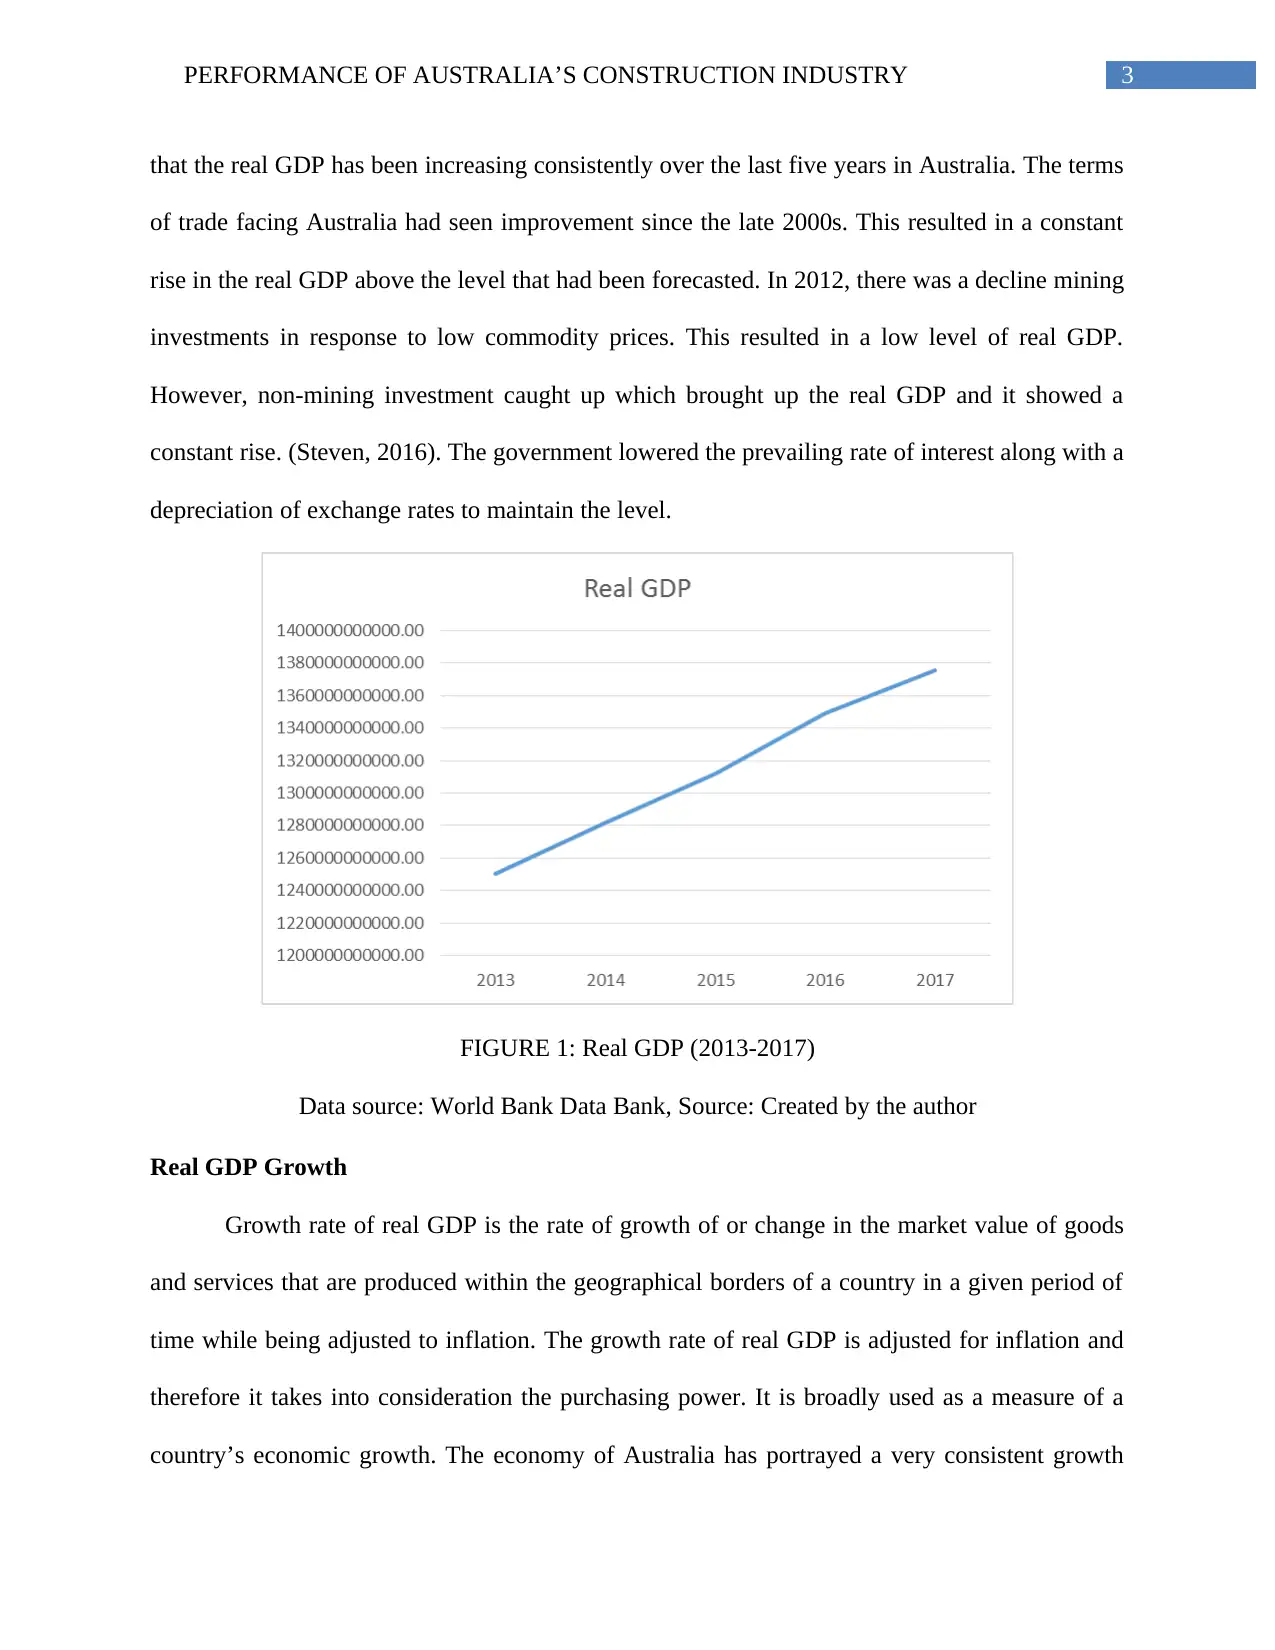
that the real GDP has been increasing consistently over the last five years in Australia. The terms
of trade facing Australia had seen improvement since the late 2000s. This resulted in a constant
rise in the real GDP above the level that had been forecasted. In 2012, there was a decline mining
investments in response to low commodity prices. This resulted in a low level of real GDP.
However, non-mining investment caught up which brought up the real GDP and it showed a
constant rise. (Steven, 2016). The government lowered the prevailing rate of interest along with a
depreciation of exchange rates to maintain the level.
FIGURE 1: Real GDP (2013-2017)
Data source: World Bank Data Bank, Source: Created by the author
Real GDP Growth
Growth rate of real GDP is the rate of growth of or change in the market value of goods
and services that are produced within the geographical borders of a country in a given period of
time while being adjusted to inflation. The growth rate of real GDP is adjusted for inflation and
therefore it takes into consideration the purchasing power. It is broadly used as a measure of a
country’s economic growth. The economy of Australia has portrayed a very consistent growth
Paraphrase This Document
Need a fresh take? Get an instant paraphrase of this document with our AI Paraphraser
4PERFORMANCE OF AUSTRALIA’S CONSTRUCTION INDUSTRY
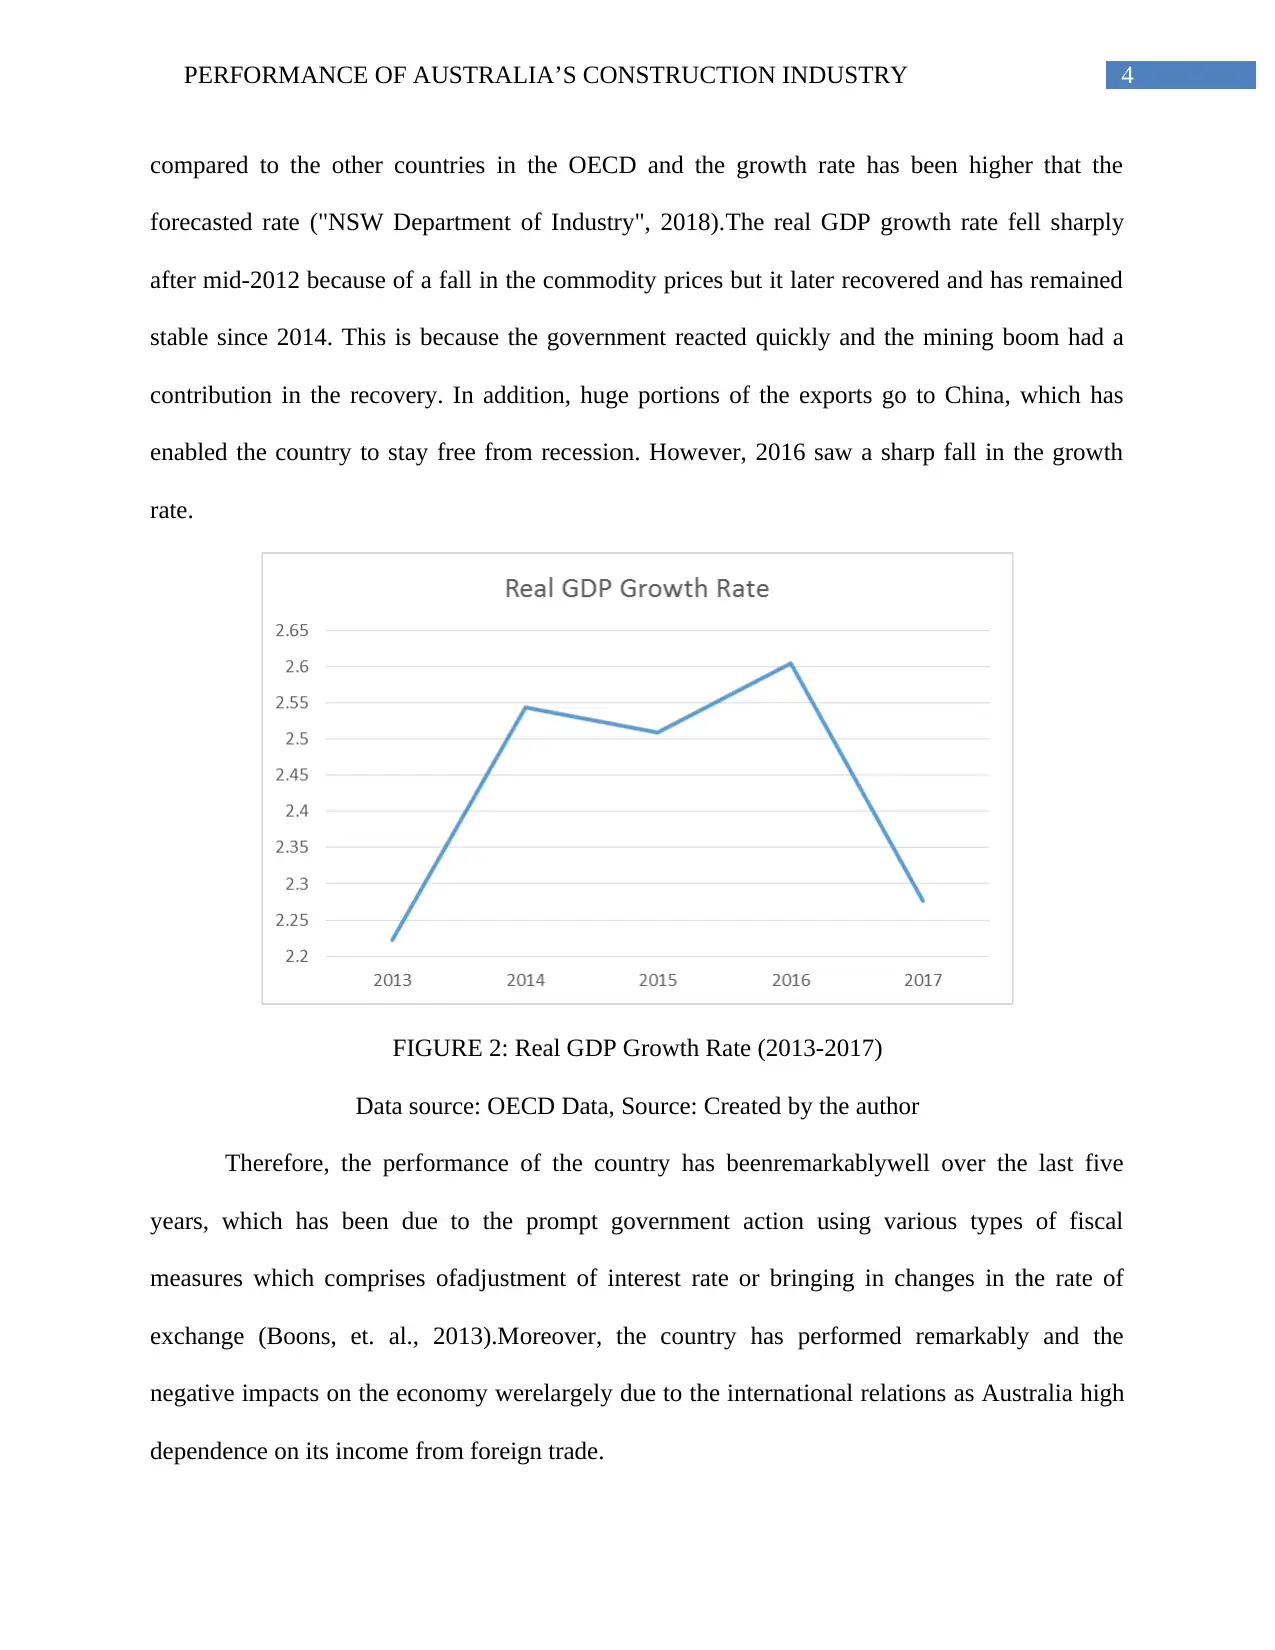
compared to the other countries in the OECD and the growth rate has been higher that the
forecasted rate ("NSW Department of Industry", 2018).The real GDP growth rate fell sharply
after mid-2012 because of a fall in the commodity prices but it later recovered and has remained
stable since 2014. This is because the government reacted quickly and the mining boom had a
contribution in the recovery. In addition, huge portions of the exports go to China, which has
enabled the country to stay free from recession. However, 2016 saw a sharp fall in the growth
rate.
FIGURE 2: Real GDP Growth Rate (2013-2017)
Data source: OECD Data, Source: Created by the author
Therefore, the performance of the country has beenremarkablywell over the last five
years, which has been due to the prompt government action using various types of fiscal
measures which comprises ofadjustment of interest rate or bringing in changes in the rate of
exchange (Boons, et. al., 2013).Moreover, the country has performed remarkably and the
negative impacts on the economy werelargely due to the international relations as Australia high
dependence on its income from foreign trade.
5PERFORMANCE OF AUSTRALIA’S CONSTRUCTION INDUSTRY
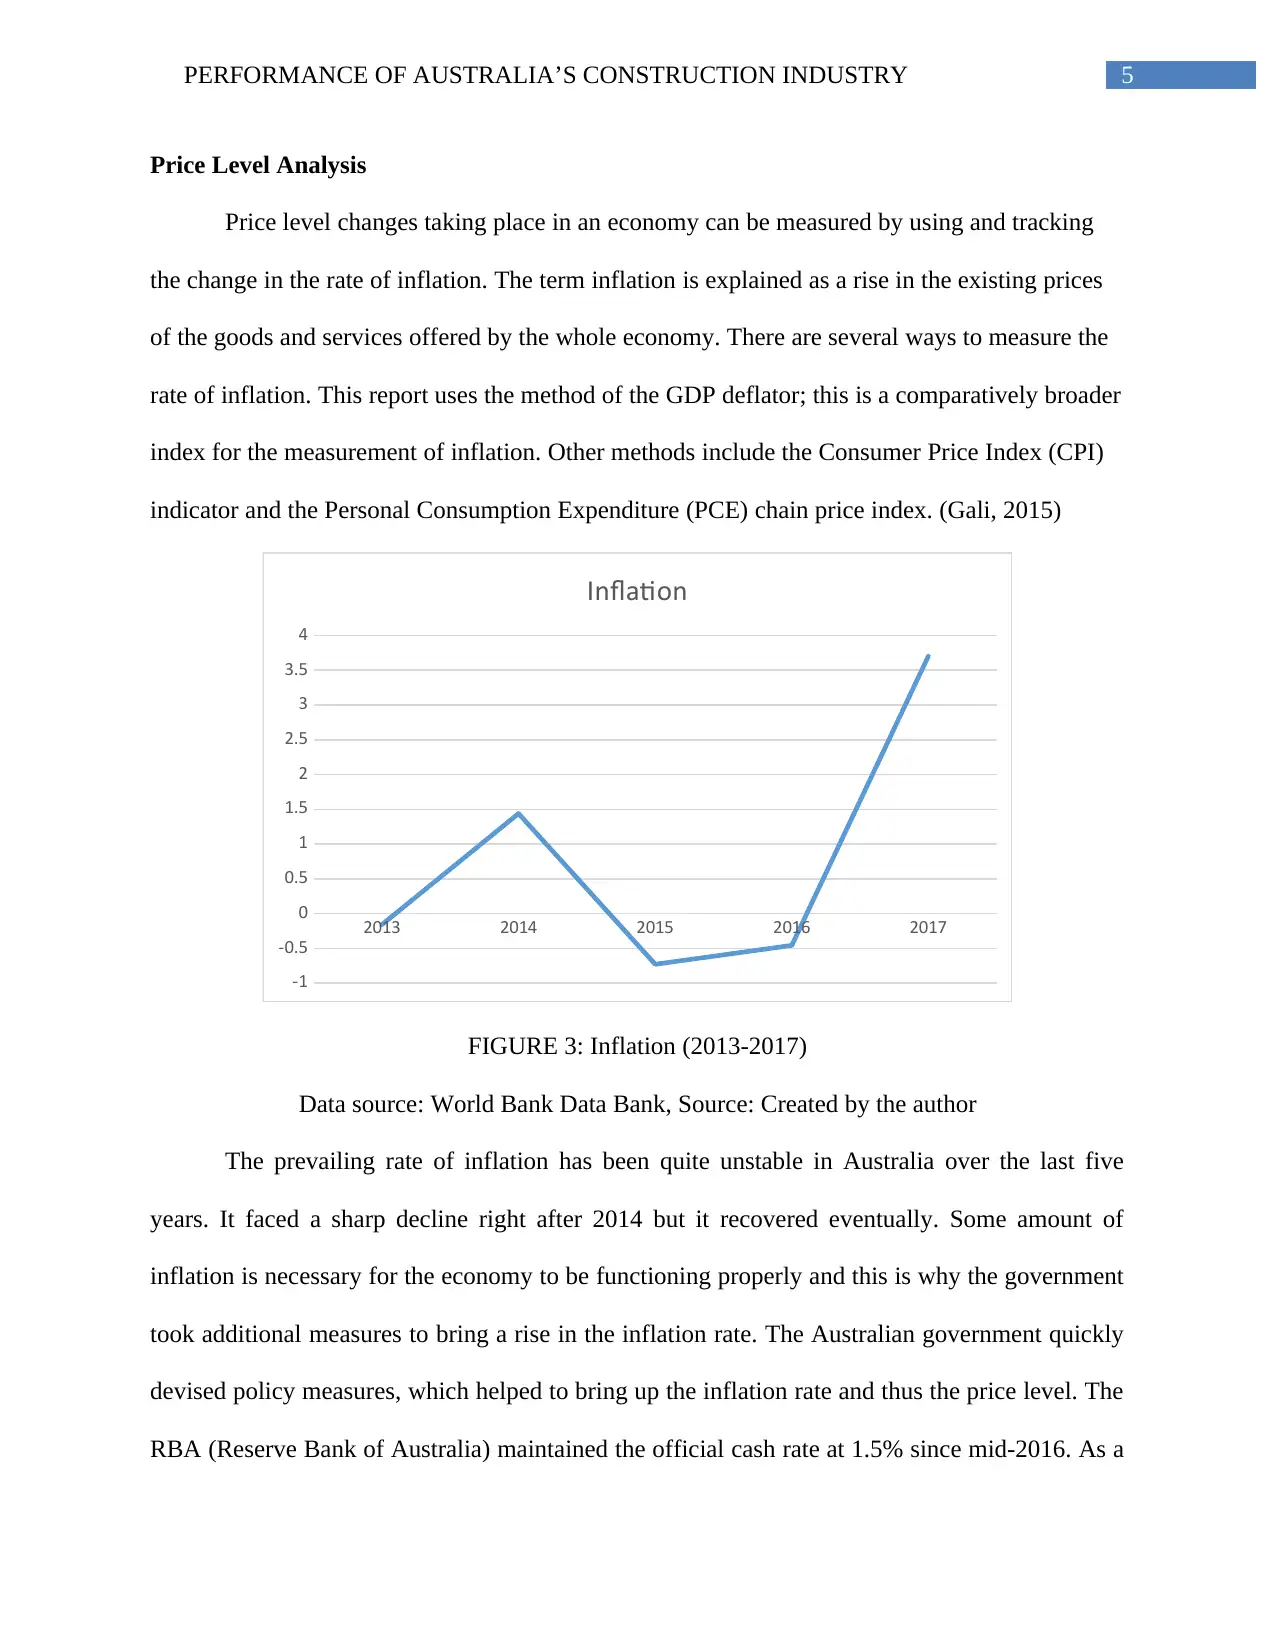
Price Level Analysis
Price level changes taking place in an economy can be measured by using and tracking
the change in the rate of inflation. The term inflation is explained as a rise in the existing prices
of the goods and services offered by the whole economy. There are several ways to measure the
rate of inflation. This report uses the method of the GDP deflator; this is a comparatively broader
index for the measurement of inflation. Other methods include the Consumer Price Index (CPI)
indicator and the Personal Consumption Expenditure (PCE) chain price index. (Gali, 2015)
2013 2014 2015 2016 2017
-1
-0.5
0
0.5
1
1.5
2
2.5
3
3.5
4
Inflation
FIGURE 3: Inflation (2013-2017)
Data source: World Bank Data Bank, Source: Created by the author
The prevailing rate of inflation has been quite unstable in Australia over the last five
years. It faced a sharp decline right after 2014 but it recovered eventually. Some amount of
inflation is necessary for the economy to be functioning properly and this is why the government
took additional measures to bring a rise in the inflation rate. The Australian government quickly
devised policy measures, which helped to bring up the inflation rate and thus the price level. The
RBA (Reserve Bank of Australia) maintained the official cash rate at 1.5% since mid-2016. As a
⊘ This is a preview!⊘
Do you want full access?
Subscribe today to unlock all pages.
Trusted by 1+ million students worldwide

6PERFORMANCE OF AUSTRALIA’S CONSTRUCTION INDUSTRY
result, the CPI was as low as to 1.9%. The RBA cautioned that low inflation might exceed the
period that was previously forecast.
Fiscal Policy
Over the last five years, taxes in the Australian government was made to grow faster than
the growth in their GDP and this lead high increases in the revenue. The fiscal strategy of the
Australian government relies greatly on the optimism projections. Medium term fiscal objectives
will be undertaken to achieve balanced budget in different economic cycles (McCallum, et al.,
2015).
Monetary Policy
Over the past five years, the monetary policy decisions are made and expressed in terms
of the targeted cash rates. A cash rate is the overnight money market interest rate for overnight
loans. Over the past five years, the cash rate has been falling and this cash rate is decided upon
keeping the inflation rate in perspective the target rate of which has been 2-3 percent (Wilkins, &
Wooden, 2014). The determination of the monetary policy is done by the bank while making
sure that full employment, price stability, welfare and economic prosperity is maintained.
Construction Industry Analysis
According to economists from the American Institute of Architects (AIA), Associated
Builders and Contractors (ABC), and National Association of Home Builders (NAHB), the
future of the construction industry looks very promising where the engineering construction
sector has dominated the industry and accounts for over 10% of the GDP. The total value of the
industry was over $200 billion in 2012-2013 (Lehmann, et al., 2015). This industry has three
sectors:
Paraphrase This Document
Need a fresh take? Get an instant paraphrase of this document with our AI Paraphraser
7PERFORMANCE OF AUSTRALIA’S CONSTRUCTION INDUSTRY
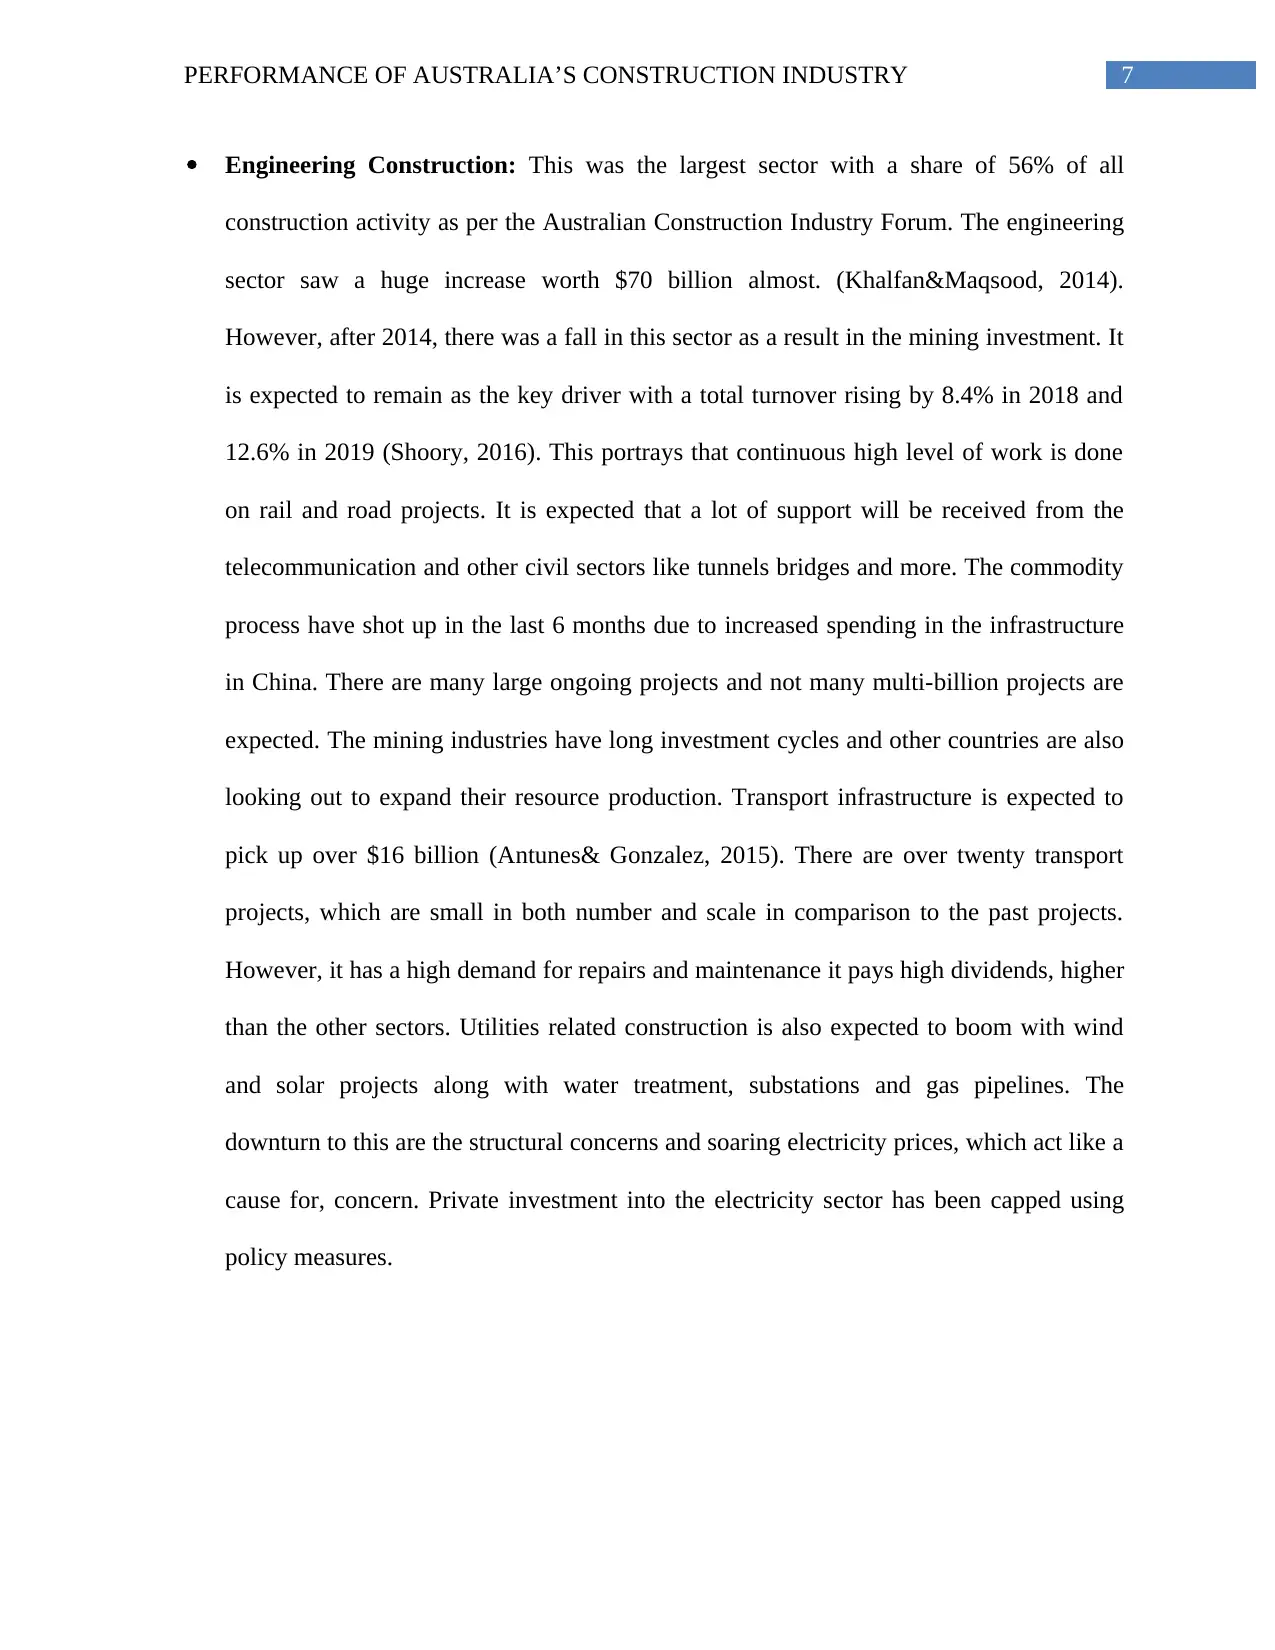
Engineering Construction: This was the largest sector with a share of 56% of all
construction activity as per the Australian Construction Industry Forum. The engineering
sector saw a huge increase worth $70 billion almost. (Khalfan&Maqsood, 2014).
However, after 2014, there was a fall in this sector as a result in the mining investment. It
is expected to remain as the key driver with a total turnover rising by 8.4% in 2018 and
12.6% in 2019 (Shoory, 2016). This portrays that continuous high level of work is done
on rail and road projects. It is expected that a lot of support will be received from the
telecommunication and other civil sectors like tunnels bridges and more. The commodity
process have shot up in the last 6 months due to increased spending in the infrastructure
in China. There are many large ongoing projects and not many multi-billion projects are
expected. The mining industries have long investment cycles and other countries are also
looking out to expand their resource production. Transport infrastructure is expected to
pick up over $16 billion (Antunes& Gonzalez, 2015). There are over twenty transport
projects, which are small in both number and scale in comparison to the past projects.
However, it has a high demand for repairs and maintenance it pays high dividends, higher
than the other sectors. Utilities related construction is also expected to boom with wind
and solar projects along with water treatment, substations and gas pipelines. The
downturn to this are the structural concerns and soaring electricity prices, which act like a
cause for, concern. Private investment into the electricity sector has been capped using
policy measures.
8PERFORMANCE OF AUSTRALIA’S CONSTRUCTION INDUSTRY
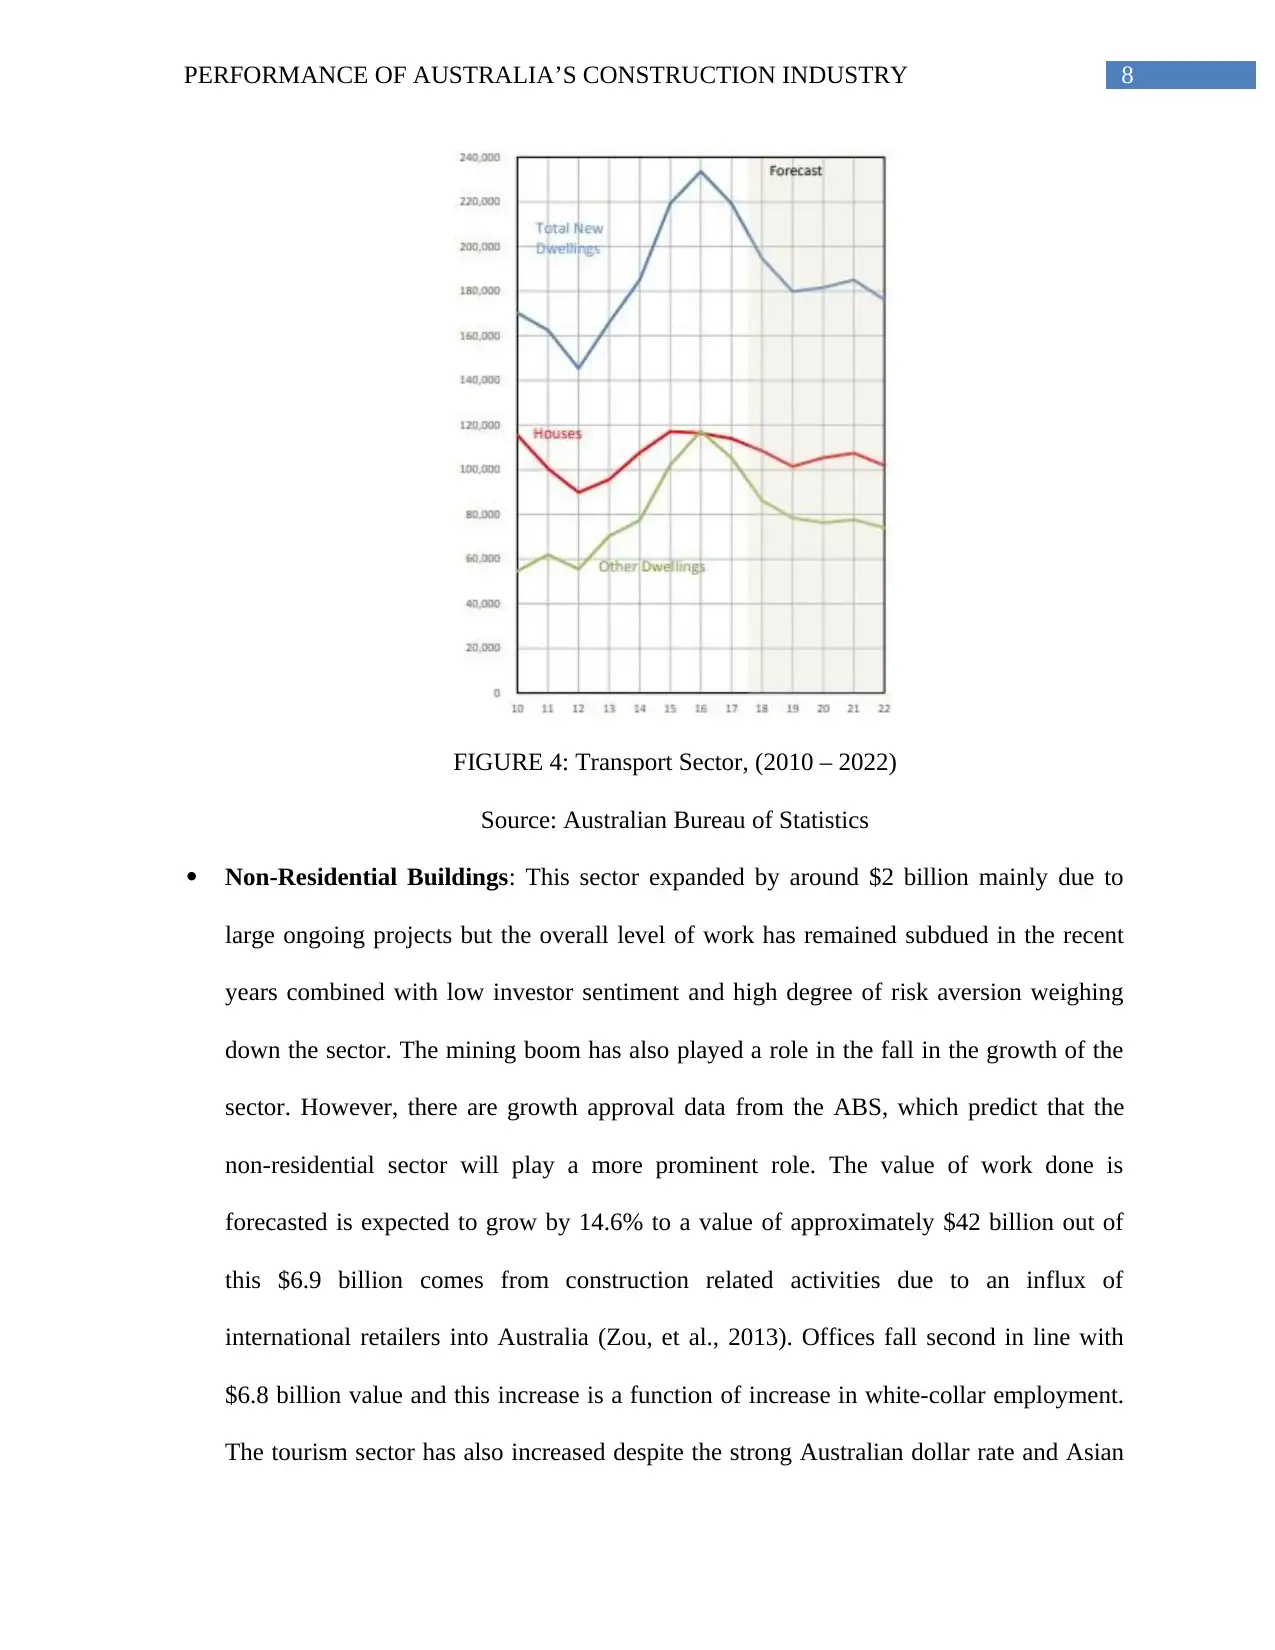
FIGURE 4: Transport Sector, (2010 – 2022)
Source: Australian Bureau of Statistics
Non-Residential Buildings: This sector expanded by around $2 billion mainly due to
large ongoing projects but the overall level of work has remained subdued in the recent
years combined with low investor sentiment and high degree of risk aversion weighing
down the sector. The mining boom has also played a role in the fall in the growth of the
sector. However, there are growth approval data from the ABS, which predict that the
non-residential sector will play a more prominent role. The value of work done is
forecasted is expected to grow by 14.6% to a value of approximately $42 billion out of
this $6.9 billion comes from construction related activities due to an influx of
international retailers into Australia (Zou, et al., 2013). Offices fall second in line with
$6.8 billion value and this increase is a function of increase in white-collar employment.
The tourism sector has also increased despite the strong Australian dollar rate and Asian
⊘ This is a preview!⊘
Do you want full access?
Subscribe today to unlock all pages.
Trusted by 1+ million students worldwide
9PERFORMANCE OF AUSTRALIA’S CONSTRUCTION INDUSTRY
tourists are the highest contributor. Asian investment is also high with over $4 billion
projects under construction. Out of the $11.7 billion, $9 billion has been allocated to
resort projects. In the education related construction, sector forecasts show 27.5% growth
with a value of $6.2 billion while the health sector has shown healthy growth whose
forecast shows a 17.9% growth (Loosemore, 2014).
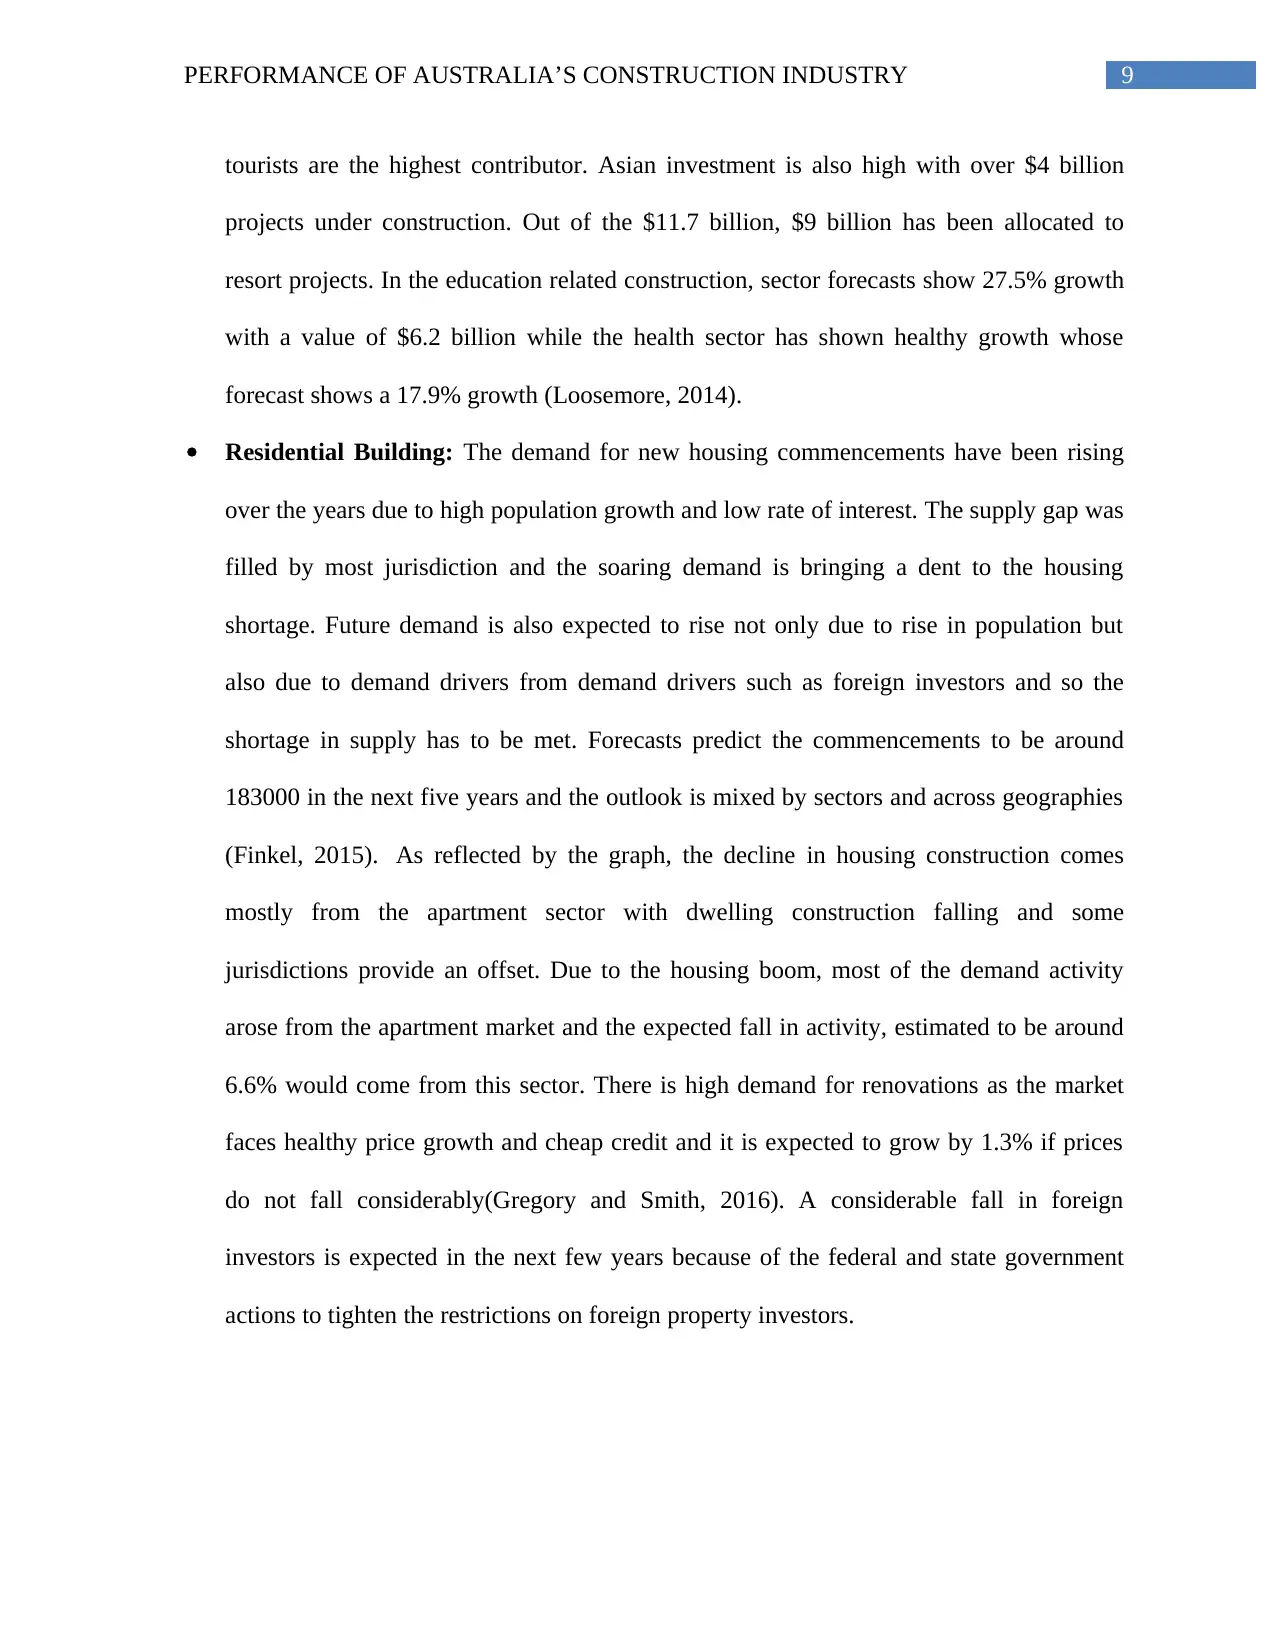
Residential Building: The demand for new housing commencements have been rising
over the years due to high population growth and low rate of interest. The supply gap was
filled by most jurisdiction and the soaring demand is bringing a dent to the housing
shortage. Future demand is also expected to rise not only due to rise in population but
also due to demand drivers from demand drivers such as foreign investors and so the
shortage in supply has to be met. Forecasts predict the commencements to be around
183000 in the next five years and the outlook is mixed by sectors and across geographies
(Finkel, 2015). As reflected by the graph, the decline in housing construction comes
mostly from the apartment sector with dwelling construction falling and some
jurisdictions provide an offset. Due to the housing boom, most of the demand activity
arose from the apartment market and the expected fall in activity, estimated to be around
6.6% would come from this sector. There is high demand for renovations as the market
faces healthy price growth and cheap credit and it is expected to grow by 1.3% if prices
do not fall considerably(Gregory and Smith, 2016). A considerable fall in foreign
investors is expected in the next few years because of the federal and state government
actions to tighten the restrictions on foreign property investors.
tourists are the highest contributor. Asian investment is also high with over $4 billion
projects under construction. Out of the $11.7 billion, $9 billion has been allocated to
resort projects. In the education related construction, sector forecasts show 27.5% growth
with a value of $6.2 billion while the health sector has shown healthy growth whose
forecast shows a 17.9% growth (Loosemore, 2014).
Residential Building: The demand for new housing commencements have been rising
over the years due to high population growth and low rate of interest. The supply gap was
filled by most jurisdiction and the soaring demand is bringing a dent to the housing
shortage. Future demand is also expected to rise not only due to rise in population but
also due to demand drivers from demand drivers such as foreign investors and so the
shortage in supply has to be met. Forecasts predict the commencements to be around
183000 in the next five years and the outlook is mixed by sectors and across geographies
(Finkel, 2015). As reflected by the graph, the decline in housing construction comes
mostly from the apartment sector with dwelling construction falling and some
jurisdictions provide an offset. Due to the housing boom, most of the demand activity
arose from the apartment market and the expected fall in activity, estimated to be around
6.6% would come from this sector. There is high demand for renovations as the market
faces healthy price growth and cheap credit and it is expected to grow by 1.3% if prices
do not fall considerably(Gregory and Smith, 2016). A considerable fall in foreign
investors is expected in the next few years because of the federal and state government
actions to tighten the restrictions on foreign property investors.
Paraphrase This Document
Need a fresh take? Get an instant paraphrase of this document with our AI Paraphraser
10PERFORMANCE OF AUSTRALIA’S CONSTRUCTION INDUSTRY
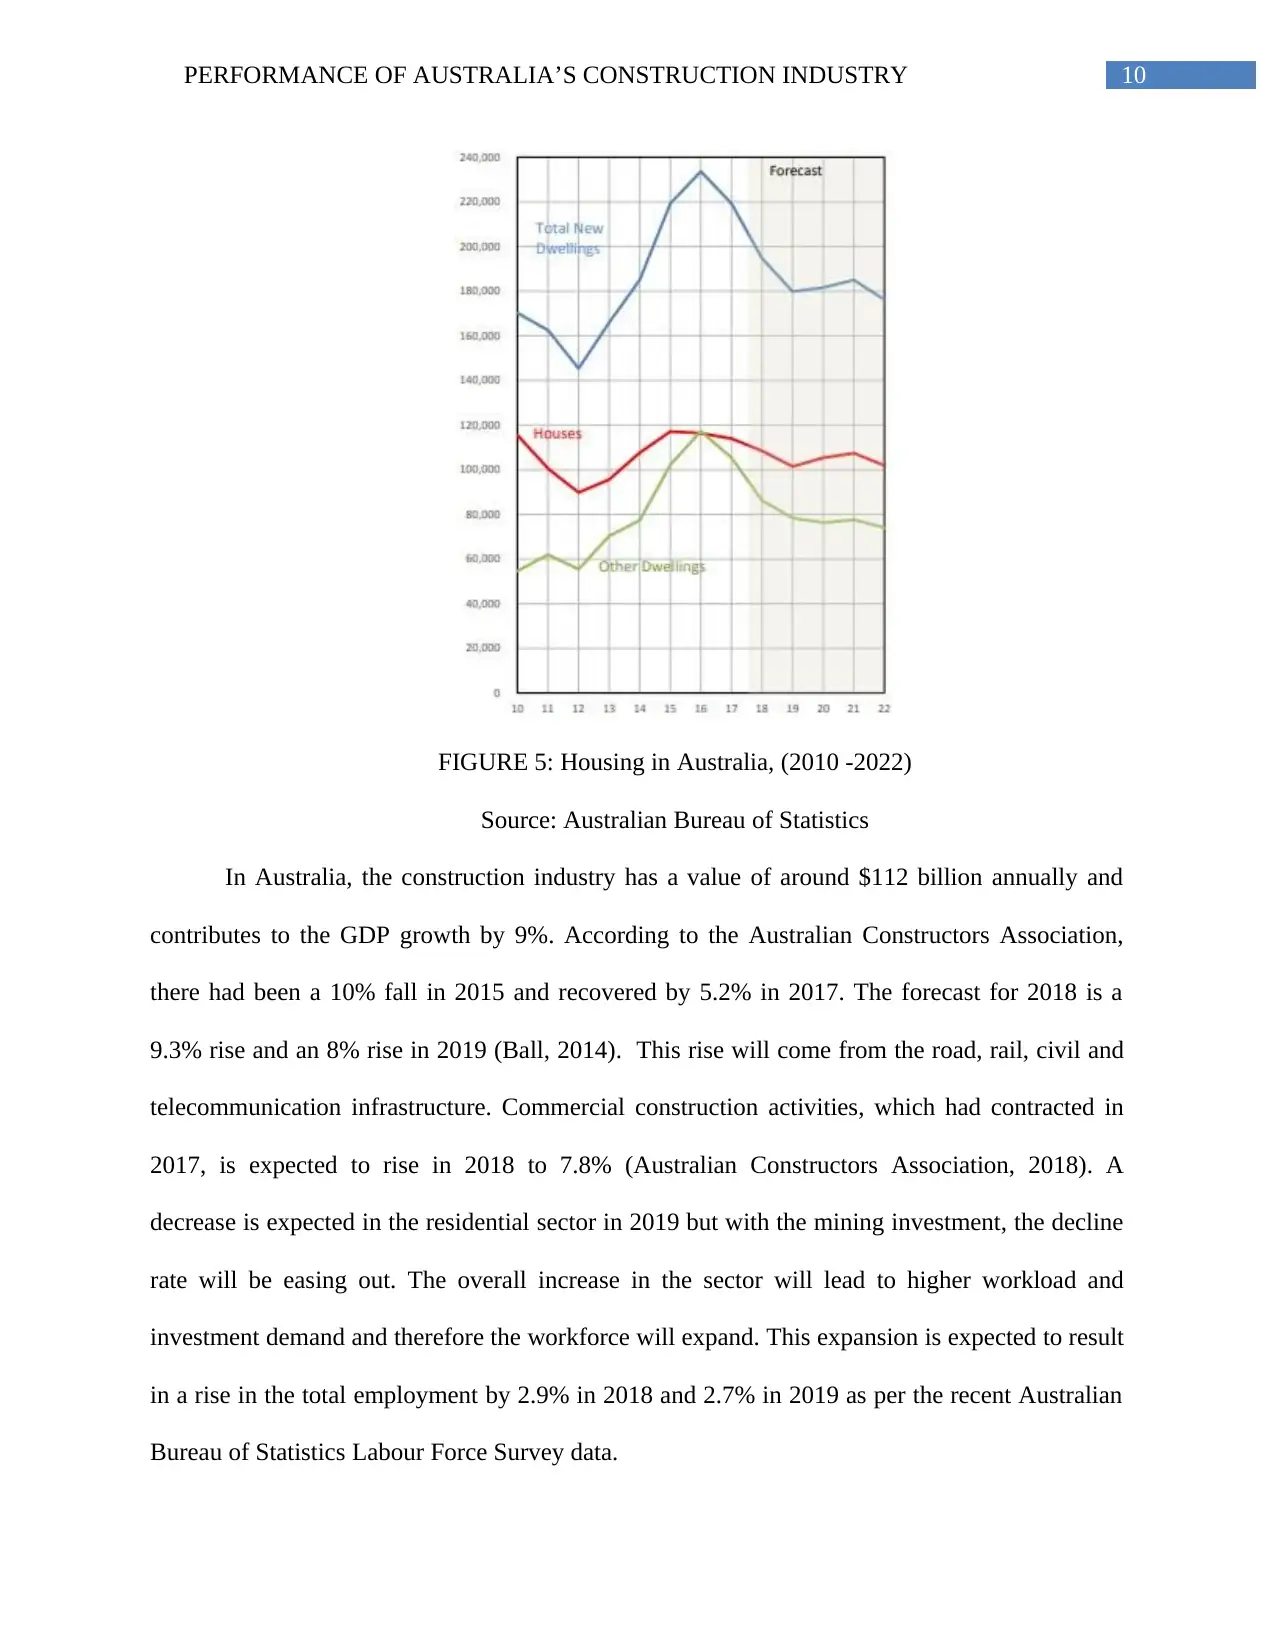
FIGURE 5: Housing in Australia, (2010 -2022)
Source: Australian Bureau of Statistics
In Australia, the construction industry has a value of around $112 billion annually and
contributes to the GDP growth by 9%. According to the Australian Constructors Association,
there had been a 10% fall in 2015 and recovered by 5.2% in 2017. The forecast for 2018 is a
9.3% rise and an 8% rise in 2019 (Ball, 2014). This rise will come from the road, rail, civil and
telecommunication infrastructure. Commercial construction activities, which had contracted in
2017, is expected to rise in 2018 to 7.8% (Australian Constructors Association, 2018). A
decrease is expected in the residential sector in 2019 but with the mining investment, the decline
rate will be easing out. The overall increase in the sector will lead to higher workload and
investment demand and therefore the workforce will expand. This expansion is expected to result
in a rise in the total employment by 2.9% in 2018 and 2.7% in 2019 as per the recent Australian
Bureau of Statistics Labour Force Survey data.
11PERFORMANCE OF AUSTRALIA’S CONSTRUCTION INDUSTRY
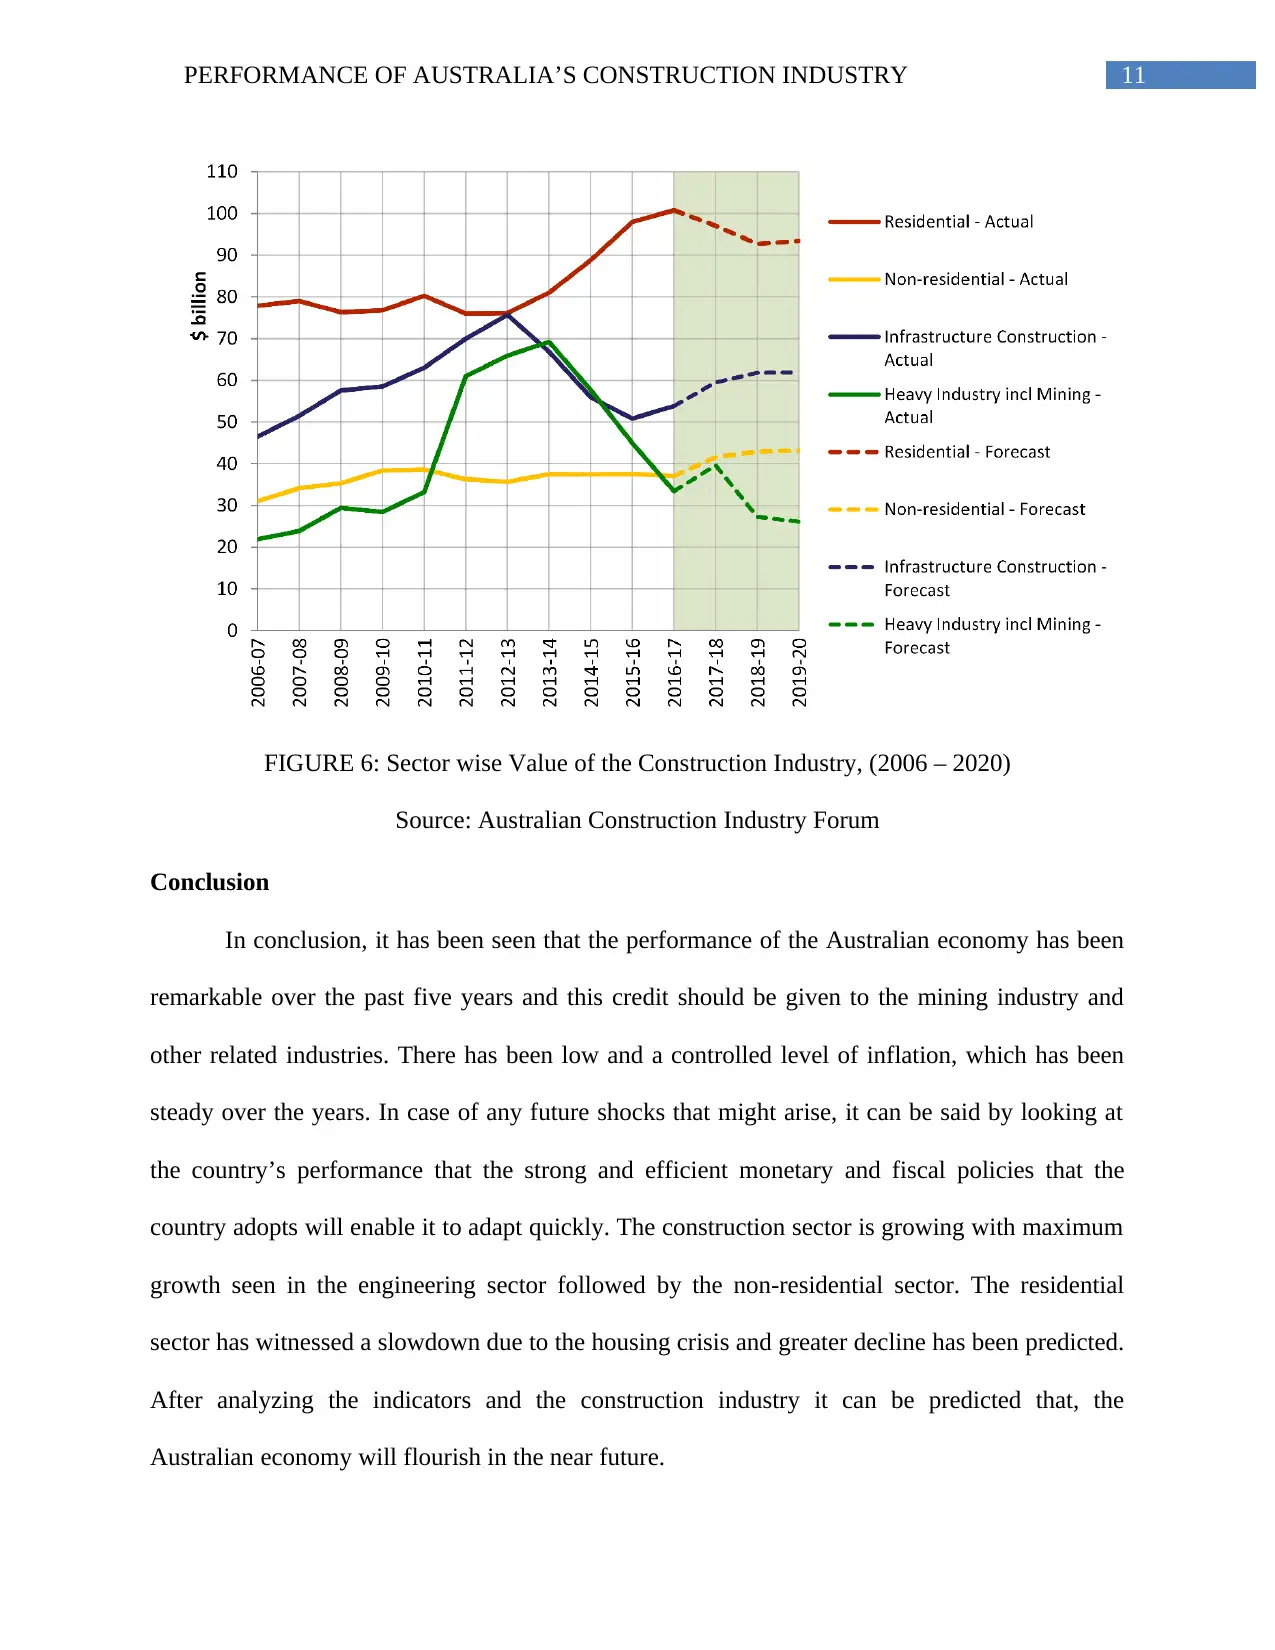
FIGURE 6: Sector wise Value of the Construction Industry, (2006 – 2020)
Source: Australian Construction Industry Forum
Conclusion
In conclusion, it has been seen that the performance of the Australian economy has been
remarkable over the past five years and this credit should be given to the mining industry and
other related industries. There has been low and a controlled level of inflation, which has been
steady over the years. In case of any future shocks that might arise, it can be said by looking at
the country’s performance that the strong and efficient monetary and fiscal policies that the
country adopts will enable it to adapt quickly. The construction sector is growing with maximum
growth seen in the engineering sector followed by the non-residential sector. The residential
sector has witnessed a slowdown due to the housing crisis and greater decline has been predicted.
After analyzing the indicators and the construction industry it can be predicted that, the
Australian economy will flourish in the near future.
⊘ This is a preview!⊘
Do you want full access?
Subscribe today to unlock all pages.
Trusted by 1+ million students worldwide
1 out of 19