Ask a question from expert
Average Life Expectancy Assignment PDF
14 Pages1328 Words108 Views
Added on 2021-10-06
Average Life Expectancy Assignment PDF
Added on 2021-10-06
BookmarkShareRelated Documents
Life Expectancy and Deaths 1
AVERAGE LIFE EXPECTANCY AND AGE-ADJUSTED DEATH RATE IN THE USA
By (Name)
The Name of the Class (Course)
Professor (Tutor)
The Name of the School (University)
The City and State where it is located
The Date
AVERAGE LIFE EXPECTANCY AND AGE-ADJUSTED DEATH RATE IN THE USA
By (Name)
The Name of the Class (Course)
Professor (Tutor)
The Name of the School (University)
The City and State where it is located
The Date
Life Expectancy and Deaths 2
Average Life Expectancy and Age-Adjusted Death Rate in the USA
Background and Motivation
The study of deaths and life expectancy are seen are crucial metrics that provide a base
on which health statistics and reports can be made. These reports are used make
recommendations to government agencies and social wellbeing stakeholders on appropriate
actions that can be taken to improve the situation[ CITATION Jia18 \l 1033 ]. Age-adjusted
death rate is used as a parameter to evaluate the rate of death for a specific population e.g. the
resident of Idaho. This metric does however take into consideration difference in age
composition and structures: thus differentiating it from a standard death rate measure of
population mortality. Understanding the distribution of deaths within genders, age-groups, and
races, allows for the formulation of policies and incentives that a tailored specifically to combat
mortality in a particular group e.g. young black men in the state of California[ CITATION
Dav121 \l 1033 ].
Illness and diseases are normally studies to aid in the determination of population
affliction and overall social welfare. A society that is overrun with illness will record lower
income per capita and contribute an insignificant percentage towards the national
GDP[ CITATION Mat17 \l 1033 ]. As such, the betterment of such a community is both in the
government's and societal members' best interests. The fields of pathology and epidemiology are
highly funded by governments across the world to ensure that the general population is awarded
the best possible health. The quality and accessibility of healthcare should be made universal for
all citizens, regardless of income, area of residence, race or gender[ CITATION PRB13 \l 1033 ].
Material for analysis
Life Expectancy and Deaths 3
There are two sets of data that are presented for analysis. The first set of data provides
information on average life expectancy and age-adjusted death rate for individuals based on their
sex and race. The data is for the time period between 1900 and 2015. Therefore there are five
variables in this first data set; of which two are categorical and the others are numeric. The
second set of data provides information on age-adjusted death rate and deaths for individuals
based on the state of residency, ailment/diseases, and the case of the disease. The data is made
available for the time period between 1999 and 2015. In this data set there are six variables: of
which three are categorical and the others are numeric. There are some outliners in the second set
of data which is brought about by inclusion of totals within the individual data items. For
instance, the total deaths associated with all causes in included in the data for individual causes;
as such, when plotting a graph there will be a considerably high figure for all causes compared to
other data items. Other outliners in the data are United States (states variable) and all causes (113
causes variable); this outliners should be removed from the data to prevent distortion of the
results.
Analytic approach
The main objective in the analytics segment is to generate visual representations of the
data in the two sets in a manner that is informative and helpful to decision-makers. The data has
been investigated with regard to different focus objective. For instance, the number of deaths
observed across all 52 American States. The output of proper visualization tools will be done to
ensure that the decision-maker's interest in the report is not diverted when he/she is reviewing the
result interpretations and recommendations. Tableau 2018 was employed as the visualization tool
of choice because of its ability to be easily manipulated and generate highly informative charts
Life Expectancy and Deaths 4
and graphs. Two graphical representation tools were used in the assessment bar graphs (stacked
and non-stacked) and line graphs.
Findings
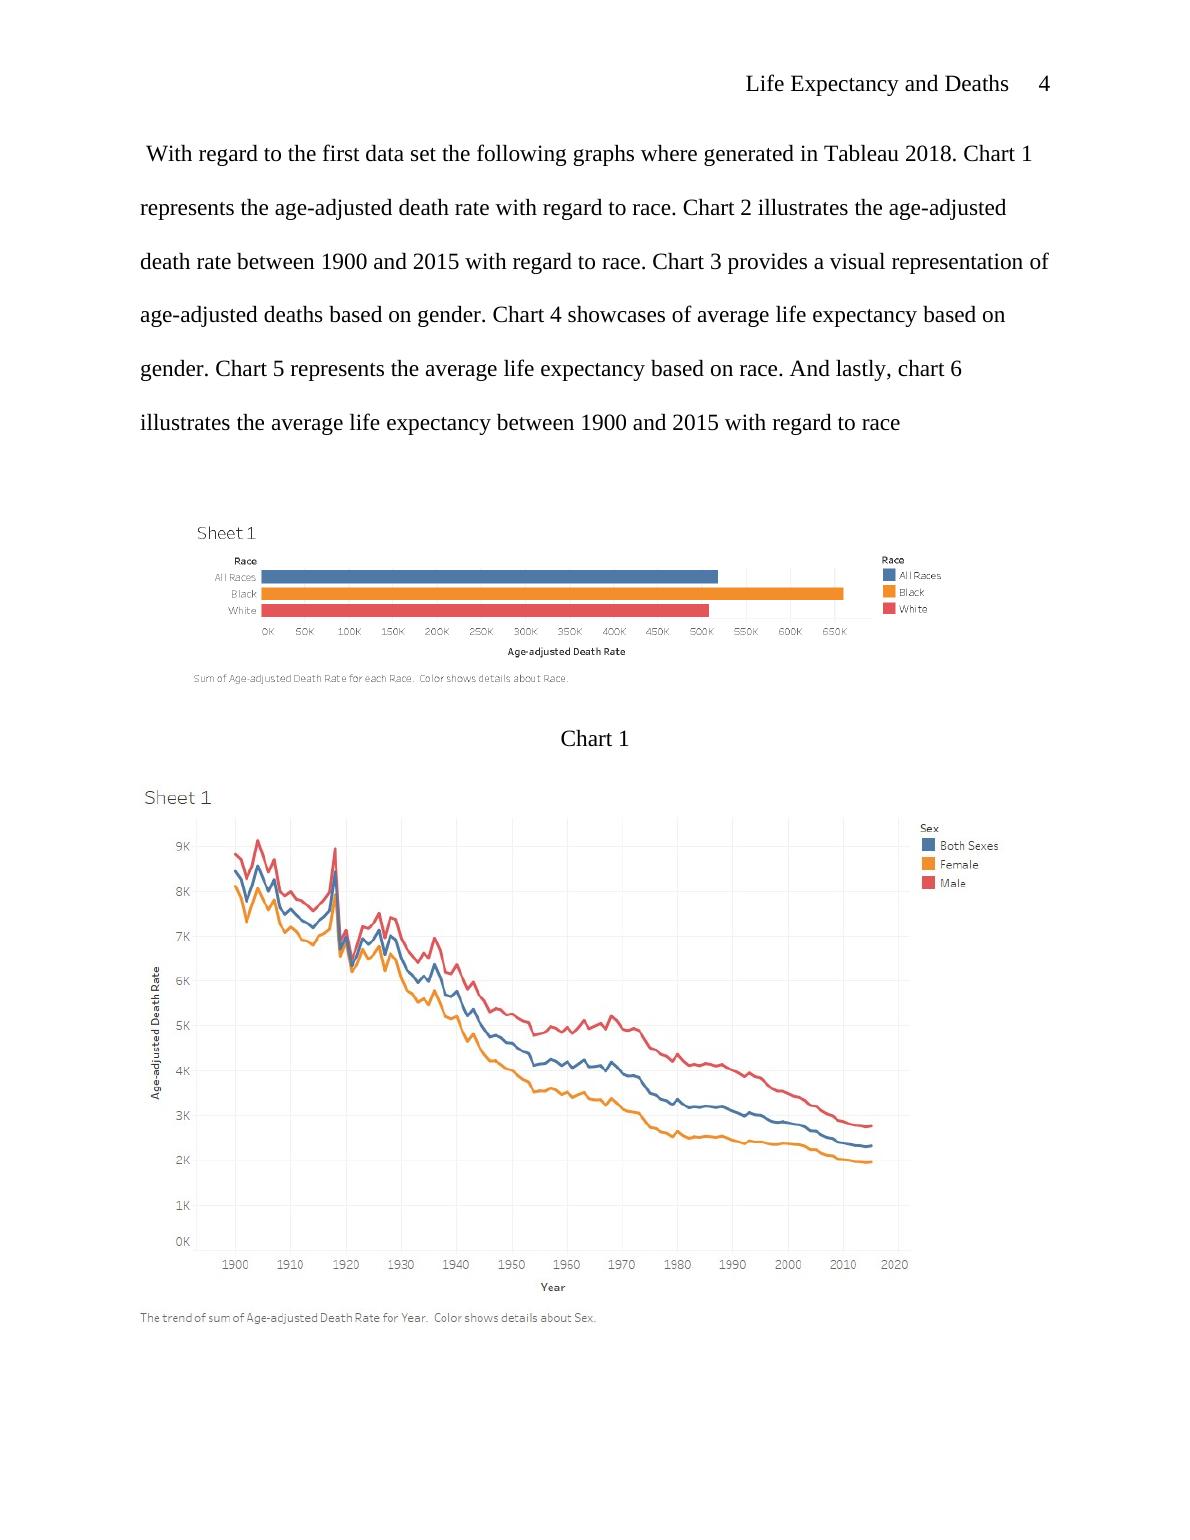
With regard to the first data set the following graphs where generated in Tableau 2018. Chart 1
represents the age-adjusted death rate with regard to race. Chart 2 illustrates the age-adjusted
death rate between 1900 and 2015 with regard to race. Chart 3 provides a visual representation of
age-adjusted deaths based on gender. Chart 4 showcases of average life expectancy based on
gender. Chart 5 represents the average life expectancy based on race. And lastly, chart 6
illustrates the average life expectancy between 1900 and 2015 with regard to race
Chart 1
and graphs. Two graphical representation tools were used in the assessment bar graphs (stacked
and non-stacked) and line graphs.
Findings
With regard to the first data set the following graphs where generated in Tableau 2018. Chart 1
represents the age-adjusted death rate with regard to race. Chart 2 illustrates the age-adjusted
death rate between 1900 and 2015 with regard to race. Chart 3 provides a visual representation of
age-adjusted deaths based on gender. Chart 4 showcases of average life expectancy based on
gender. Chart 5 represents the average life expectancy based on race. And lastly, chart 6
illustrates the average life expectancy between 1900 and 2015 with regard to race
Chart 1
End of preview
Want to access all the pages? Upload your documents or become a member.
Related Documents
Life Expectancy in New Zealand and Japan: A Comparisonlg...
|11
|2883
|257
Life expectancy Assignment PDFlg...
|11
|2892
|129
Data Analysis: Age-adjusted Death Rate and Average Life Expectancylg...
|31
|5888
|496
Assignment On Healthcare Introductionlg...
|11
|2151
|32
Assignment on Writing Literature Reviewslg...
|6
|1219
|114
Global Health GLOBAL HEALTH 1 Age at death and disabilitylg...
|10
|2878
|82